| Param | Original file | Final file |
|---|---|---|
| Filename | modeM0/AS1A12_102T01_9000005794_42306cztM0_level2.fits | modeM0/AS1A12_102T01_9000005794_42306cztM0_level2_quad_clean.evt |
| Size (bytes) | 204,811,200 | 55,431,360 |
| Size | 195.3 MB | 52.9 MB |
| Events in quadrant A | 1,805,514 | 373,550 |
| Events in quadrant B | 1,550,045 | 378,804 |
| Events in quadrant C | 1,605,813 | 362,229 |
| Events in quadrant D | 2,356,595 | 324,835 |
| Mode M9 | |||
|---|---|---|---|
| Quadrant | BADHDUFLAG | Total packets | Discarded packets |
| A | 0 | 12 | 0 |
| B | 0 | 12 | 0 |
| C | 0 | 12 | 0 |
| D | 0 | 12 | 0 |
| Mode SS | |||
|---|---|---|---|
| Quadrant | BADHDUFLAG | Total packets | Discarded packets |
| A | 0 | 72 | 0 |
| B | 0 | 72 | 0 |
| C | 0 | 72 | 0 |
| D | 0 | 72 | 0 |
| Mode M0 | |||
|---|---|---|---|
| Quadrant | BADHDUFLAG | Total packets | Discarded packets |
| A | 0 | 7266 | 1 |
| B | 0 | 6944 | 1 |
| C | 0 | 6848 | 1 |
| D | 0 | 9400 | 1 |
| Quadrant | Total seconds | Saturated seconds | Saturation percentage |
|---|---|---|---|
| A | 3361 | 6 | 0.178518% |
| B | 3361 | 11 | 0.327284% |
| C | 3361 | 7 | 0.208271% |
| D | 3361 | 196 | 5.831598% |
Noise dominated data is calculated using 1-second bins in cleaned event files. If a bin has >2000 counts, and if more than 50% of those come from <1% of pixels, then it is considered to be noise-dominated and hence unusable.
| Quadrant | # 1 sec bins | Bins with >0 counts | Bins with >2000 counts | High rate bins dominated by noise | Noise dominated (total time) | Noise dominated (detector-on time) | Marked lightcurve |
|---|---|---|---|---|---|---|---|
| A | 4642 | 3362 | 2 | 2 | 0.04% | 0.06% | 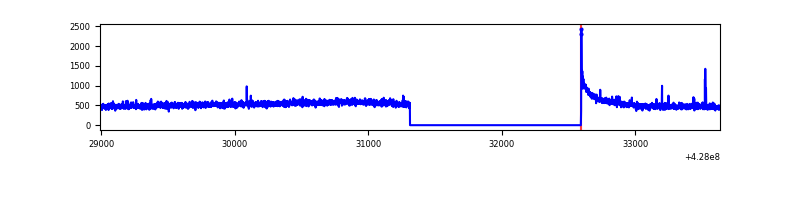 |
| B | 4642 | 3362 | 2 | 2 | 0.04% | 0.06% | 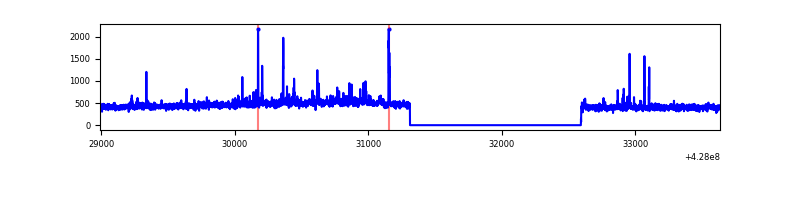 |
| C | 4642 | 3362 | 0 | 0 | 0.00% | 0.00% | 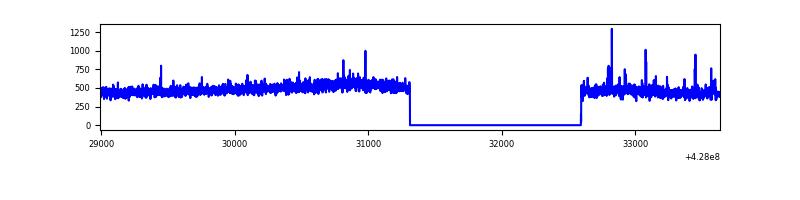 |
| D | 4642 | 3362 | 157 | 157 | 3.38% | 4.67% | 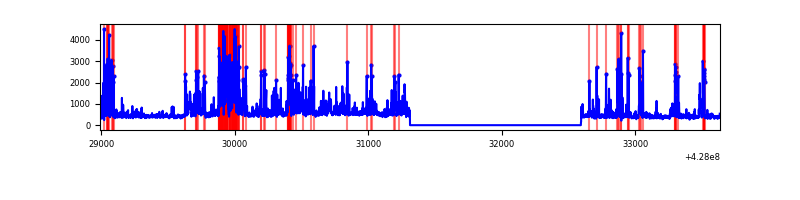 |
Top three noisy pixels from each quadrant. If the there are fewer than three noisy pixels in the level2.evt file, extra rows are filled as -1
| Pixel properties | Quadrant properties | ||||||
|---|---|---|---|---|---|---|---|
| Quadrant | DetID | PixID | Counts | Sigma | Mean | Median | Sigma |
| A | 10 | 83 | 328717 | 4175.93 | 377 | 369 | 78.6 |
| A | 7 | 3 | 10759 | 132.14 | 377 | 369 | 78.6 |
| A | 13 | 254 | 4235 | 49.17 | 377 | 369 | 78.6 |
| B | 4 | 171 | 61454 | 818.99 | 372 | 361 | 74.6 |
| B | 12 | 111 | 9211 | 118.64 | 372 | 361 | 74.6 |
| B | 0 | 229 | 8833 | 113.57 | 372 | 361 | 74.6 |
| C | 15 | 214 | 140710 | 1600.17 | 368 | 369 | 87.7 |
| C | 15 | 159 | 20761 | 232.51 | 368 | 369 | 87.7 |
| C | 12 | 249 | 4665 | 48.98 | 368 | 369 | 87.7 |
| D | 1 | 52 | 580344 | 6380.34 | 361 | 349 | 90.9 |
| D | 12 | 6 | 177538 | 1949.2 | 361 | 349 | 90.9 |
| D | 12 | 233 | 139426 | 1529.94 | 361 | 349 | 90.9 |
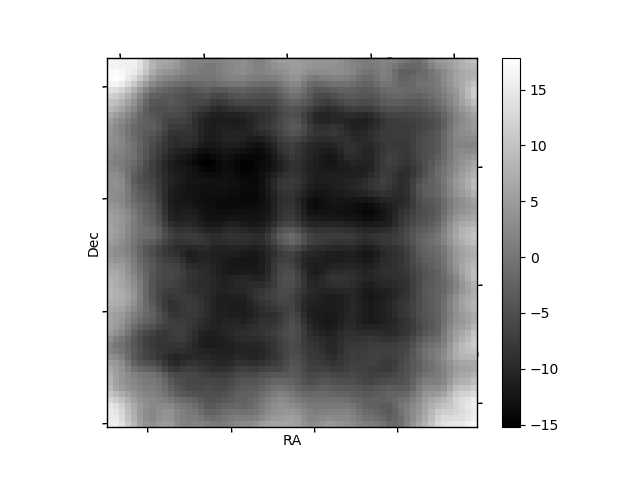
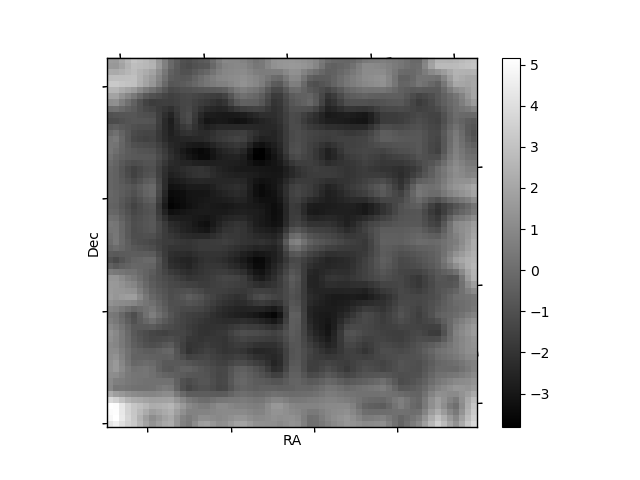
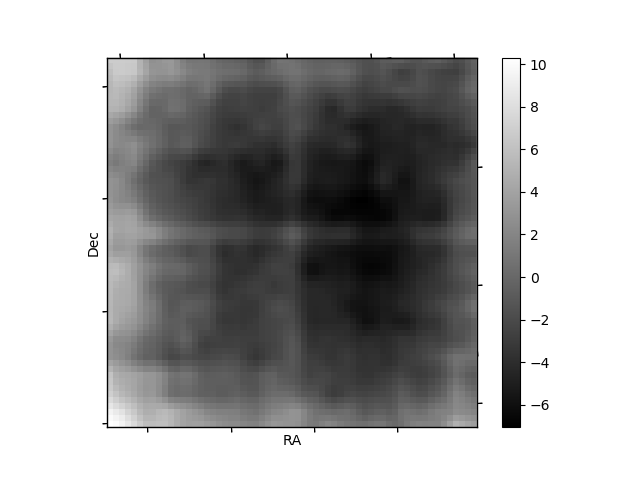
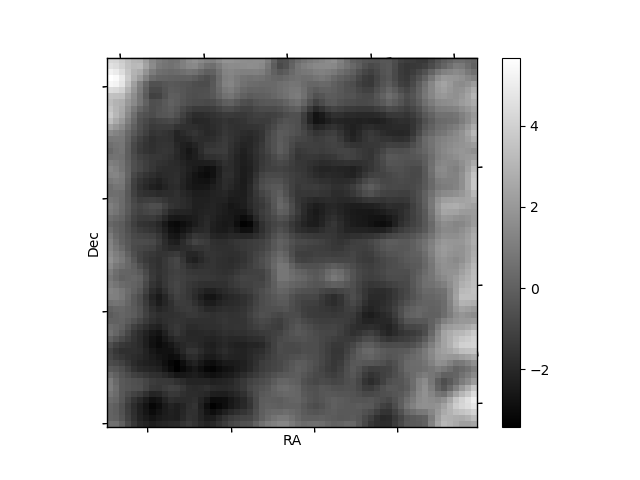
Histogram calculated using DETX and DETY for each event in the final _common_clean file
| Quadrant A | 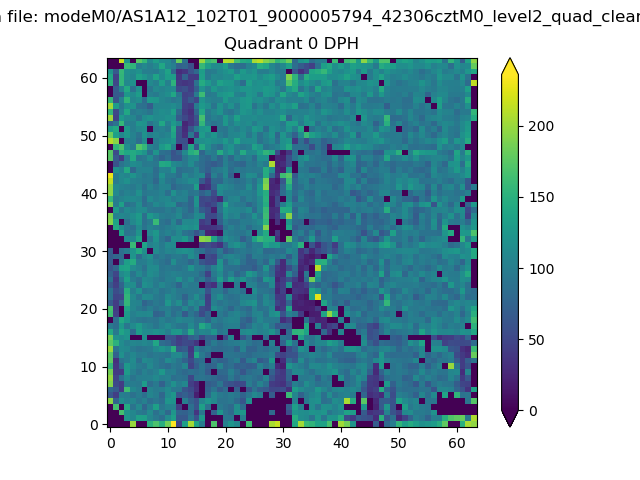 |
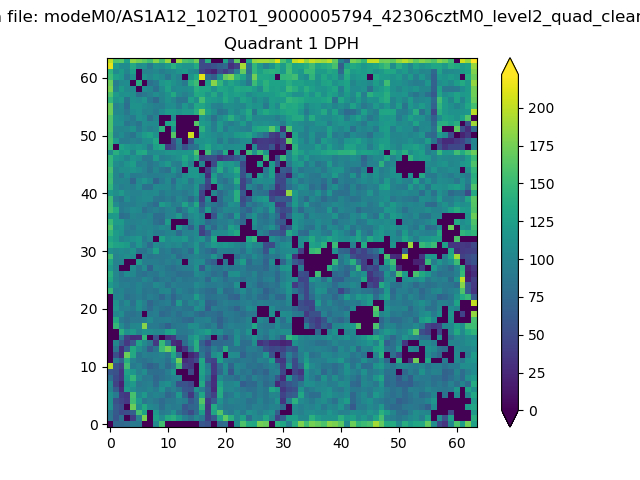 |
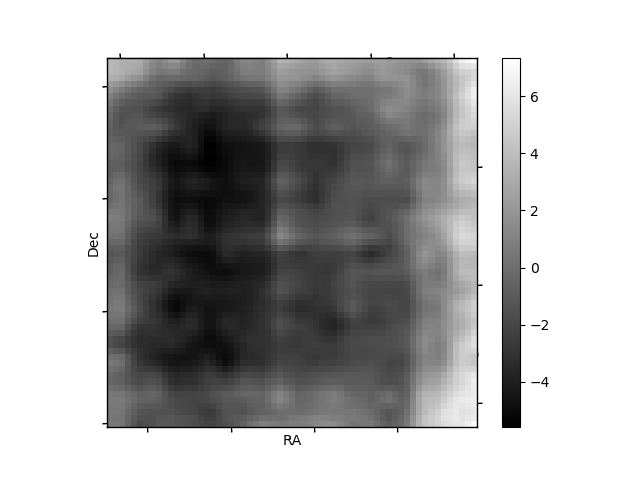
Quadrant B |
|---|---|---|---|
| Quadrant D |  |
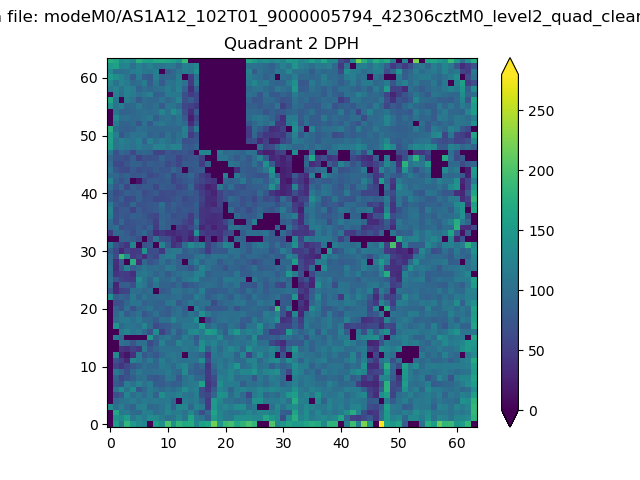 |
Quadrant C |
| Plot type | Count rate plots | Images |
|---|---|---|
| Comparison with Poisson distribution Blue bars denote a histogram of data divided into 1 sec bins. Red curve is a Poisson curve with rate = median count rate of data. |
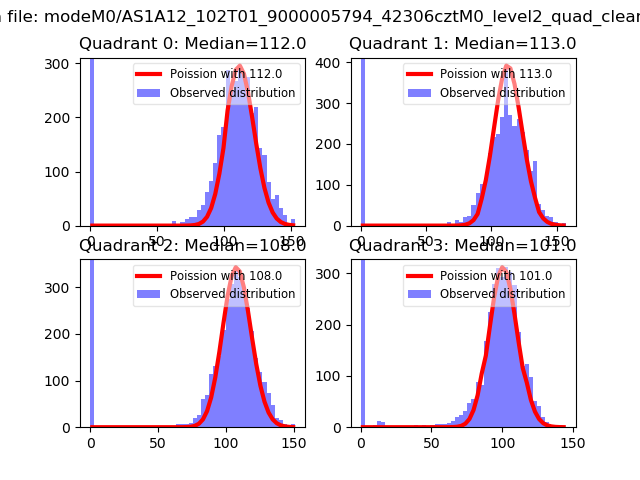 |
 |
| Quadrant-wise count rates Data is divided into 100 sec bins |
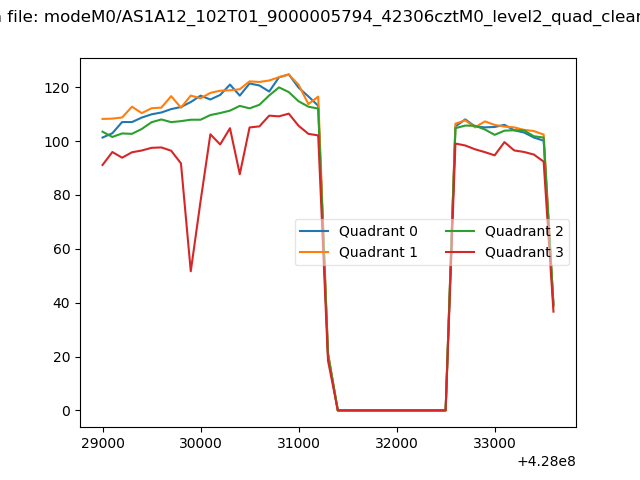 |
|
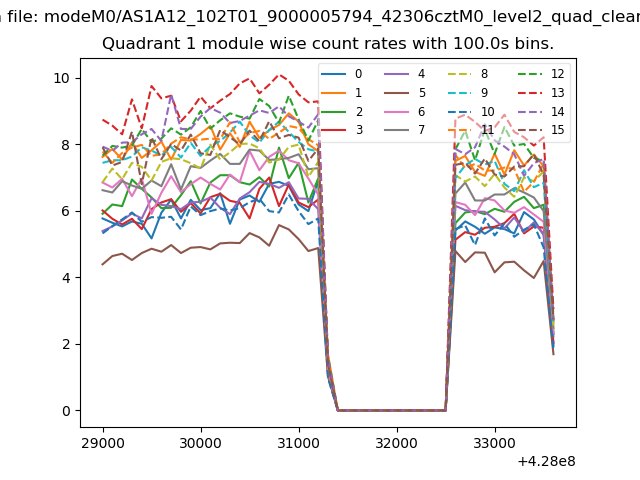
| Module-wise count rates for Quadrant A Data is divided into 100 sec bins |
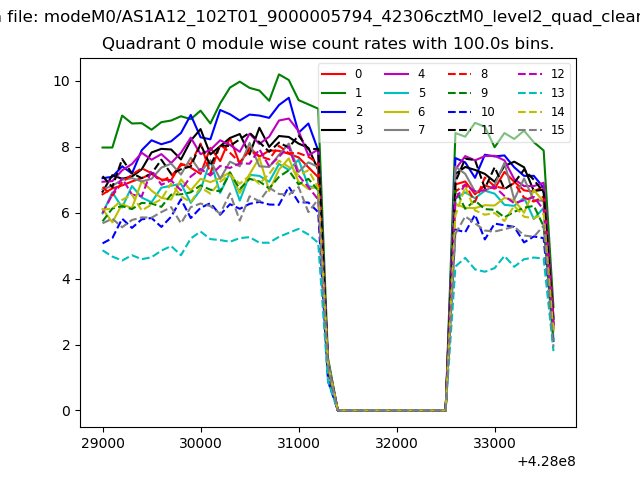 |
 |
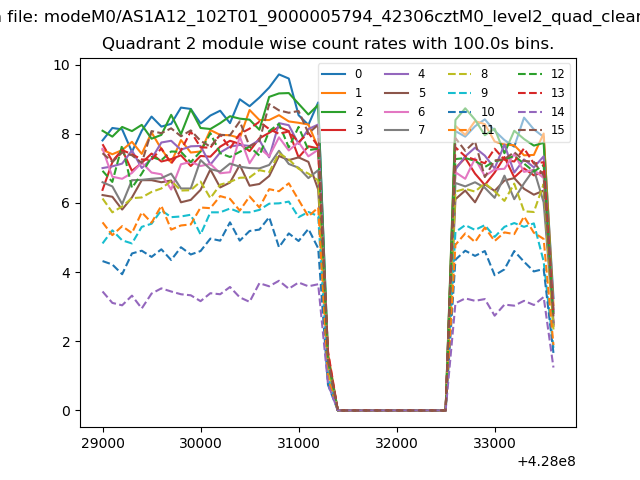
| Module-wise count rates for Quadrant B Data is divided into 100 sec bins |
 |
 |
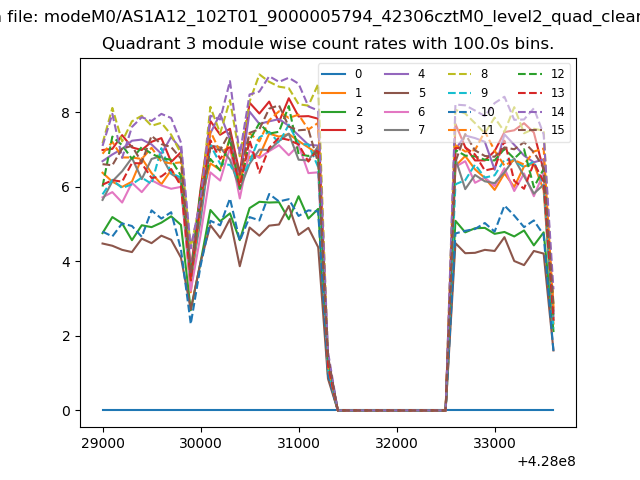
| Module-wise count rates for Quadrant C Data is divided into 100 sec bins |
 |
 |
| Module-wise count rates for Quadrant D Data is divided into 100 sec bins |
 |
 |
| Parameter | Plot |
|---|---|
| CZT HV Monitor | 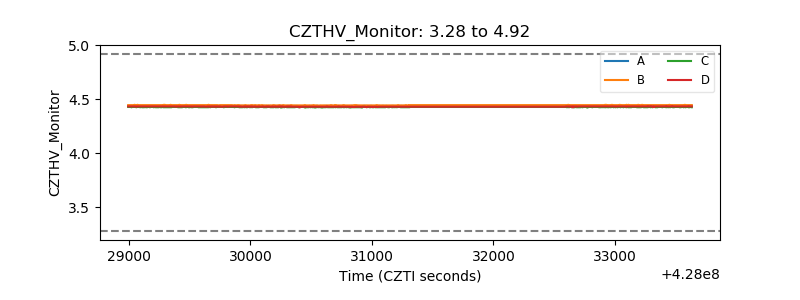 |
| D_VDD | 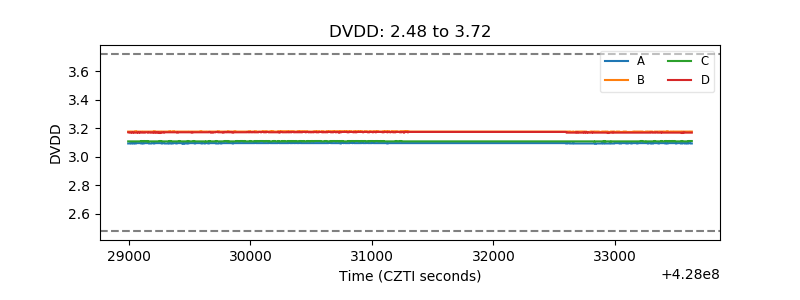 |
| Temperature 1 | 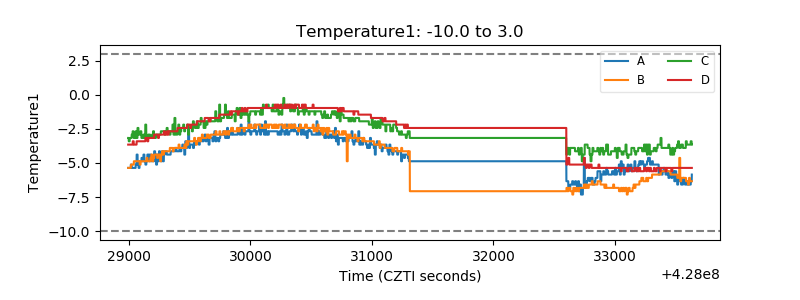 |
| Veto HV Monitor |  |
| Veto LLD | 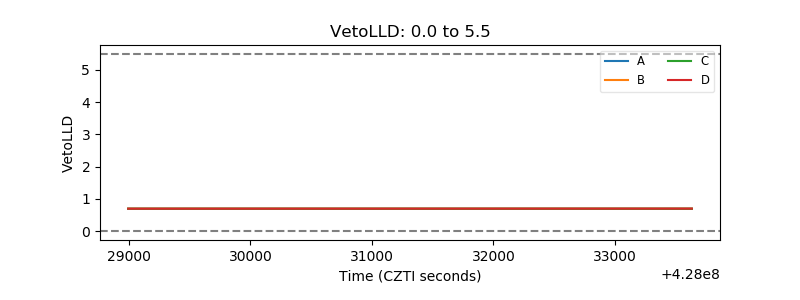 |
| Alpha Counter | 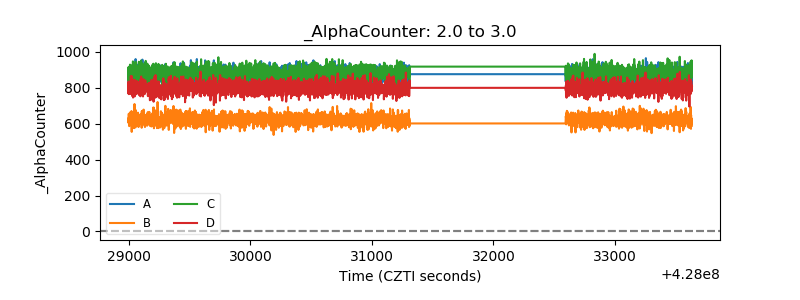 |
| _CPM_Rate |  |
| CZT Counter | 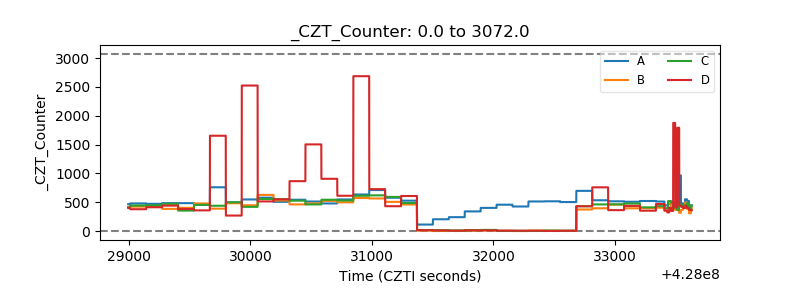 |
| +2.5 Volts monitor |  |
| +5 Volts monitor |  |
| _ROLL_ROT | 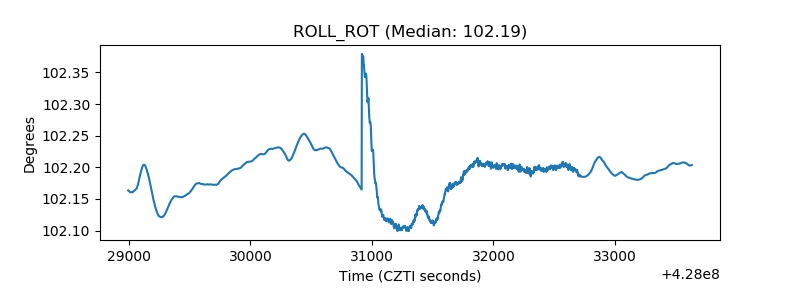 |
| _Roll_DEC | 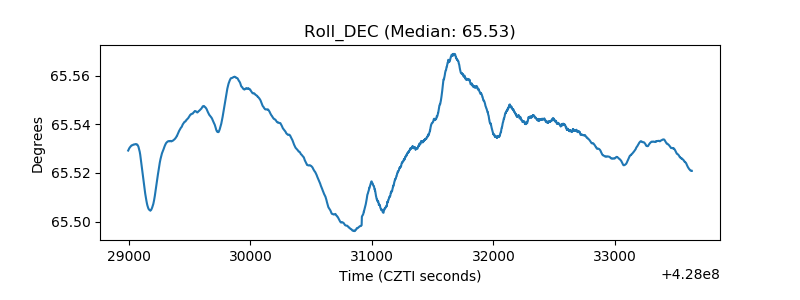 |
| _Roll_RA | 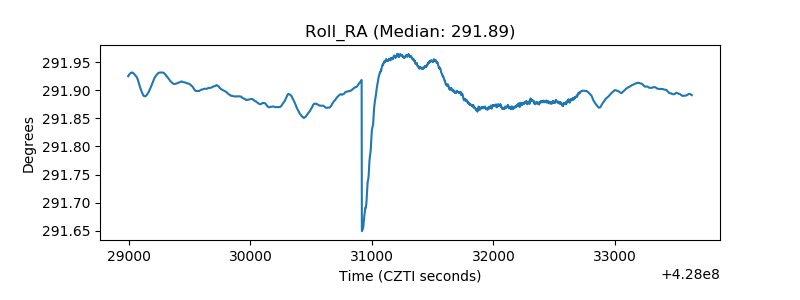 |
| Veto Counter | 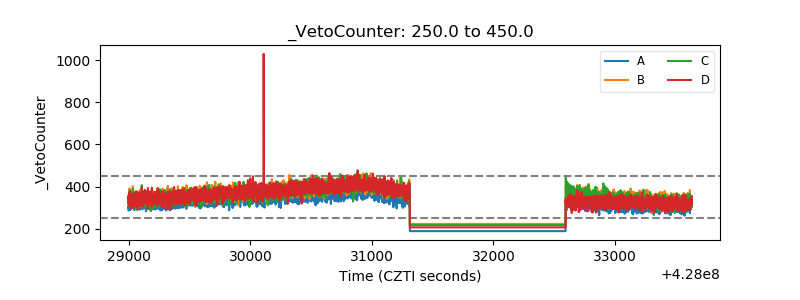 |