| Param | Original file | Final file |
|---|---|---|
| Filename | modeM0/AS1A12_102T01_9000005794_42312cztM0_level2.fits | modeM0/AS1A12_102T01_9000005794_42312cztM0_level2_quad_clean.evt |
| Size (bytes) | 332,173,440 | 93,764,160 |
| Size | 316.8 MB | 89.4 MB |
| Events in quadrant A | 3,222,746 | 634,548 |
| Events in quadrant B | 2,605,118 | 647,582 |
| Events in quadrant C | 2,664,590 | 612,310 |
| Events in quadrant D | 3,367,355 | 552,962 |
| Mode M9 | |||
|---|---|---|---|
| Quadrant | BADHDUFLAG | Total packets | Discarded packets |
| A | 0 | 26 | 0 |
| B | 0 | 26 | 0 |
| C | 0 | 27 | 0 |
| D | 0 | 27 | 0 |
| Mode SS | |||
|---|---|---|---|
| Quadrant | BADHDUFLAG | Total packets | Discarded packets |
| A | 0 | 114 | 0 |
| B | 0 | 114 | 0 |
| C | 0 | 114 | 0 |
| D | 0 | 114 | 0 |
| Mode M0 | |||
|---|---|---|---|
| Quadrant | BADHDUFLAG | Total packets | Discarded packets |
| A | 0 | 12857 | 2 |
| B | 0 | 11656 | 2 |
| C | 0 | 11392 | 2 |
| D | 0 | 13878 | 2 |
| Quadrant | Total seconds | Saturated seconds | Saturation percentage |
|---|---|---|---|
| A | 5599 | 38 | 0.678693% |
| B | 5599 | 30 | 0.535810% |
| C | 5599 | 7 | 0.125022% |
| D | 5599 | 238 | 4.250759% |
Noise dominated data is calculated using 1-second bins in cleaned event files. If a bin has >2000 counts, and if more than 50% of those come from <1% of pixels, then it is considered to be noise-dominated and hence unusable.
| Quadrant | # 1 sec bins | Bins with >0 counts | Bins with >2000 counts | High rate bins dominated by noise | Noise dominated (total time) | Noise dominated (detector-on time) | Marked lightcurve |
|---|---|---|---|---|---|---|---|
| A | 7362 | 5600 | 19 | 19 | 0.26% | 0.34% | 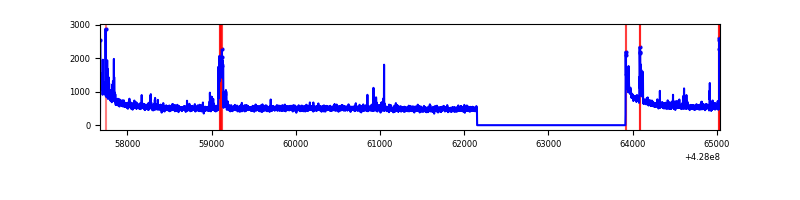 |
| B | 7362 | 5600 | 25 | 25 | 0.34% | 0.45% | 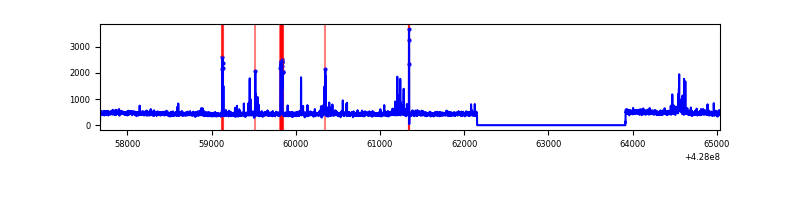 |
| C | 7362 | 5600 | 3 | 3 | 0.04% | 0.05% | 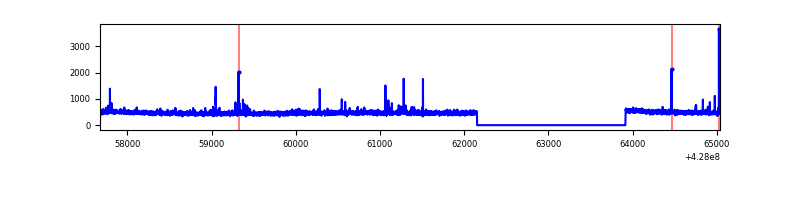 |
| D | 7362 | 5600 | 211 | 211 | 2.87% | 3.77% | 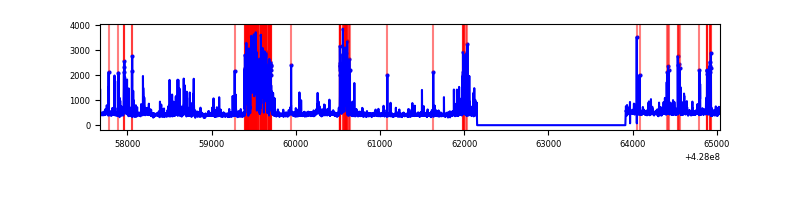 |
Top three noisy pixels from each quadrant. If the there are fewer than three noisy pixels in the level2.evt file, extra rows are filled as -1
| Pixel properties | Quadrant properties | ||||||
|---|---|---|---|---|---|---|---|
| Quadrant | DetID | PixID | Counts | Sigma | Mean | Median | Sigma |
| A | 10 | 83 | 597432 | 4681.87 | 625 | 613 | 127.5 |
| A | 15 | 235 | 88997 | 693.35 | 625 | 613 | 127.5 |
| A | 7 | 3 | 74194 | 577.22 | 625 | 613 | 127.5 |
| B | 15 | 35 | 75396 | 633.92 | 617 | 600 | 118.0 |
| B | 3 | 112 | 53258 | 446.29 | 617 | 600 | 118.0 |
| B | 5 | 172 | 31004 | 257.68 | 617 | 600 | 118.0 |
| C | 15 | 214 | 235086 | 1674.85 | 604 | 608 | 140.0 |
| C | 15 | 159 | 43314 | 305.04 | 604 | 608 | 140.0 |
| C | 12 | 249 | 28885 | 201.98 | 604 | 608 | 140.0 |
| D | 12 | 233 | 615256 | 4216.29 | 600 | 583 | 145.8 |
| D | 1 | 52 | 178200 | 1218.35 | 600 | 583 | 145.8 |
| D | 12 | 6 | 117217 | 800.04 | 600 | 583 | 145.8 |
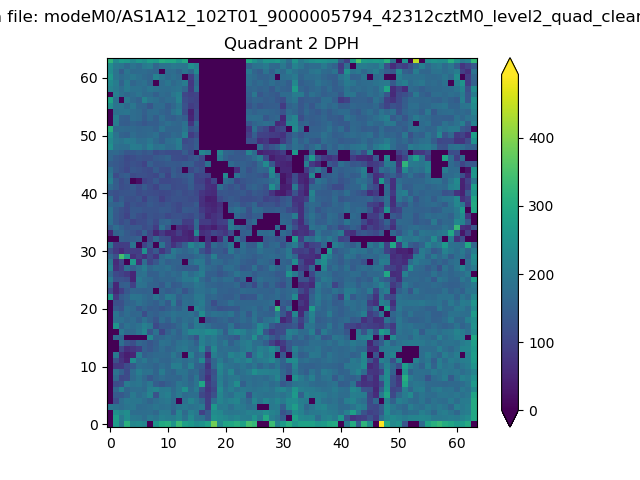
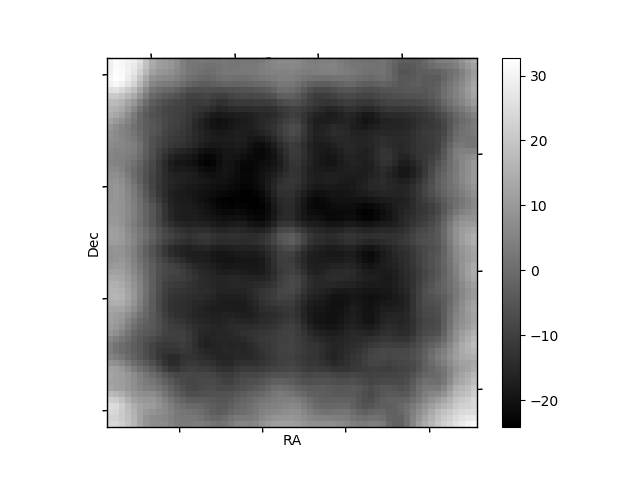
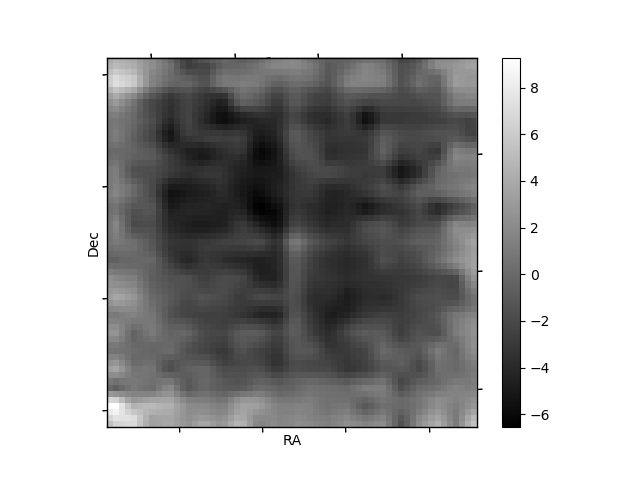
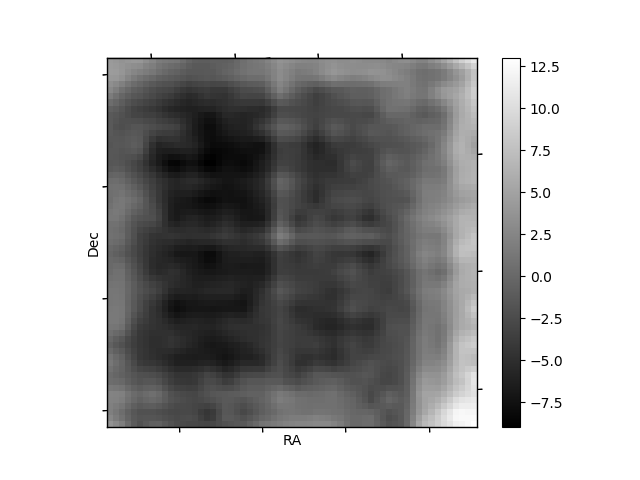
Histogram calculated using DETX and DETY for each event in the final _common_clean file
| Quadrant A | 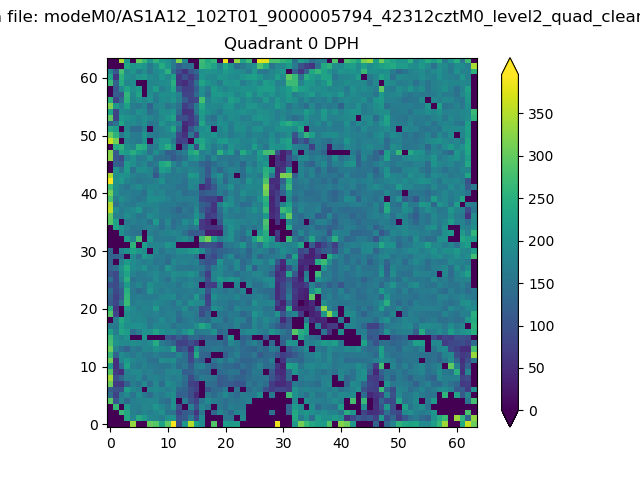 |
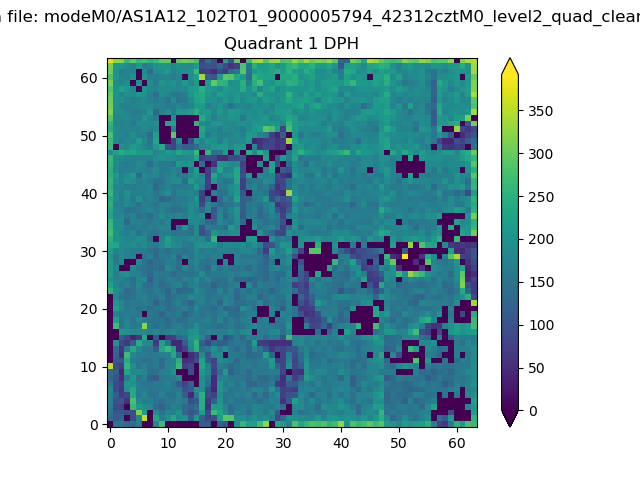 |
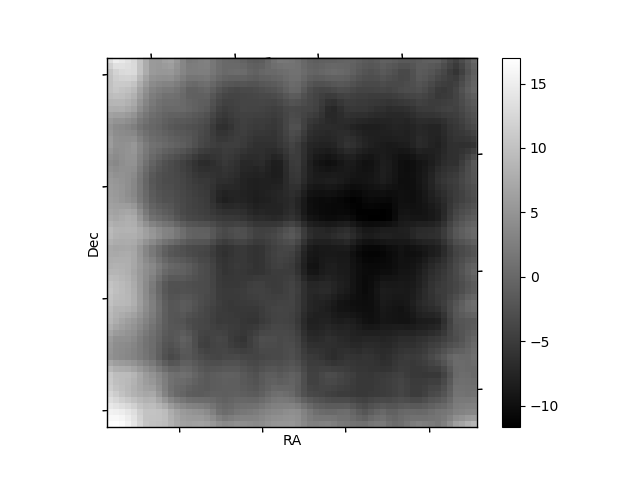
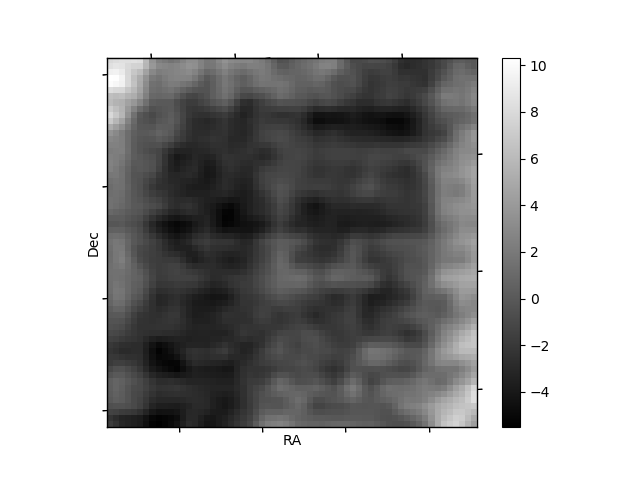
Quadrant B |
|---|---|---|---|
| Quadrant D | 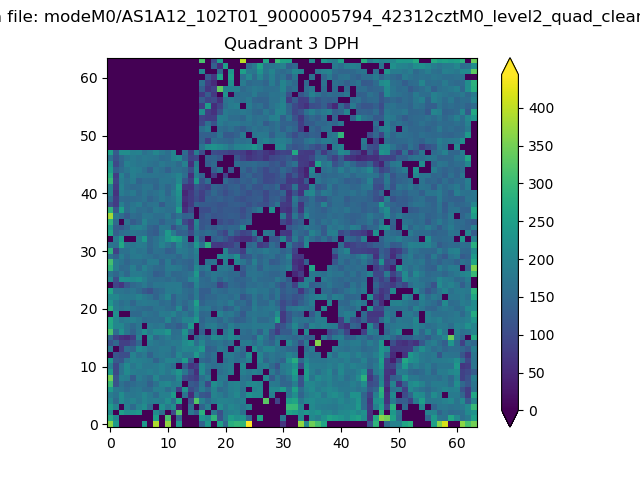 |
 |
Quadrant C |
| Plot type | Count rate plots | Images |
|---|---|---|
| Comparison with Poisson distribution Blue bars denote a histogram of data divided into 1 sec bins. Red curve is a Poisson curve with rate = median count rate of data. |
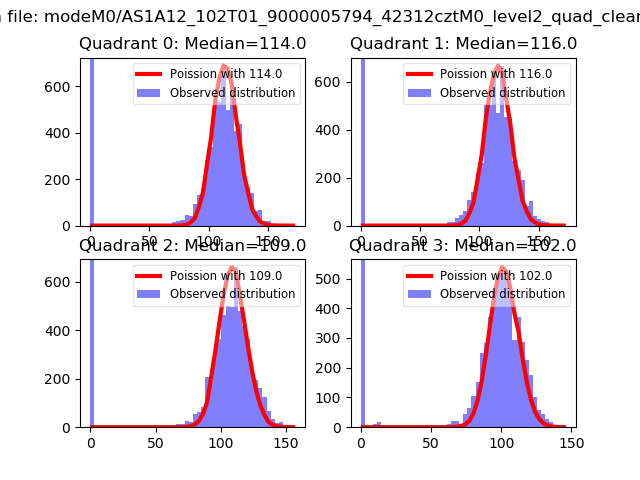 |
 |
| Quadrant-wise count rates Data is divided into 100 sec bins |
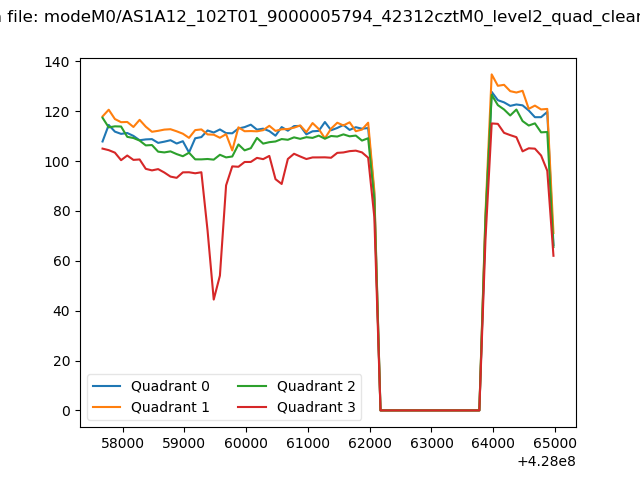 |
|
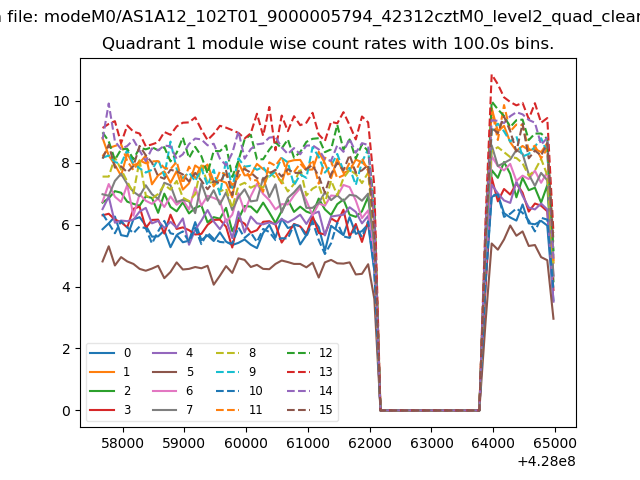
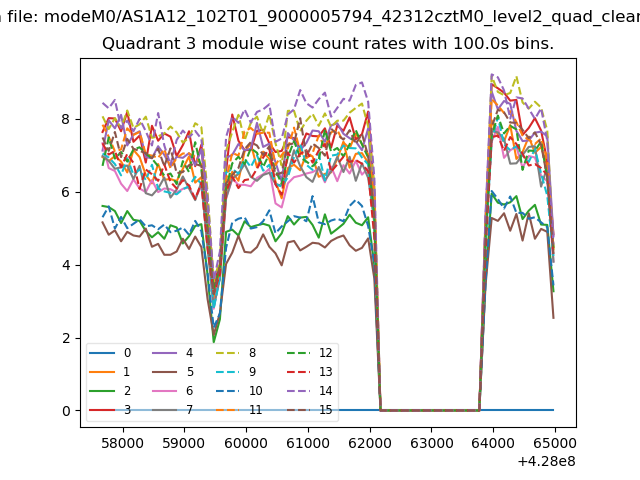
| Module-wise count rates for Quadrant A Data is divided into 100 sec bins |
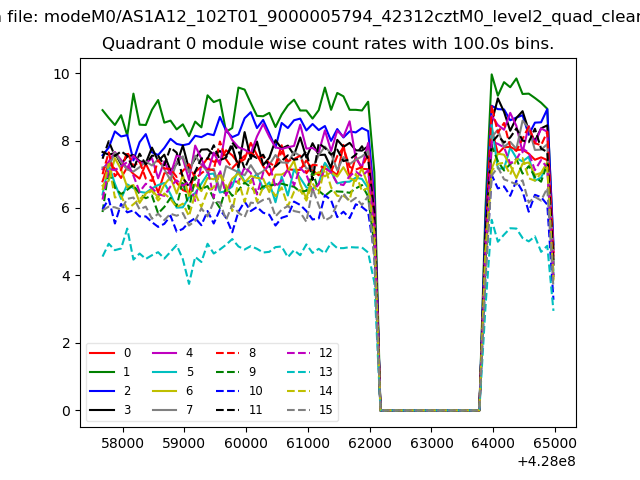 |
 |
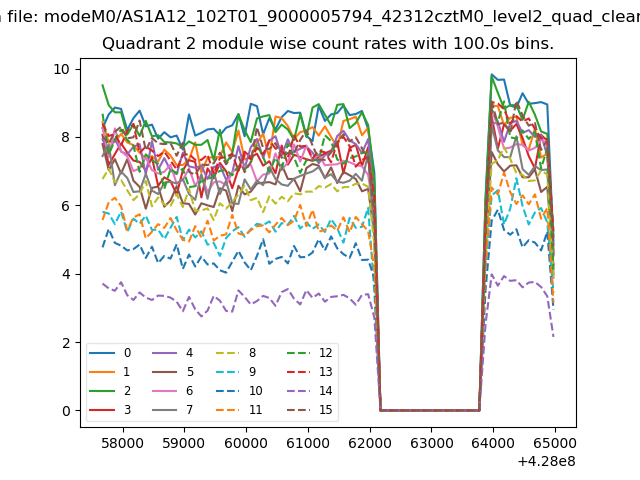
| Module-wise count rates for Quadrant B Data is divided into 100 sec bins |
 |
 |
| Module-wise count rates for Quadrant C Data is divided into 100 sec bins |
 |
 |
| Module-wise count rates for Quadrant D Data is divided into 100 sec bins |
 |
 |
| Parameter | Plot |
|---|---|
| CZT HV Monitor | 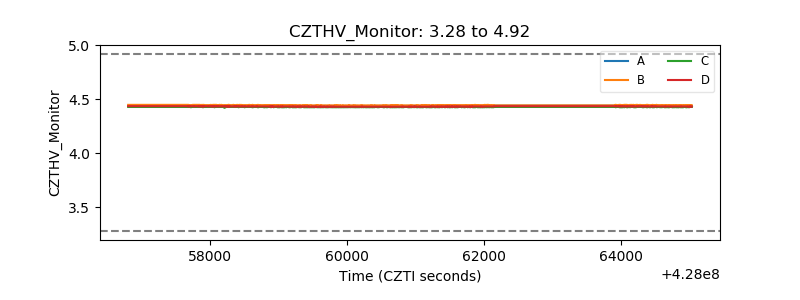 |
| D_VDD | 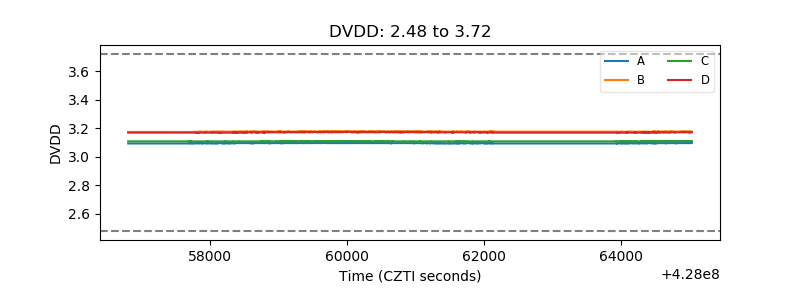 |
| Temperature 1 | 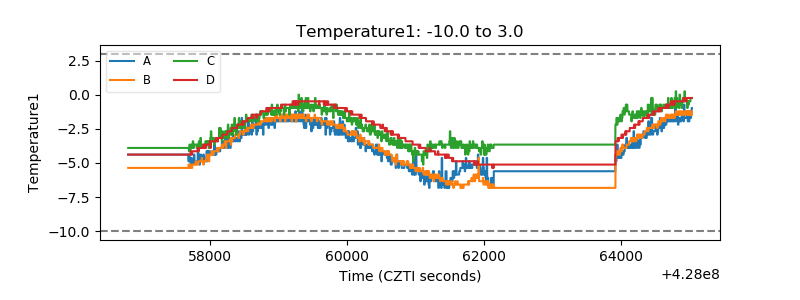 |
| Veto HV Monitor | 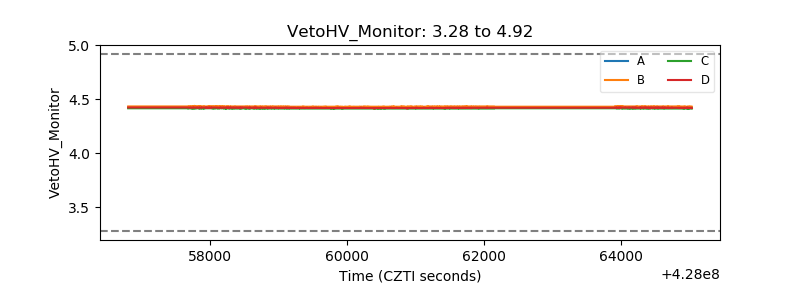 |
| Veto LLD | 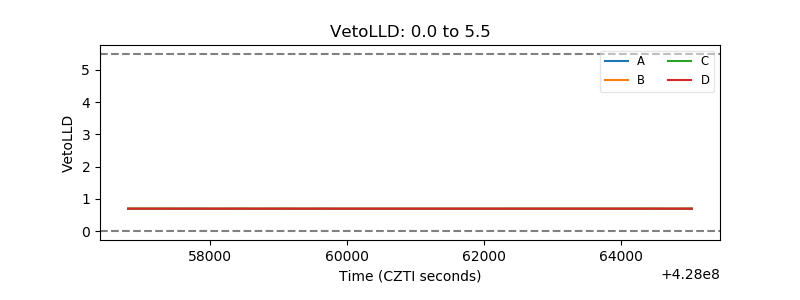 |
| Alpha Counter | 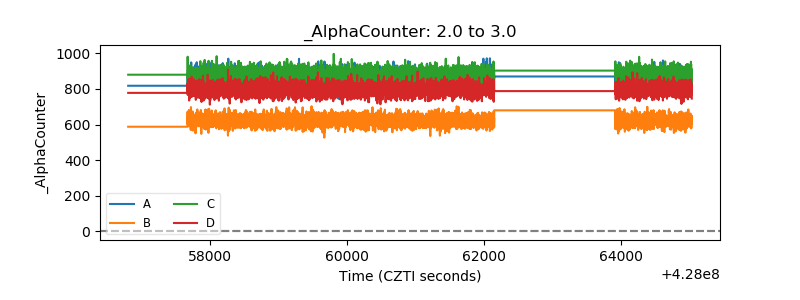 |
| _CPM_Rate | 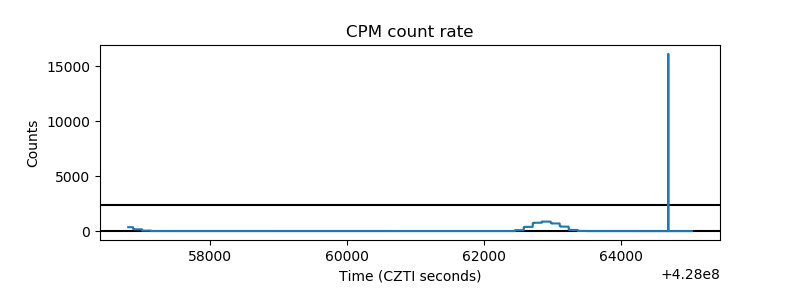 |
| CZT Counter | 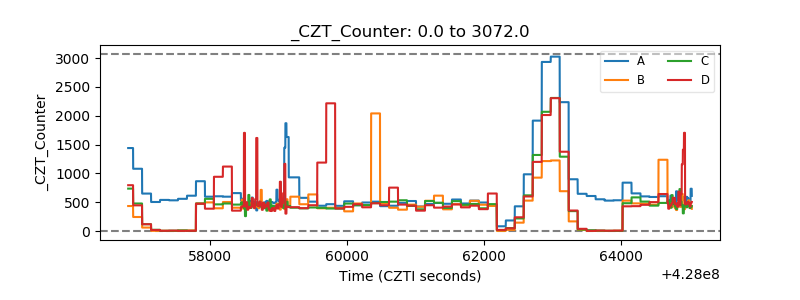 |
| +2.5 Volts monitor | 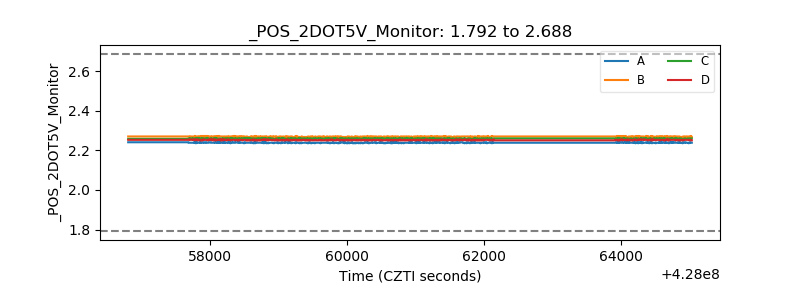 |
| +5 Volts monitor | 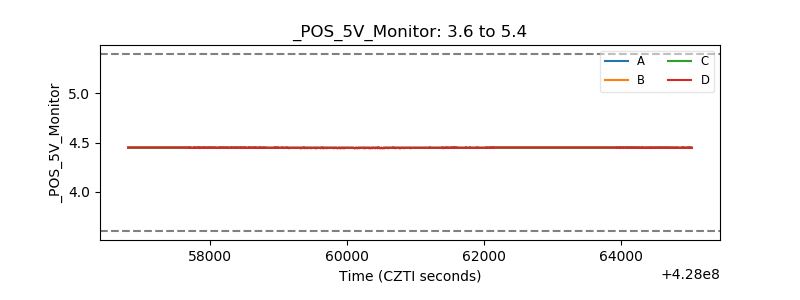 |
| _ROLL_ROT | 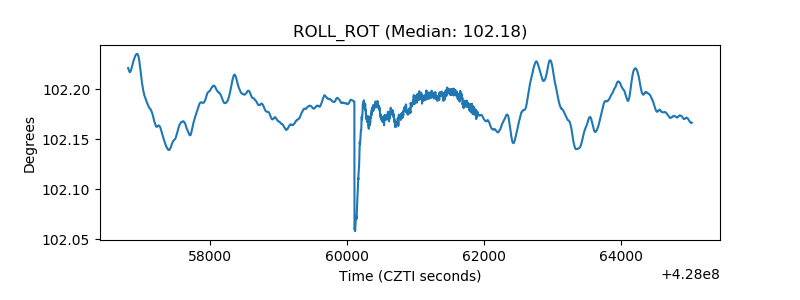 |
| _Roll_DEC | 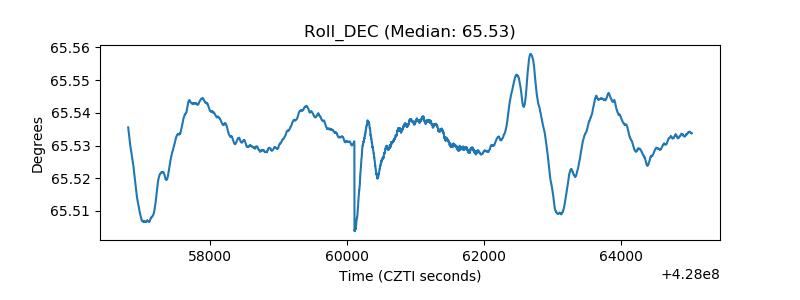 |
| _Roll_RA | 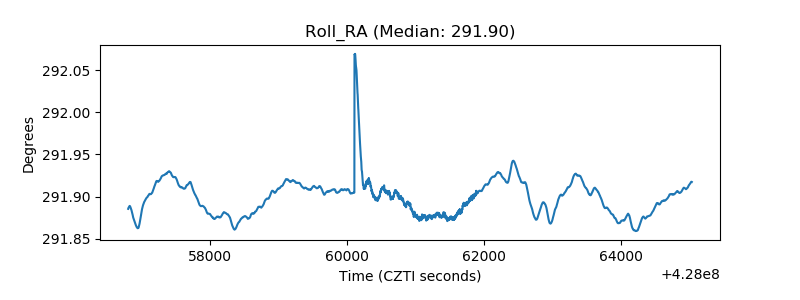 |
| Veto Counter |  |