| Param | Original file | Final file |
|---|---|---|
| Filename | modeM0/AS1A12_102T01_9000005794_42313cztM0_level2.fits | modeM0/AS1A12_102T01_9000005794_42313cztM0_level2_quad_clean.evt |
| Size (bytes) | 322,735,680 | 96,177,600 |
| Size | 307.8 MB | 91.7 MB |
| Events in quadrant A | 3,197,115 | 656,569 |
| Events in quadrant B | 2,540,002 | 667,940 |
| Events in quadrant C | 2,619,784 | 628,093 |
| Events in quadrant D | 3,165,621 | 578,895 |
| Mode M9 | |||
|---|---|---|---|
| Quadrant | BADHDUFLAG | Total packets | Discarded packets |
| A | 0 | 28 | 0 |
| B | 0 | 28 | 0 |
| C | 0 | 29 | 0 |
| D | 0 | 29 | 0 |
| Mode SS | |||
|---|---|---|---|
| Quadrant | BADHDUFLAG | Total packets | Discarded packets |
| A | 0 | 110 | 0 |
| B | 0 | 110 | 0 |
| C | 0 | 110 | 0 |
| D | 0 | 110 | 0 |
| Mode M0 | |||
|---|---|---|---|
| Quadrant | BADHDUFLAG | Total packets | Discarded packets |
| A | 0 | 12775 | 2 |
| B | 0 | 11208 | 2 |
| C | 0 | 11066 | 2 |
| D | 0 | 13022 | 2 |
| Quadrant | Total seconds | Saturated seconds | Saturation percentage |
|---|---|---|---|
| A | 5443 | 36 | 0.661400% |
| B | 5443 | 7 | 0.128606% |
| C | 5443 | 6 | 0.110233% |
| D | 5443 | 88 | 1.616755% |
Noise dominated data is calculated using 1-second bins in cleaned event files. If a bin has >2000 counts, and if more than 50% of those come from <1% of pixels, then it is considered to be noise-dominated and hence unusable.
| Quadrant | # 1 sec bins | Bins with >0 counts | Bins with >2000 counts | High rate bins dominated by noise | Noise dominated (total time) | Noise dominated (detector-on time) | Marked lightcurve |
|---|---|---|---|---|---|---|---|
| A | 7356 | 5444 | 19 | 19 | 0.26% | 0.35% | 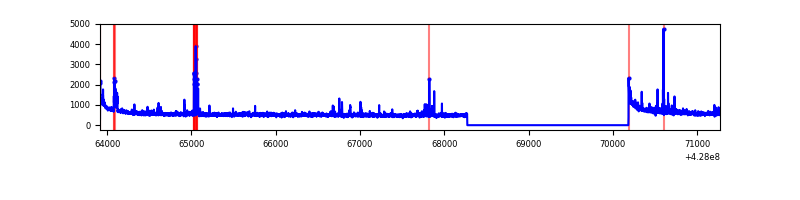 |
| B | 7356 | 5444 | 1 | 1 | 0.01% | 0.02% | 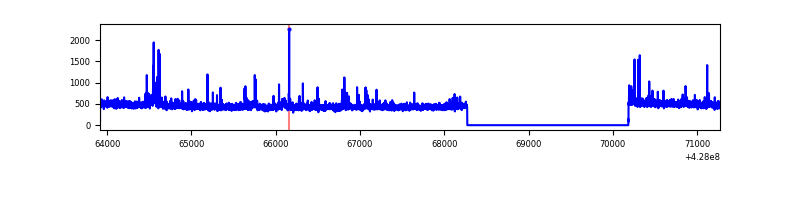 |
| C | 7356 | 5444 | 2 | 2 | 0.03% | 0.04% | 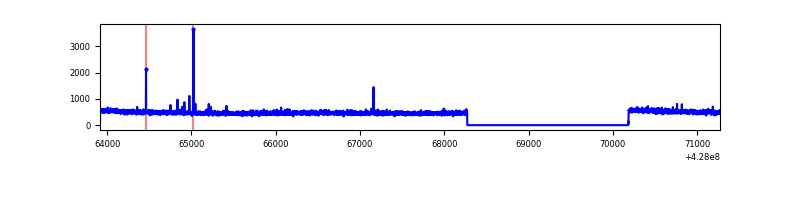 |
| D | 7356 | 5444 | 72 | 72 | 0.98% | 1.32% | 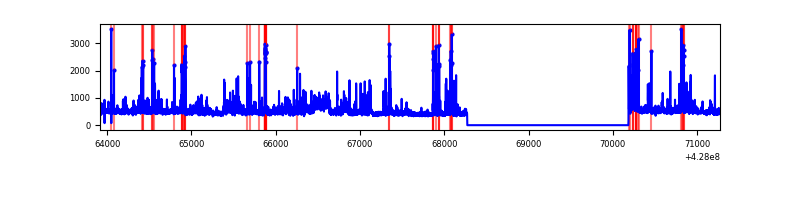 |
Top three noisy pixels from each quadrant. If the there are fewer than three noisy pixels in the level2.evt file, extra rows are filled as -1
| Pixel properties | Quadrant properties | ||||||
|---|---|---|---|---|---|---|---|
| Quadrant | DetID | PixID | Counts | Sigma | Mean | Median | Sigma |
| A | 10 | 83 | 589389 | 4634.05 | 625 | 612 | 127.1 |
| A | 13 | 248 | 99291 | 776.66 | 625 | 612 | 127.1 |
| A | 7 | 3 | 67997 | 530.36 | 625 | 612 | 127.1 |
| B | 0 | 245 | 34726 | 293.6 | 615 | 599 | 116.2 |
| B | 3 | 112 | 27453 | 231.03 | 615 | 599 | 116.2 |
| B | 15 | 35 | 24137 | 202.5 | 615 | 599 | 116.2 |
| C | 15 | 214 | 228960 | 1639.18 | 605 | 606 | 139.3 |
| C | 15 | 159 | 13902 | 95.44 | 605 | 606 | 139.3 |
| C | 12 | 249 | 13683 | 93.87 | 605 | 606 | 139.3 |
| D | 1 | 52 | 296331 | 2040.59 | 606 | 591 | 144.9 |
| D | 13 | 249 | 117807 | 808.78 | 606 | 591 | 144.9 |
| D | 2 | 249 | 84477 | 578.81 | 606 | 591 | 144.9 |
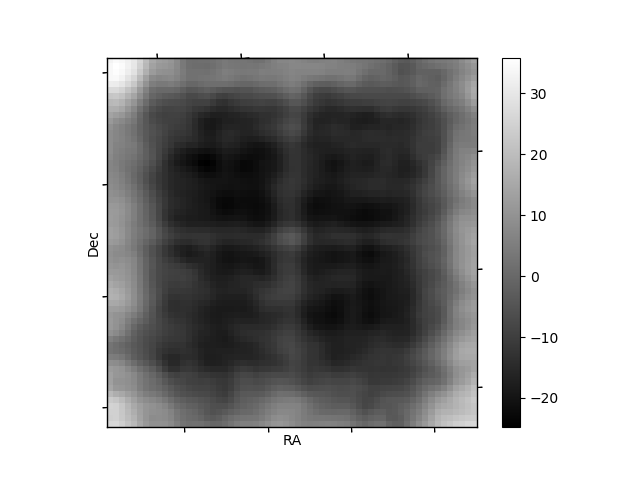
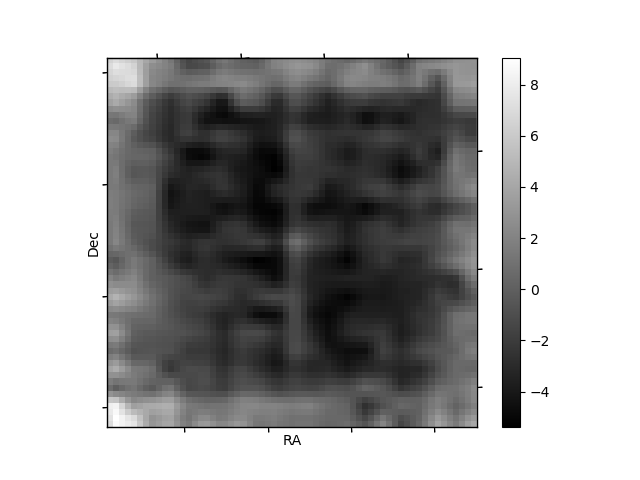
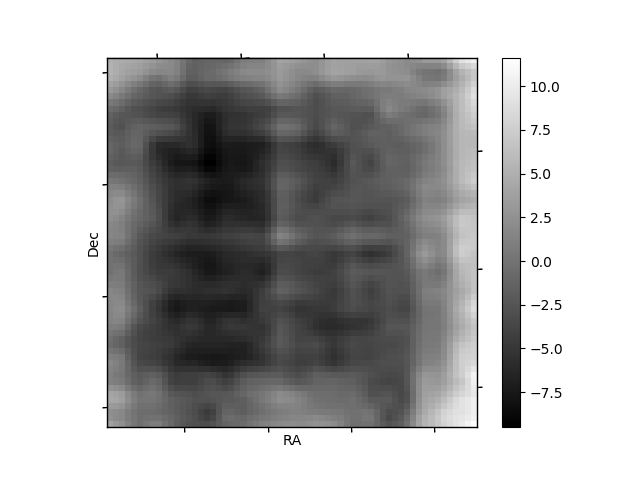
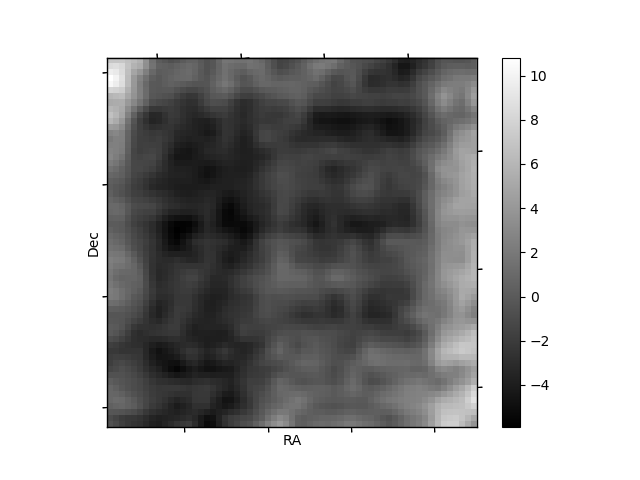
Histogram calculated using DETX and DETY for each event in the final _common_clean file
| Quadrant A | 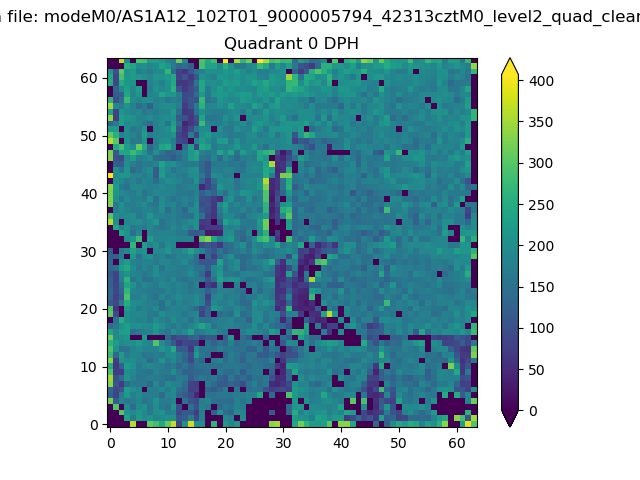 |
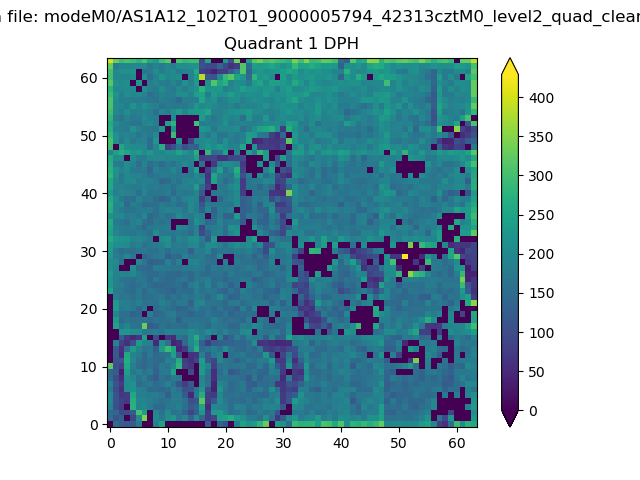 |
Quadrant B |
|---|---|---|---|
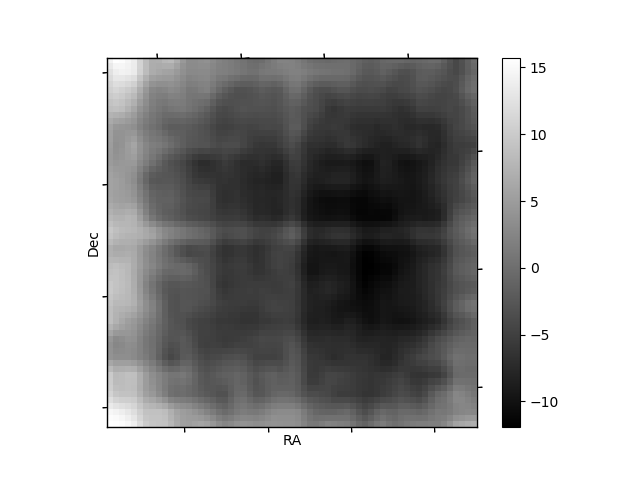
| Quadrant D | 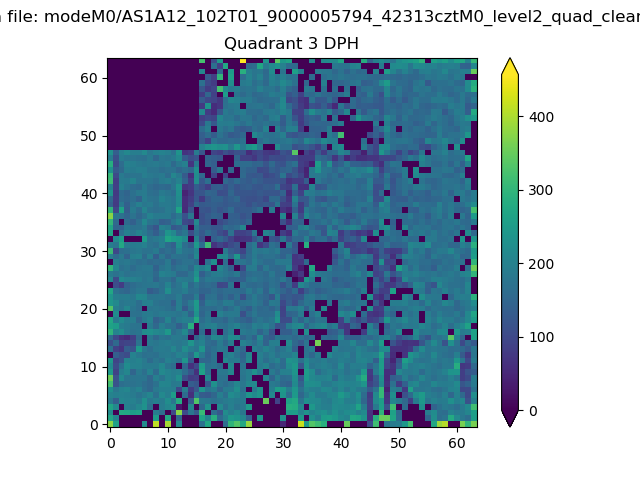 |
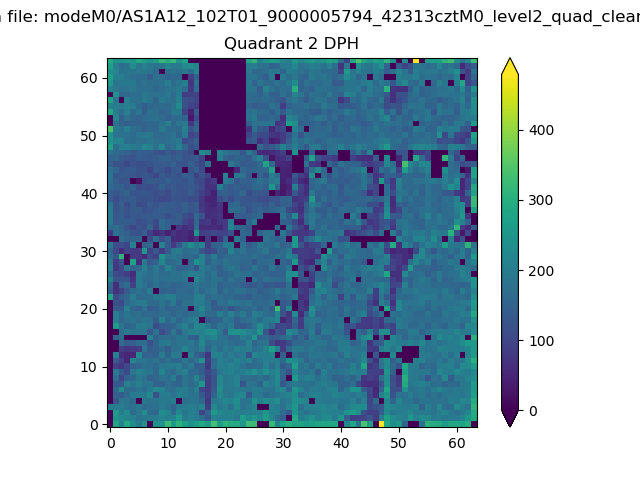 |
Quadrant C |
| Plot type | Count rate plots | Images |
|---|---|---|
| Comparison with Poisson distribution Blue bars denote a histogram of data divided into 1 sec bins. Red curve is a Poisson curve with rate = median count rate of data. |
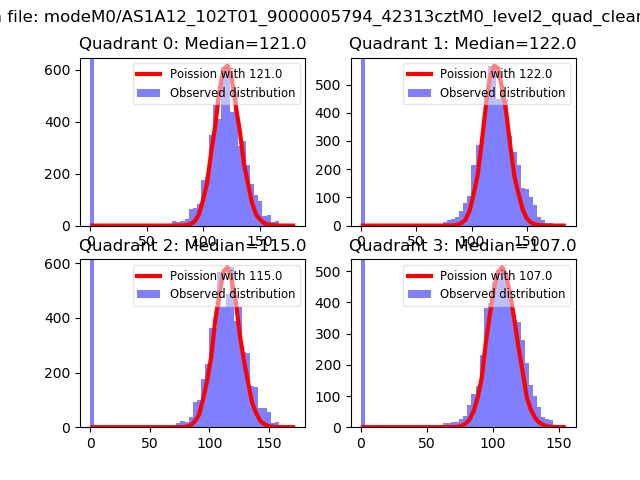 |
 |
| Quadrant-wise count rates Data is divided into 100 sec bins |
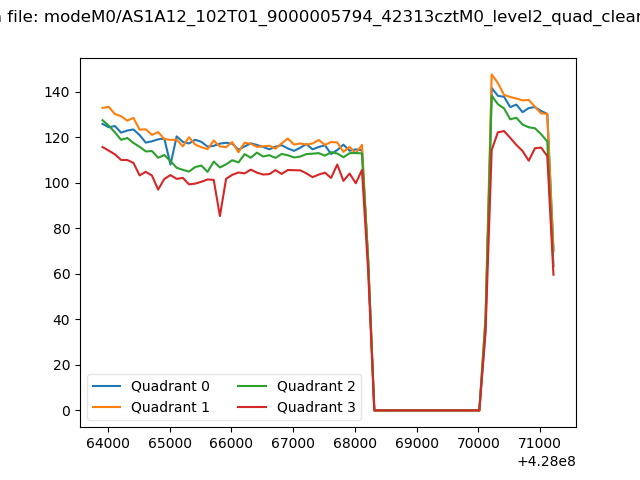 |
|
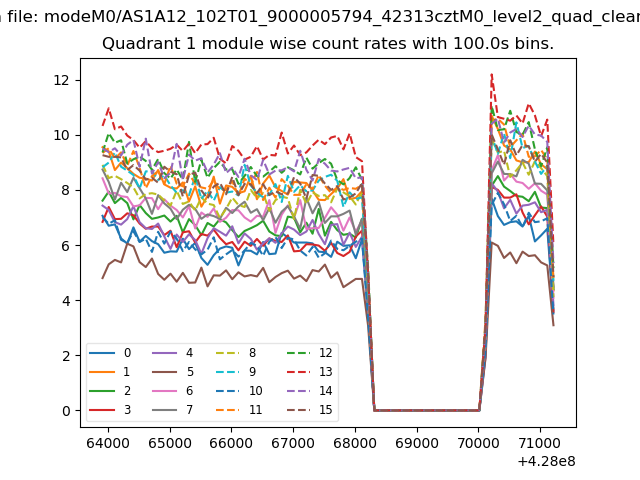
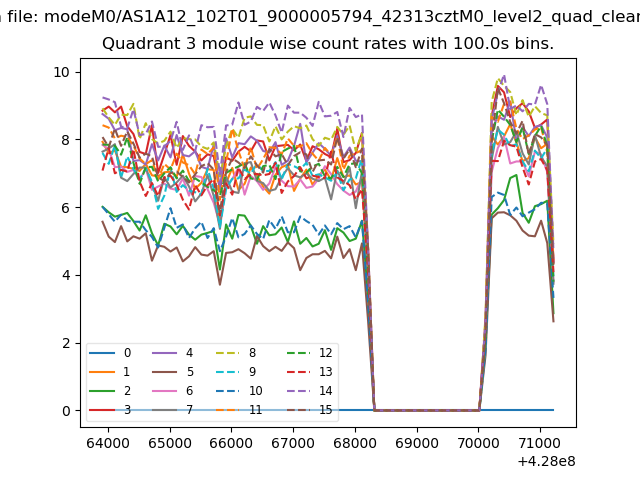
| Module-wise count rates for Quadrant A Data is divided into 100 sec bins |
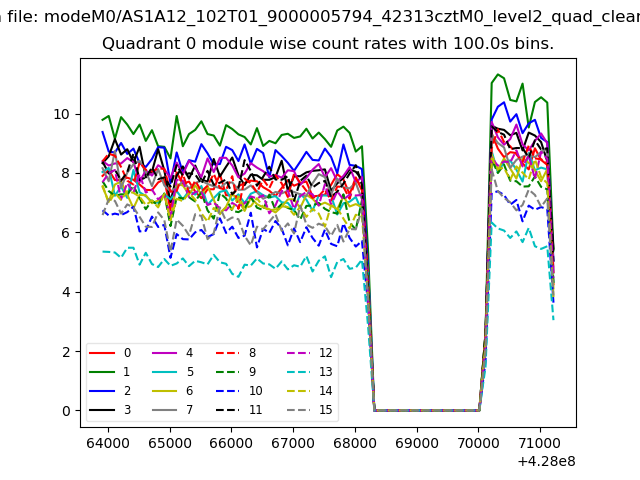 |
 |
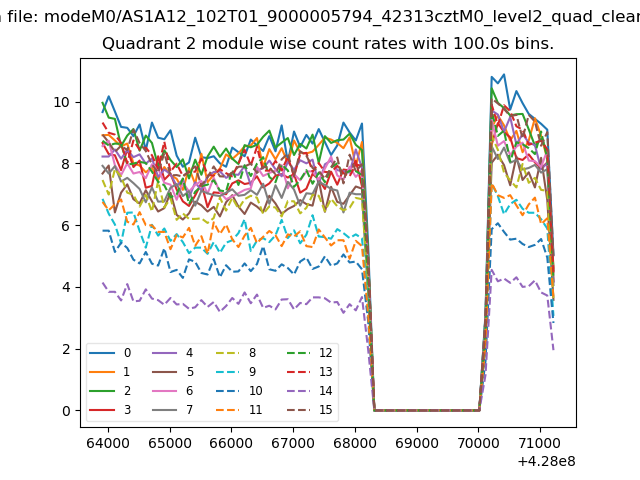
| Module-wise count rates for Quadrant B Data is divided into 100 sec bins |
 |
 |
| Module-wise count rates for Quadrant C Data is divided into 100 sec bins |
 |
 |
| Module-wise count rates for Quadrant D Data is divided into 100 sec bins |
 |
 |
| Parameter | Plot |
|---|---|
| CZT HV Monitor | 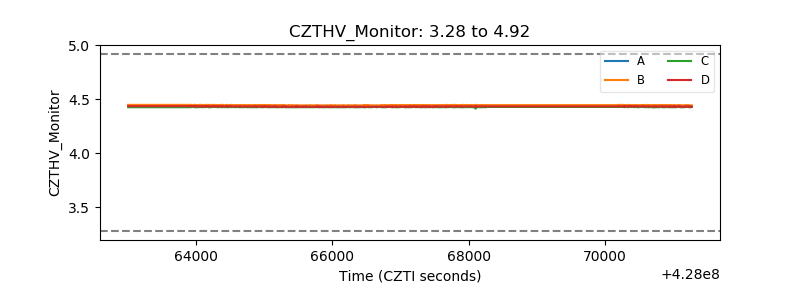 |
| D_VDD | 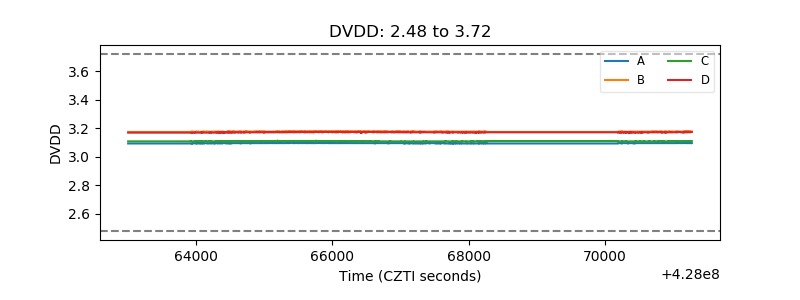 |
| Temperature 1 | 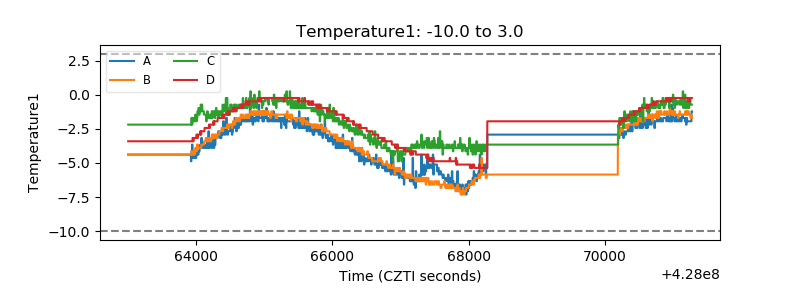 |
| Veto HV Monitor | 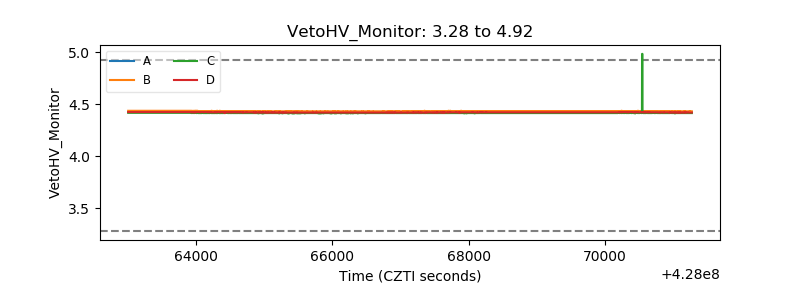 |
| Veto LLD |  |
| Alpha Counter | 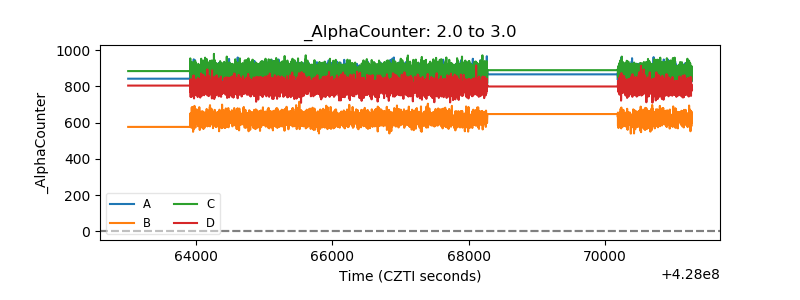 |
| _CPM_Rate | 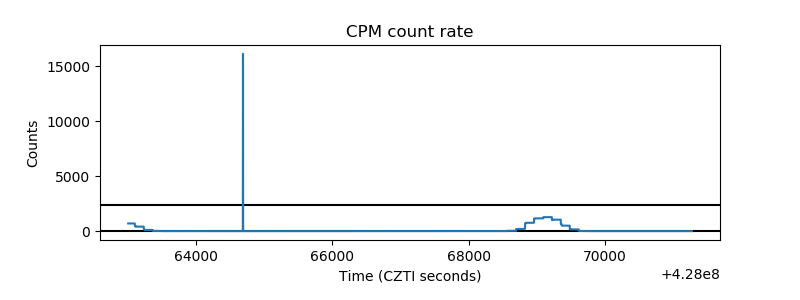 |
| CZT Counter | 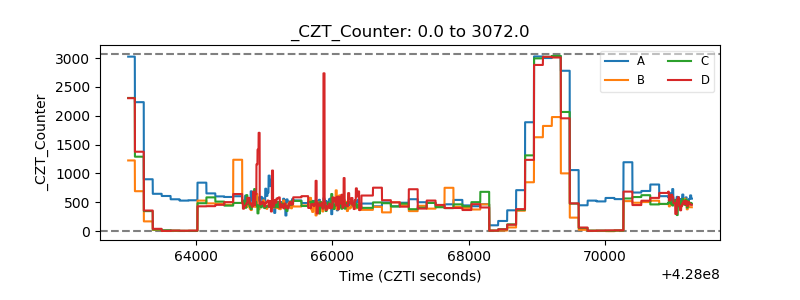 |
| +2.5 Volts monitor | 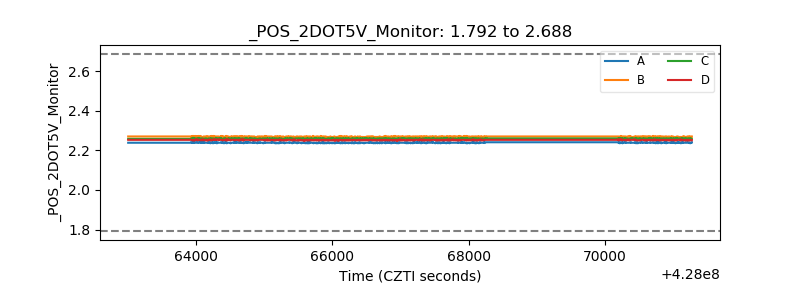 |
| +5 Volts monitor | 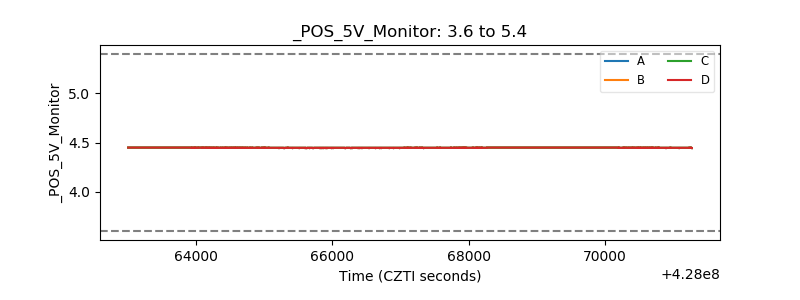 |
| _ROLL_ROT | 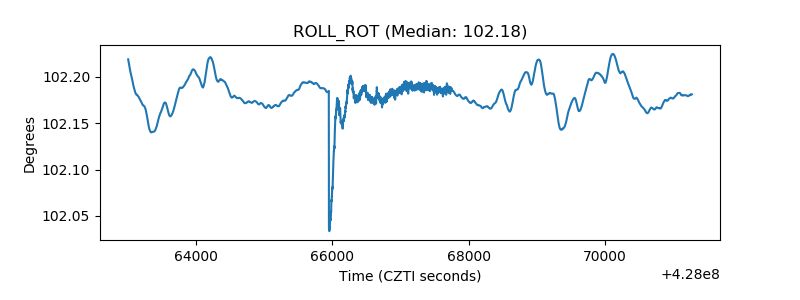 |
| _Roll_DEC | 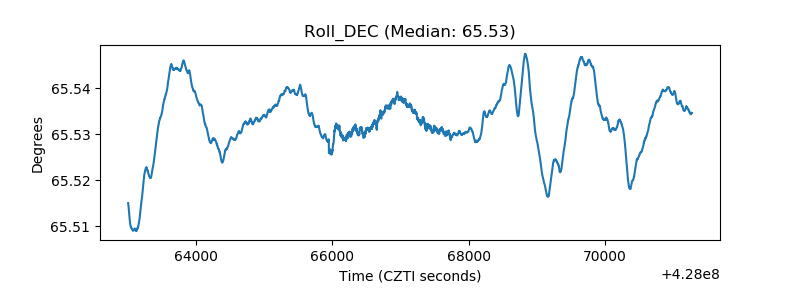 |
| _Roll_RA | 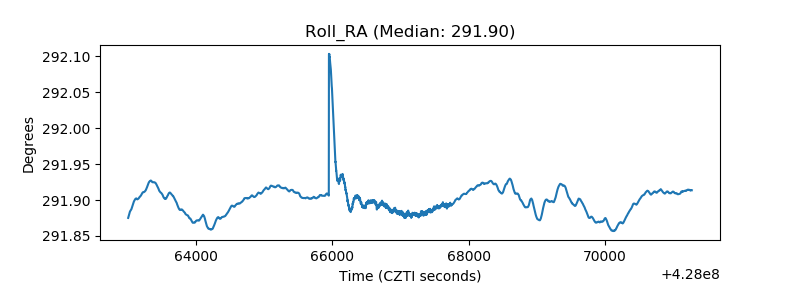 |
| Veto Counter | 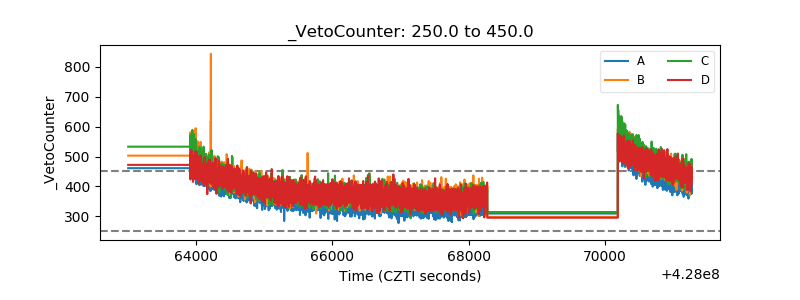 |