| Param | Original file | Final file |
|---|---|---|
| Filename | modeM0/AS1A12_102T01_9000005794_42314cztM0_level2.fits | modeM0/AS1A12_102T01_9000005794_42314cztM0_level2_quad_clean.evt |
| Size (bytes) | 319,155,840 | 95,368,320 |
| Size | 304.4 MB | 91.0 MB |
| Events in quadrant A | 3,063,237 | 656,332 |
| Events in quadrant B | 2,530,885 | 662,163 |
| Events in quadrant C | 2,581,442 | 630,533 |
| Events in quadrant D | 3,233,334 | 574,415 |
| Mode M9 | |||
|---|---|---|---|
| Quadrant | BADHDUFLAG | Total packets | Discarded packets |
| A | 0 | 29 | 0 |
| B | 0 | 29 | 0 |
| C | 0 | 30 | 0 |
| D | 0 | 30 | 0 |
| Mode SS | |||
|---|---|---|---|
| Quadrant | BADHDUFLAG | Total packets | Discarded packets |
| A | 0 | 108 | 0 |
| B | 0 | 108 | 0 |
| C | 0 | 108 | 0 |
| D | 0 | 108 | 0 |
| Mode M0 | |||
|---|---|---|---|
| Quadrant | BADHDUFLAG | Total packets | Discarded packets |
| A | 0 | 12333 | 2 |
| B | 0 | 10923 | 2 |
| C | 0 | 10709 | 2 |
| D | 0 | 13017 | 2 |
| Quadrant | Total seconds | Saturated seconds | Saturation percentage |
|---|---|---|---|
| A | 5198 | 26 | 0.500192% |
| B | 5198 | 18 | 0.346287% |
| C | 5198 | 7 | 0.134667% |
| D | 5198 | 156 | 3.001154% |
Noise dominated data is calculated using 1-second bins in cleaned event files. If a bin has >2000 counts, and if more than 50% of those come from <1% of pixels, then it is considered to be noise-dominated and hence unusable.
| Quadrant | # 1 sec bins | Bins with >0 counts | Bins with >2000 counts | High rate bins dominated by noise | Noise dominated (total time) | Noise dominated (detector-on time) | Marked lightcurve |
|---|---|---|---|---|---|---|---|
| A | 7231 | 5199 | 8 | 8 | 0.11% | 0.15% | 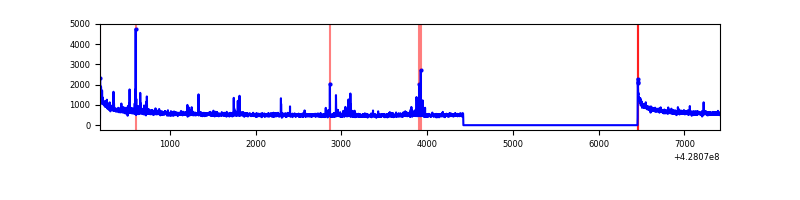 |
| B | 7231 | 5199 | 12 | 12 | 0.17% | 0.23% | 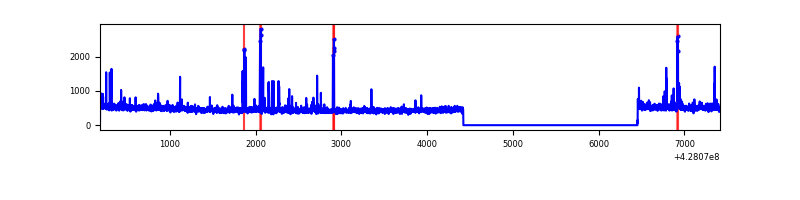 |
| C | 7231 | 5199 | 3 | 3 | 0.04% | 0.06% | 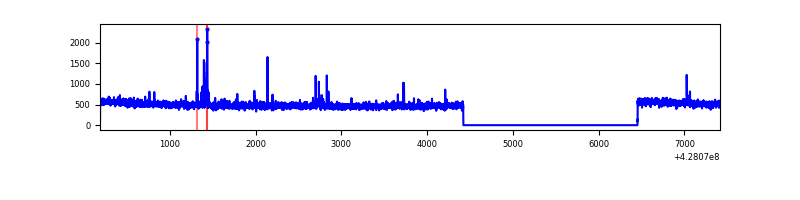 |
| D | 7231 | 5199 | 133 | 133 | 1.84% | 2.56% | 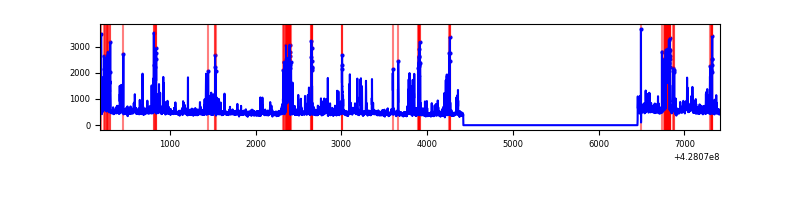 |
Top three noisy pixels from each quadrant. If the there are fewer than three noisy pixels in the level2.evt file, extra rows are filled as -1
| Pixel properties | Quadrant properties | ||||||
|---|---|---|---|---|---|---|---|
| Quadrant | DetID | PixID | Counts | Sigma | Mean | Median | Sigma |
| A | 10 | 83 | 580648 | 4715.48 | 609 | 599 | 123.0 |
| A | 7 | 3 | 65400 | 526.8 | 609 | 599 | 123.0 |
| A | 13 | 248 | 56114 | 451.31 | 609 | 599 | 123.0 |
| B | 15 | 35 | 52392 | 455.92 | 599 | 582 | 113.6 |
| B | 15 | 85 | 40045 | 347.27 | 599 | 582 | 113.6 |
| B | 5 | 255 | 35224 | 304.85 | 599 | 582 | 113.6 |
| C | 15 | 214 | 219180 | 1610.01 | 593 | 598 | 135.8 |
| C | 15 | 111 | 26946 | 194.07 | 593 | 598 | 135.8 |
| C | 12 | 249 | 16590 | 117.79 | 593 | 598 | 135.8 |
| D | 1 | 52 | 253193 | 1772.68 | 589 | 572 | 142.5 |
| D | 12 | 233 | 178452 | 1248.21 | 589 | 572 | 142.5 |
| D | 13 | 249 | 103154 | 719.83 | 589 | 572 | 142.5 |
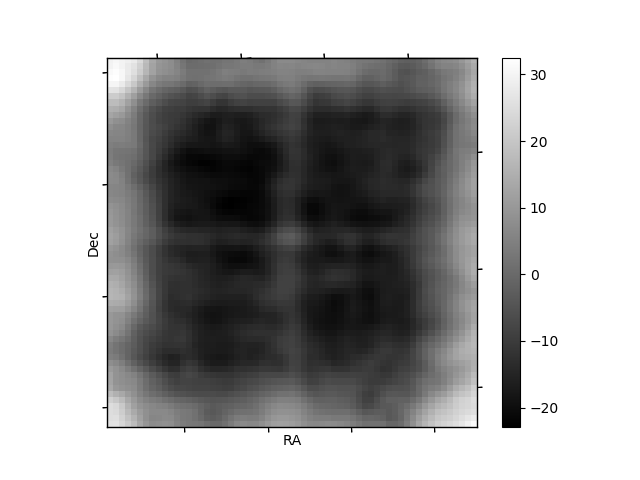
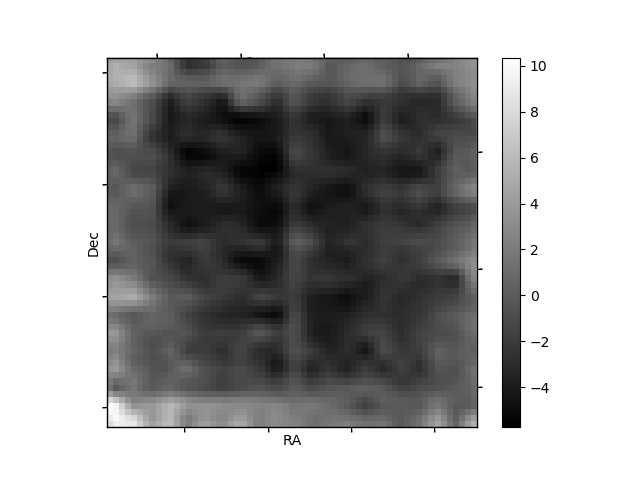
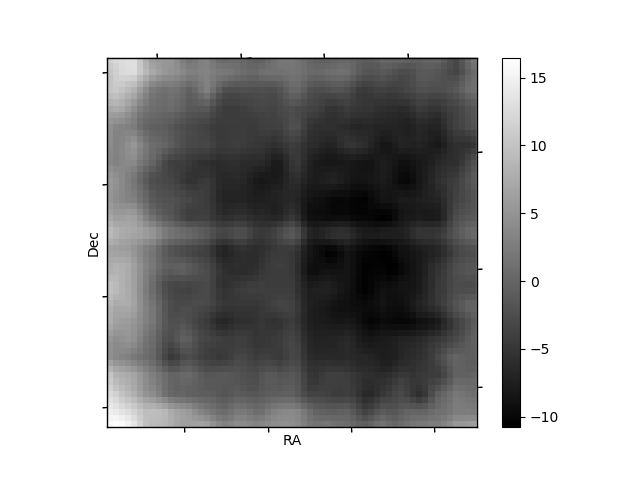
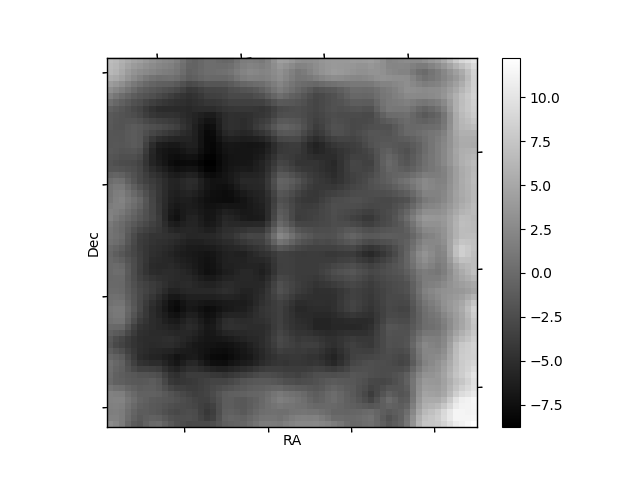
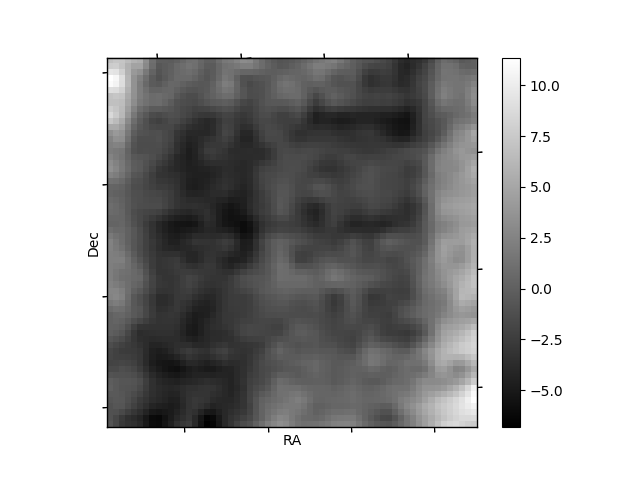
Histogram calculated using DETX and DETY for each event in the final _common_clean file
| Quadrant A | 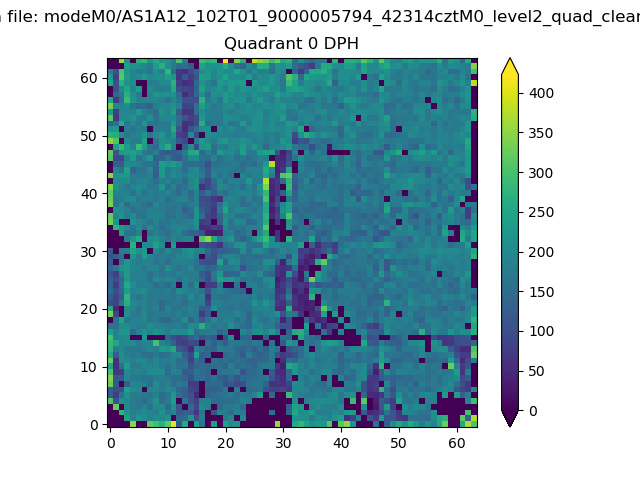 |
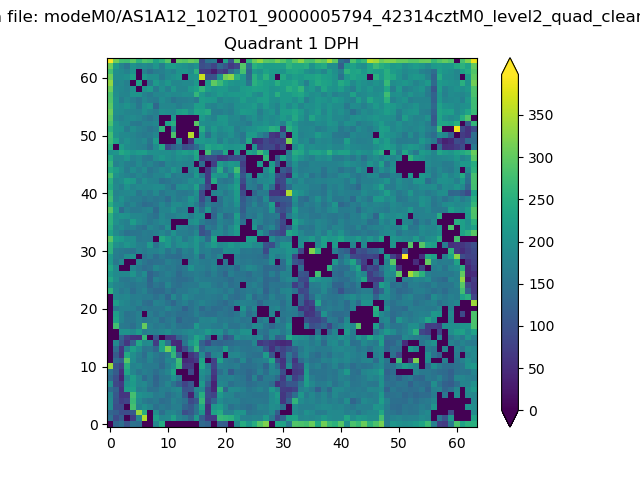 |
Quadrant B |
|---|---|---|---|
| Quadrant D | 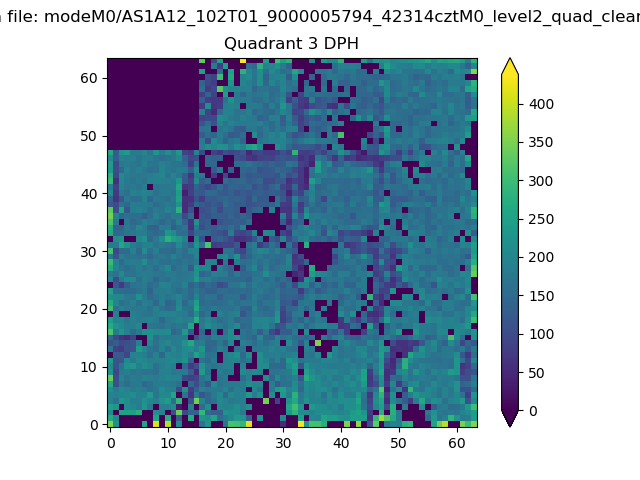 |
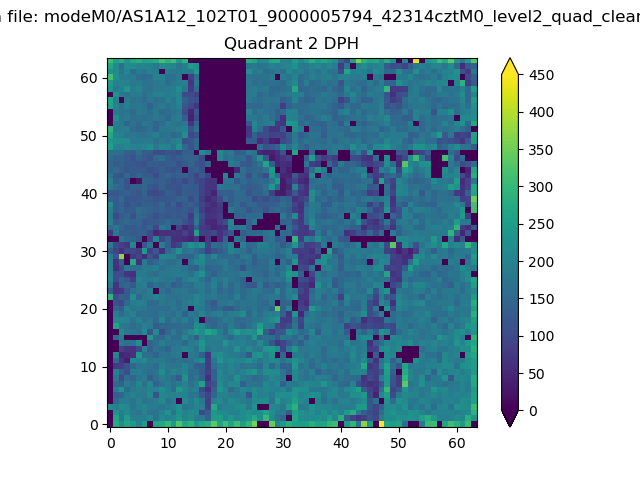 |
Quadrant C |
| Plot type | Count rate plots | Images |
|---|---|---|
| Comparison with Poisson distribution Blue bars denote a histogram of data divided into 1 sec bins. Red curve is a Poisson curve with rate = median count rate of data. |
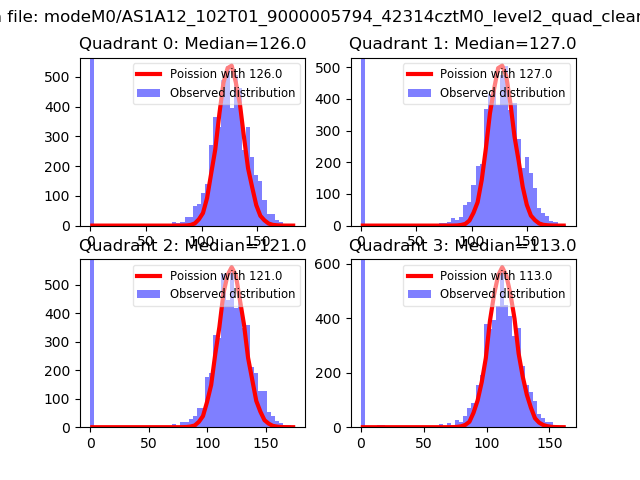 |
 |
| Quadrant-wise count rates Data is divided into 100 sec bins |
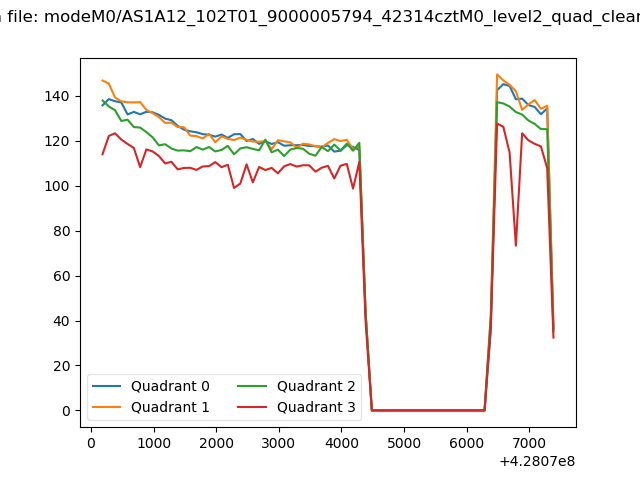 |
|
| Module-wise count rates for Quadrant A Data is divided into 100 sec bins |
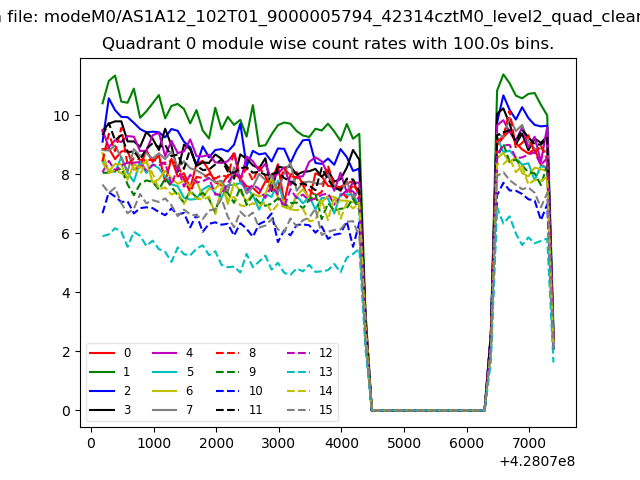 |
 |
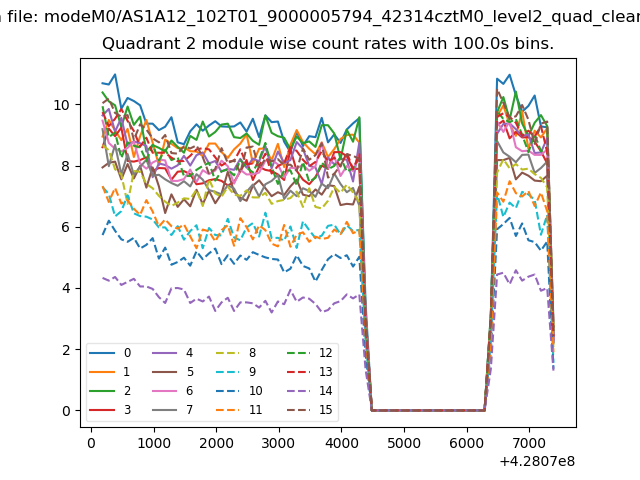
| Module-wise count rates for Quadrant B Data is divided into 100 sec bins |
 |
 |
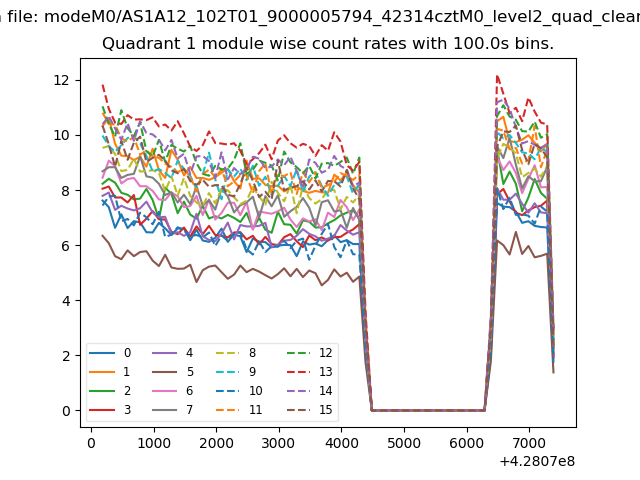
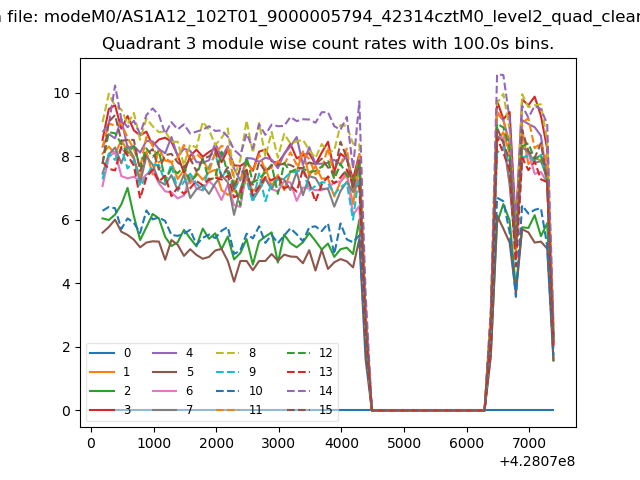
| Module-wise count rates for Quadrant C Data is divided into 100 sec bins |
 |
 |
| Module-wise count rates for Quadrant D Data is divided into 100 sec bins |
 |
 |
| Parameter | Plot |
|---|---|
| CZT HV Monitor | 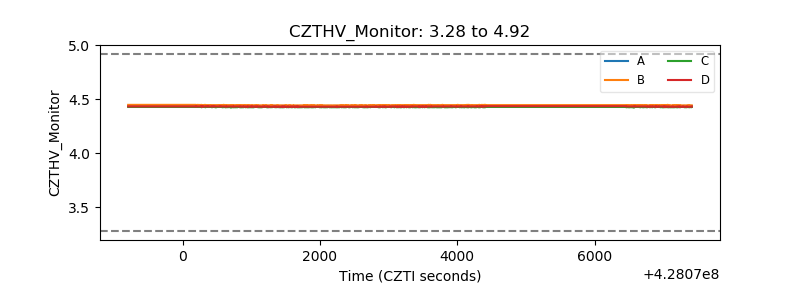 |
| D_VDD | 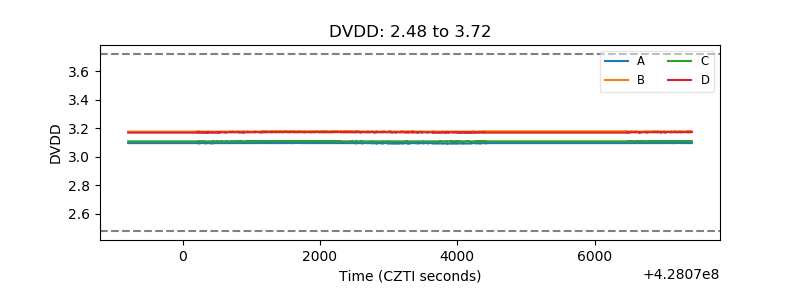 |
| Temperature 1 | 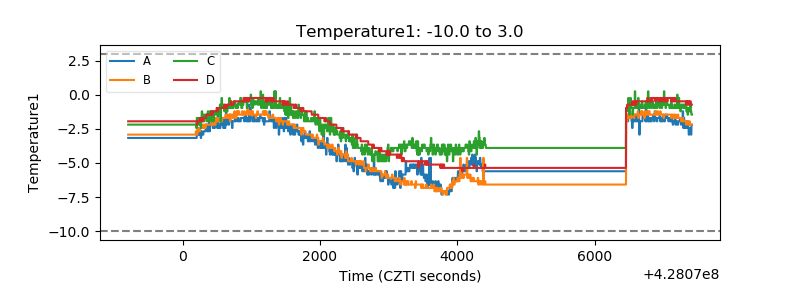 |
| Veto HV Monitor | 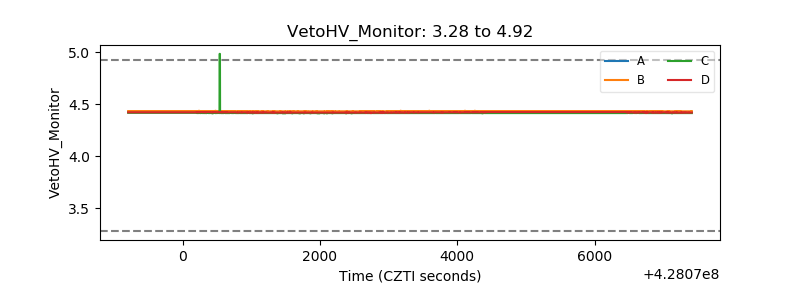 |
| Veto LLD | 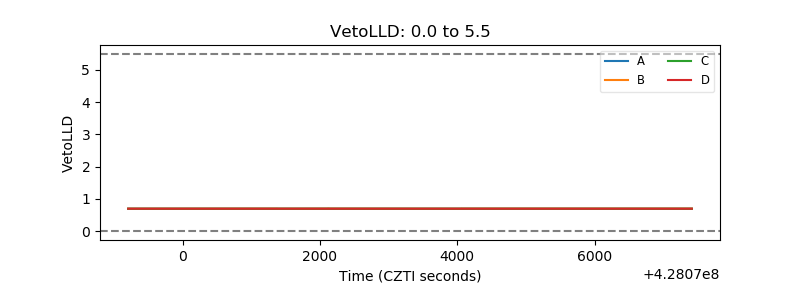 |
| Alpha Counter | 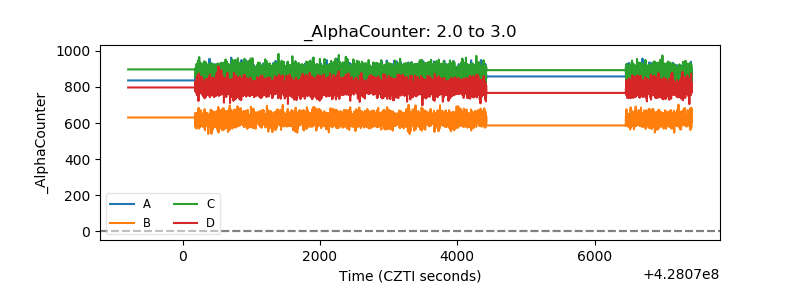 |
| _CPM_Rate | 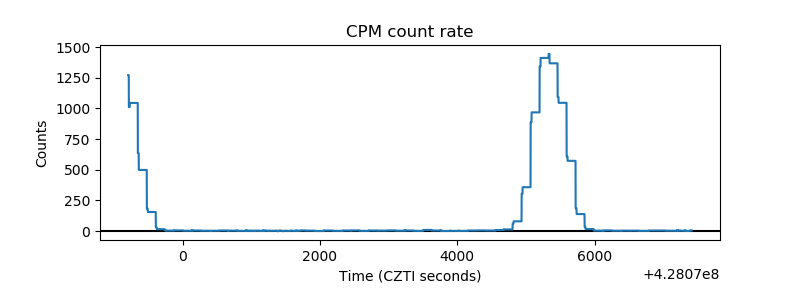 |
| CZT Counter | 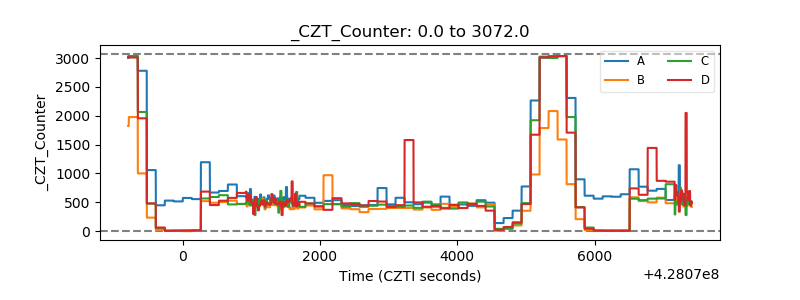 |
| +2.5 Volts monitor | 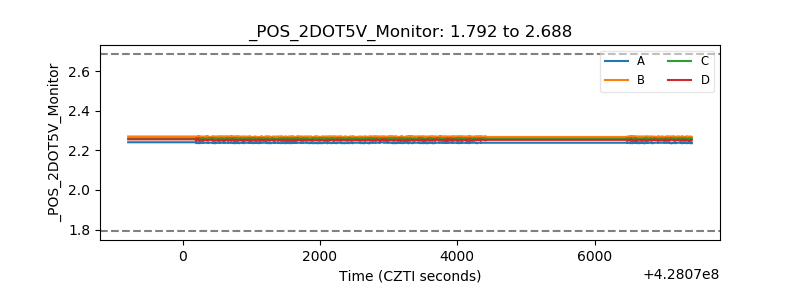 |
| +5 Volts monitor | 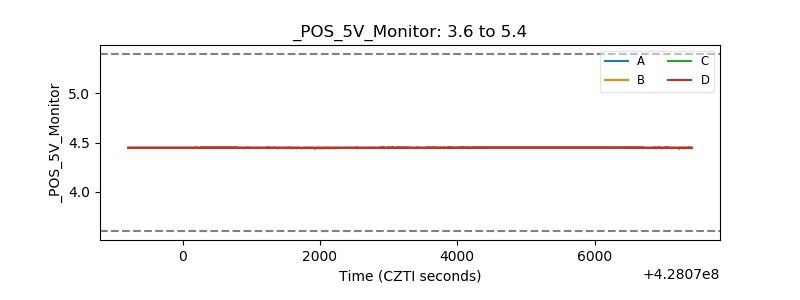 |
| _ROLL_ROT | 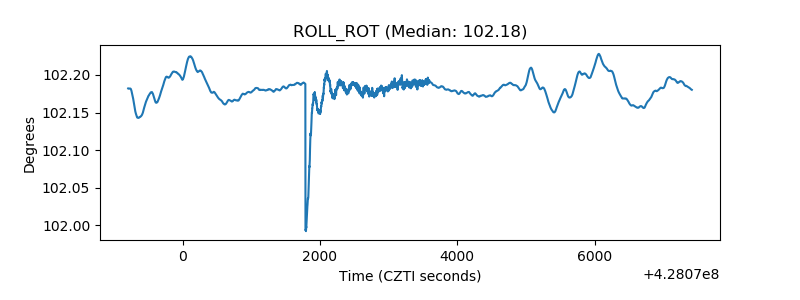 |
| _Roll_DEC | 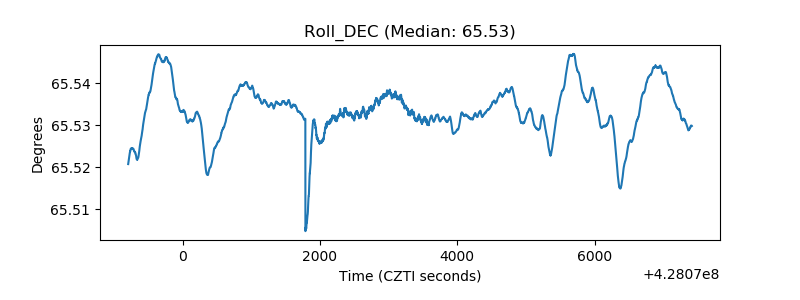 |
| _Roll_RA | 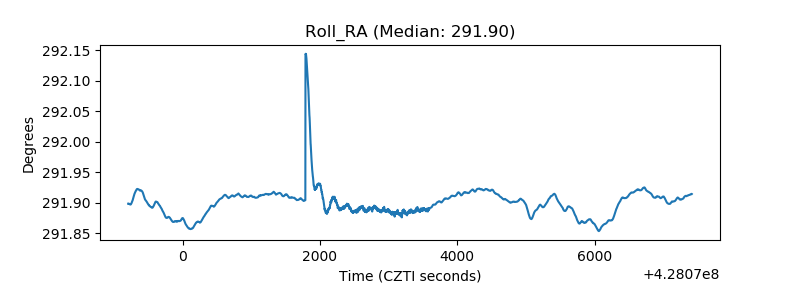 |
| Veto Counter | 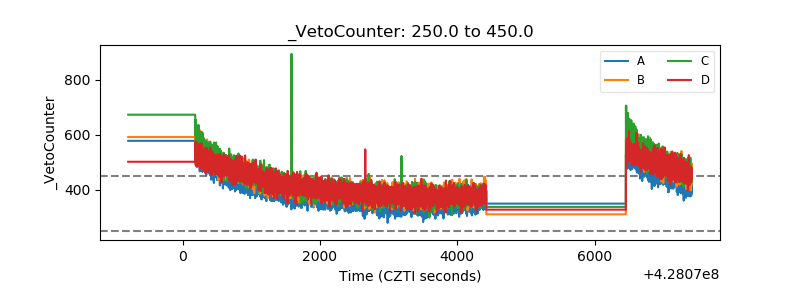 |