| Param | Original file | Final file |
|---|---|---|
| Filename | modeM0/AS1A12_102T01_9000005794_42315cztM0_level2.fits | modeM0/AS1A12_102T01_9000005794_42315cztM0_level2_quad_clean.evt |
| Size (bytes) | 308,808,000 | 93,677,760 |
| Size | 294.5 MB | 89.3 MB |
| Events in quadrant A | 2,957,261 | 642,922 |
| Events in quadrant B | 2,506,912 | 646,884 |
| Events in quadrant C | 2,494,560 | 622,001 |
| Events in quadrant D | 3,076,036 | 568,881 |
| Mode M9 | |||
|---|---|---|---|
| Quadrant | BADHDUFLAG | Total packets | Discarded packets |
| A | 0 | 23 | 0 |
| B | 0 | 23 | 0 |
| C | 0 | 24 | 0 |
| D | 0 | 24 | 0 |
| Mode SS | |||
|---|---|---|---|
| Quadrant | BADHDUFLAG | Total packets | Discarded packets |
| A | 0 | 102 | 0 |
| B | 0 | 102 | 0 |
| C | 0 | 102 | 0 |
| D | 0 | 102 | 0 |
| Mode M0 | |||
|---|---|---|---|
| Quadrant | BADHDUFLAG | Total packets | Discarded packets |
| A | 0 | 11900 | 2 |
| B | 0 | 10783 | 2 |
| C | 0 | 10364 | 2 |
| D | 0 | 12522 | 2 |
| Quadrant | Total seconds | Saturated seconds | Saturation percentage |
|---|---|---|---|
| A | 5085 | 19 | 0.373648% |
| B | 5085 | 35 | 0.688299% |
| C | 5084 | 6 | 0.118017% |
| D | 5084 | 119 | 2.340677% |
Noise dominated data is calculated using 1-second bins in cleaned event files. If a bin has >2000 counts, and if more than 50% of those come from <1% of pixels, then it is considered to be noise-dominated and hence unusable.
| Quadrant | # 1 sec bins | Bins with >0 counts | Bins with >2000 counts | High rate bins dominated by noise | Noise dominated (total time) | Noise dominated (detector-on time) | Marked lightcurve |
|---|---|---|---|---|---|---|---|
| A | 7208 | 5086 | 10 | 10 | 0.14% | 0.20% | 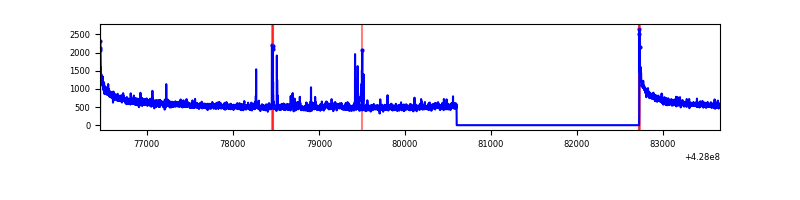 |
| B | 7208 | 5086 | 21 | 21 | 0.29% | 0.41% | 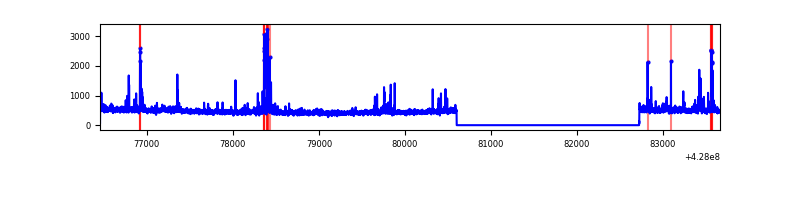 |
| C | 7207 | 5085 | 1 | 1 | 0.01% | 0.02% | 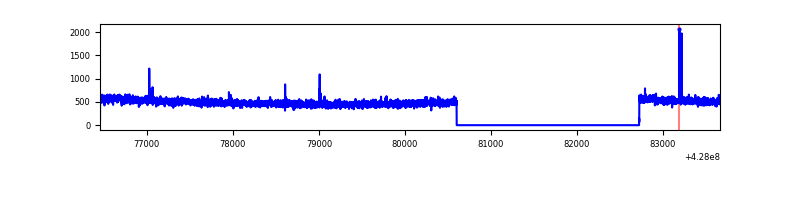 |
| D | 7207 | 5085 | 102 | 102 | 1.42% | 2.01% | 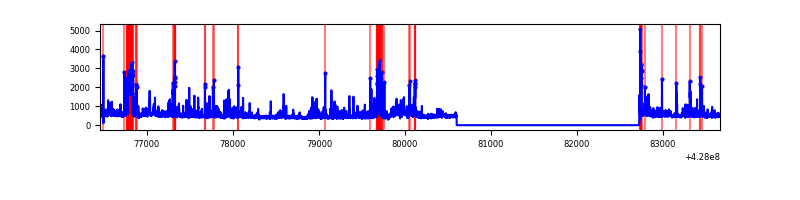 |
Top three noisy pixels from each quadrant. If the there are fewer than three noisy pixels in the level2.evt file, extra rows are filled as -1
| Pixel properties | Quadrant properties | ||||||
|---|---|---|---|---|---|---|---|
| Quadrant | DetID | PixID | Counts | Sigma | Mean | Median | Sigma |
| A | 10 | 83 | 577863 | 4827.49 | 588 | 578 | 119.6 |
| A | 7 | 3 | 56117 | 464.44 | 588 | 578 | 119.6 |
| A | 13 | 248 | 38305 | 315.49 | 588 | 578 | 119.6 |
| B | 0 | 245 | 81497 | 742.75 | 581 | 566 | 109.0 |
| B | 15 | 35 | 52479 | 476.44 | 581 | 566 | 109.0 |
| B | 3 | 112 | 34019 | 307.02 | 581 | 566 | 109.0 |
| C | 15 | 214 | 212006 | 1593.2 | 579 | 583 | 132.7 |
| C | 12 | 249 | 13239 | 95.37 | 579 | 583 | 132.7 |
| C | 15 | 111 | 4758 | 31.46 | 579 | 583 | 132.7 |
| D | 1 | 52 | 318202 | 2297.87 | 576 | 560 | 138.2 |
| D | 12 | 233 | 187189 | 1350.1 | 576 | 560 | 138.2 |
| D | 13 | 249 | 84477 | 607.07 | 576 | 560 | 138.2 |
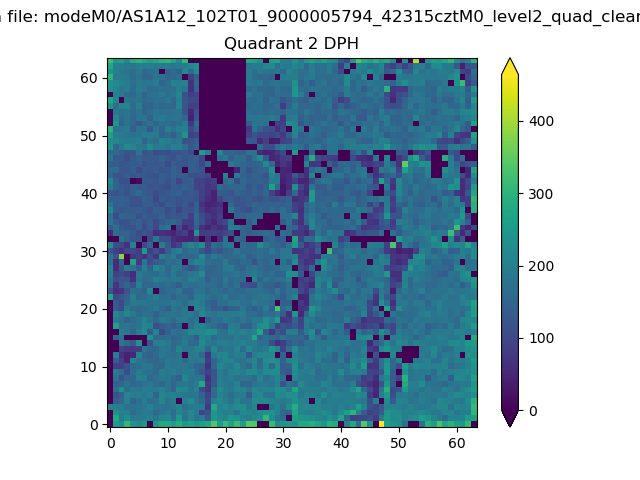
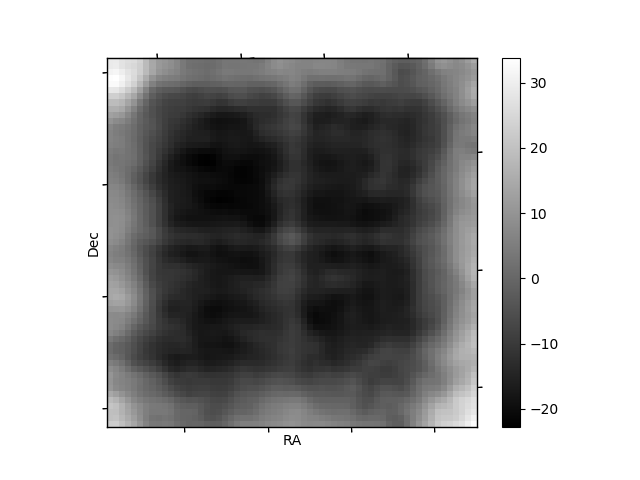
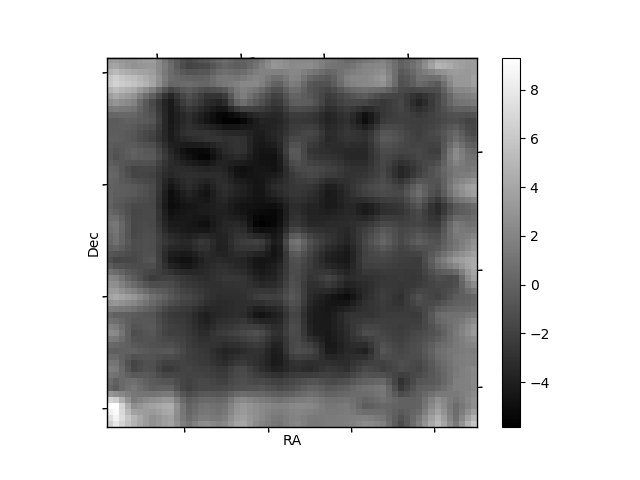
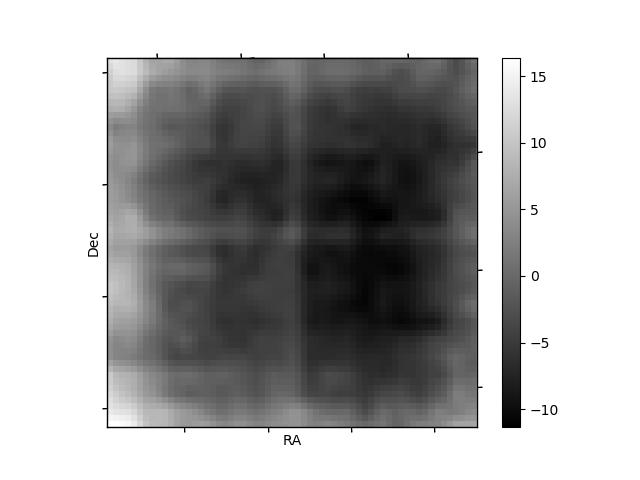
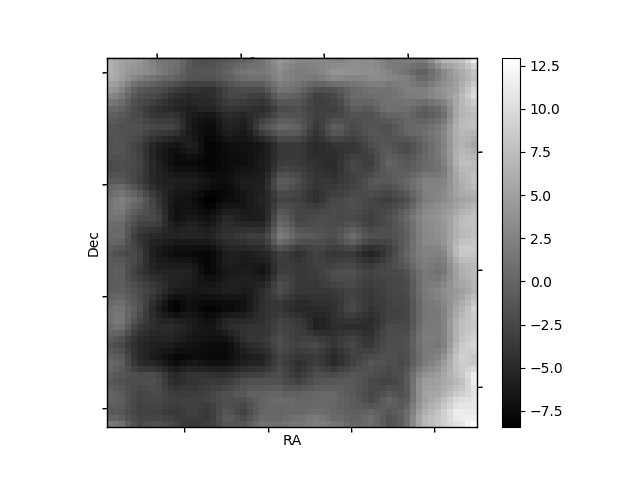
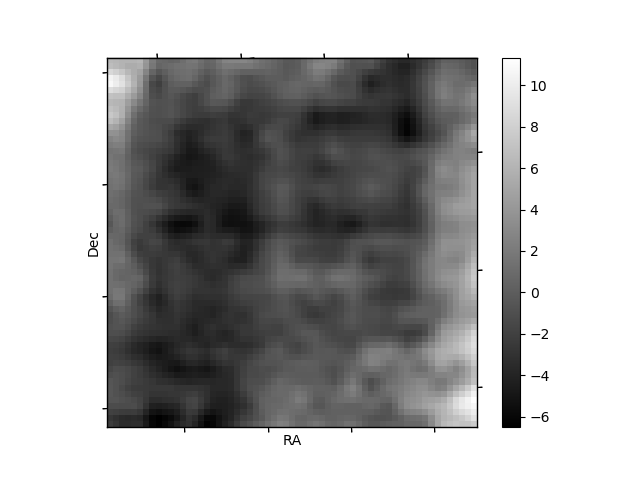
Histogram calculated using DETX and DETY for each event in the final _common_clean file
| Quadrant A | 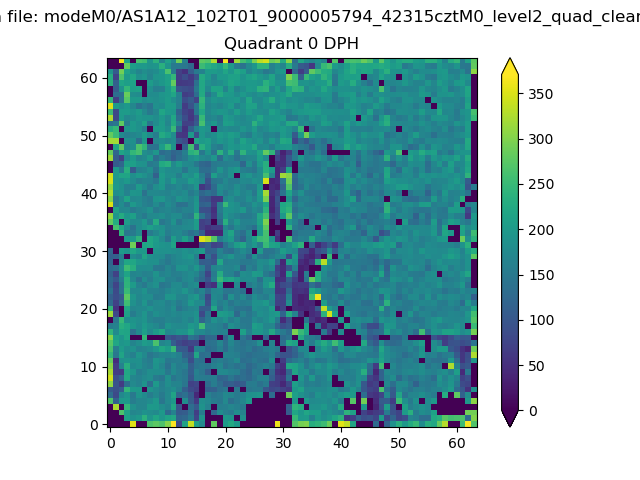 |
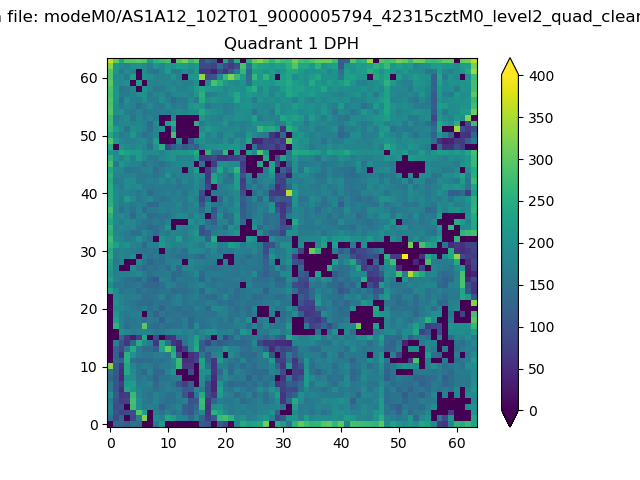 |
Quadrant B |
|---|---|---|---|
| Quadrant D | 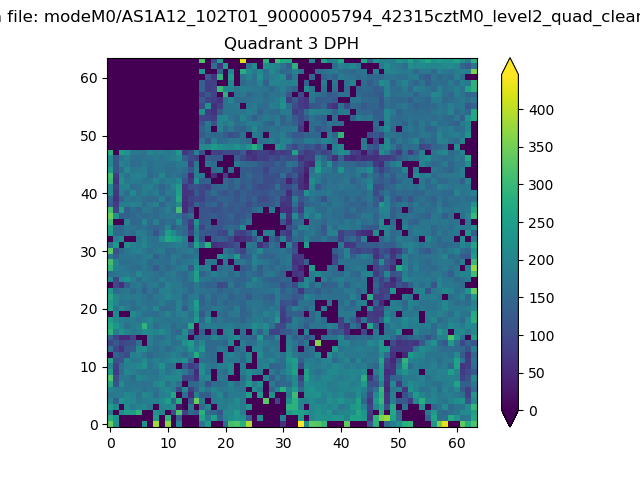 |
 |
Quadrant C |
| Plot type | Count rate plots | Images |
|---|---|---|
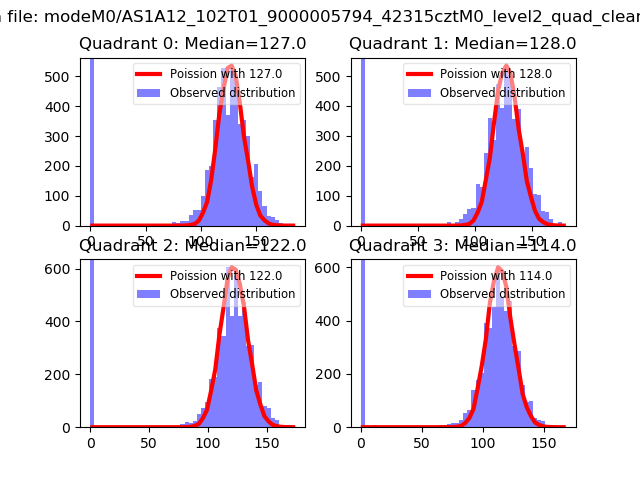
| Comparison with Poisson distribution Blue bars denote a histogram of data divided into 1 sec bins. Red curve is a Poisson curve with rate = median count rate of data. |
 |
 |
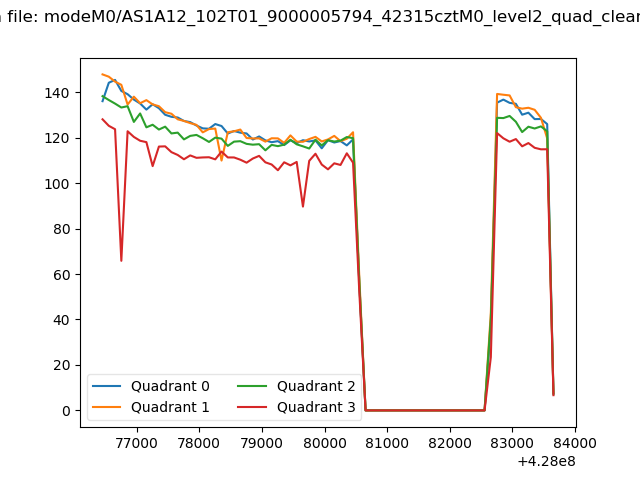
| Quadrant-wise count rates Data is divided into 100 sec bins |
 |
|
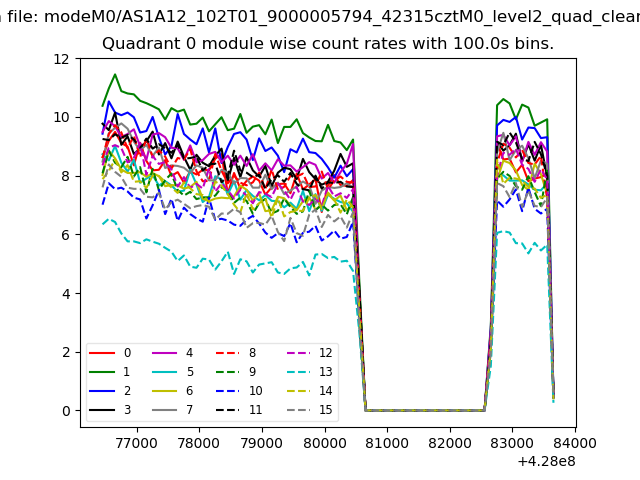
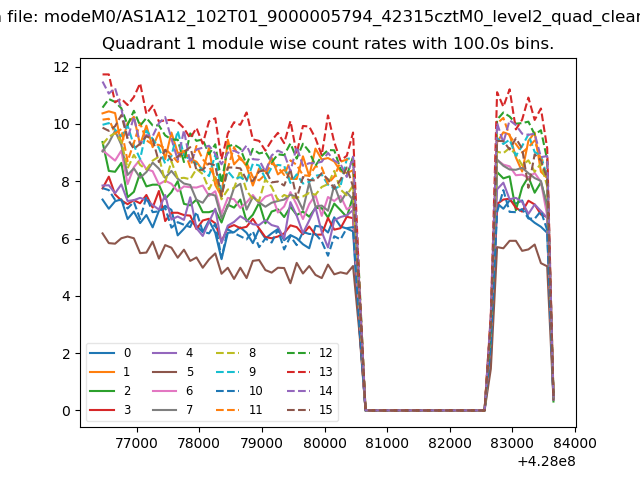
| Module-wise count rates for Quadrant A Data is divided into 100 sec bins |
 |
 |
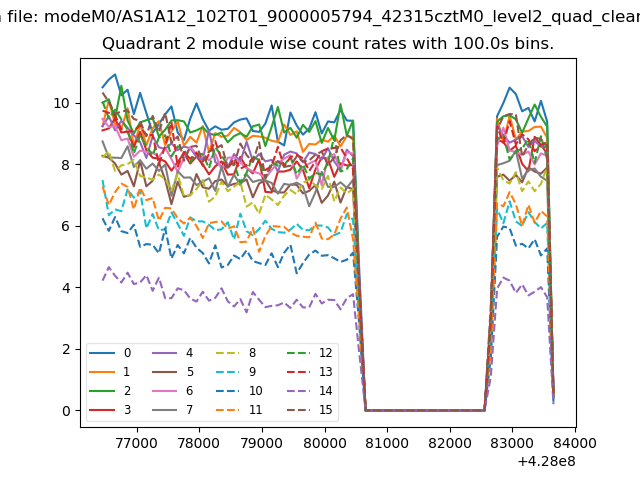
| Module-wise count rates for Quadrant B Data is divided into 100 sec bins |
 |
 |
| Module-wise count rates for Quadrant C Data is divided into 100 sec bins |
 |
 |
| Module-wise count rates for Quadrant D Data is divided into 100 sec bins |
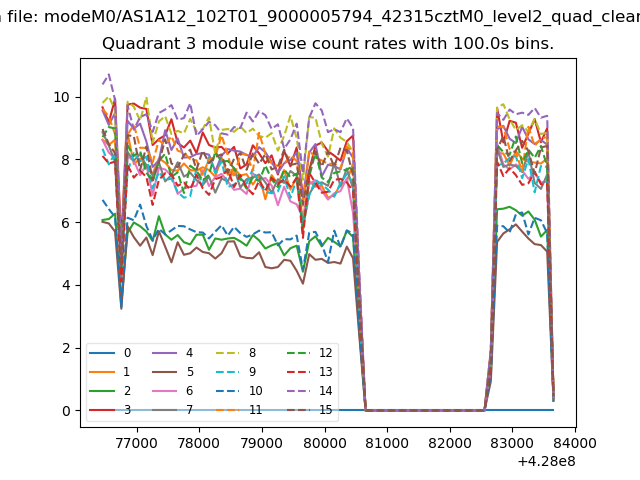 |
 |
| Parameter | Plot |
|---|---|
| CZT HV Monitor | 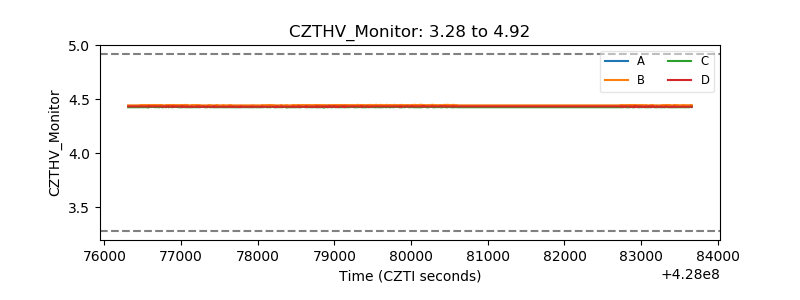 |
| D_VDD | 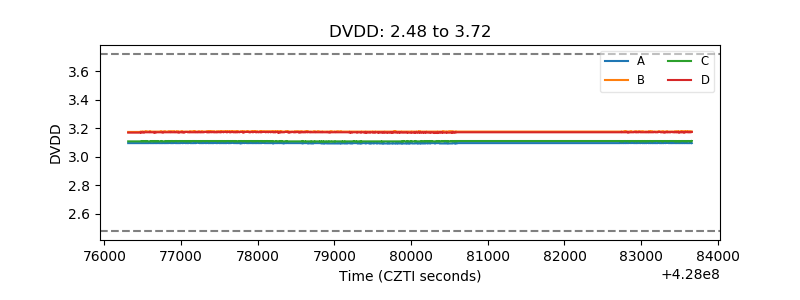 |
| Temperature 1 | 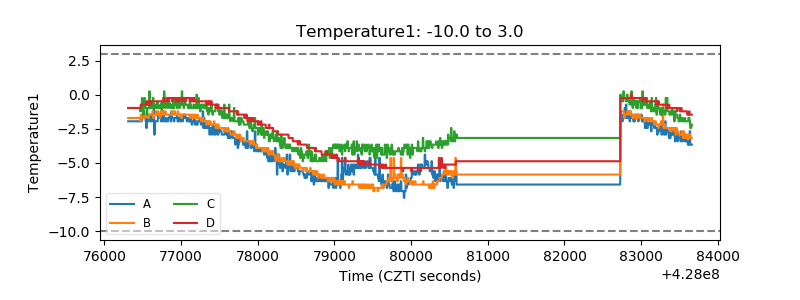 |
| Veto HV Monitor | 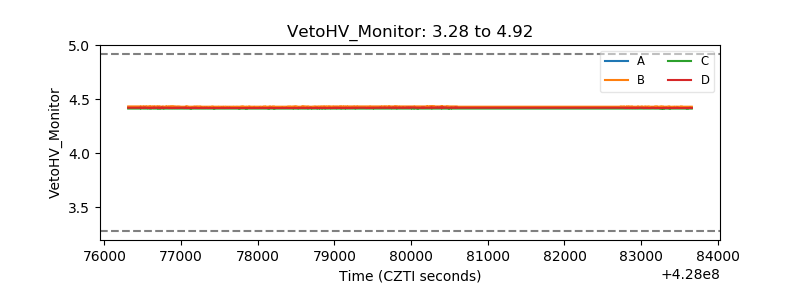 |
| Veto LLD | 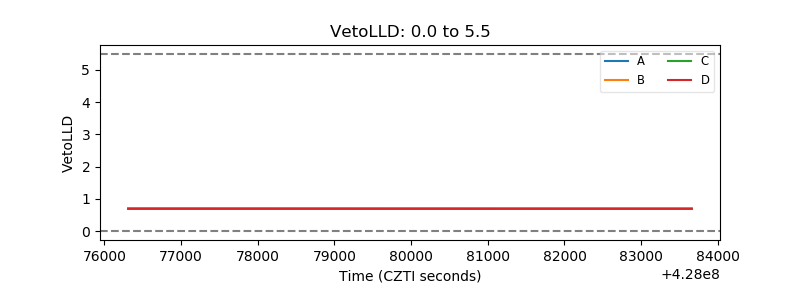 |
| Alpha Counter | 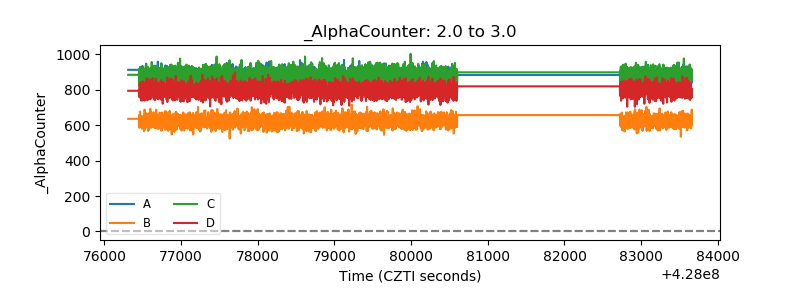 |
| _CPM_Rate | 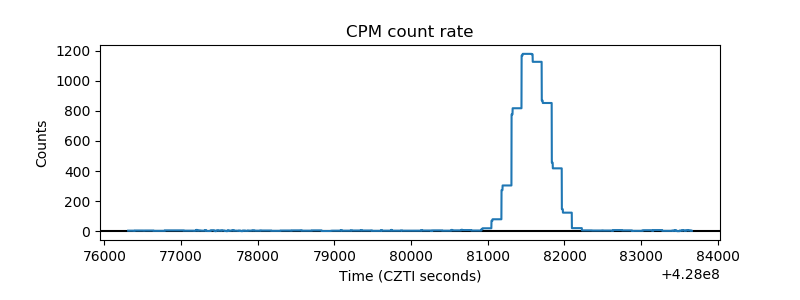 |
| CZT Counter | 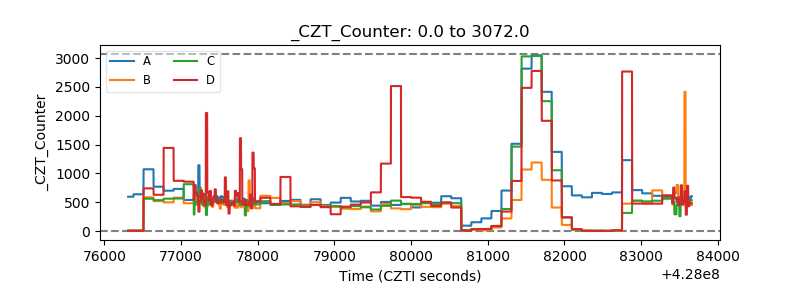 |
| +2.5 Volts monitor |  |
| +5 Volts monitor |  |
| _ROLL_ROT | 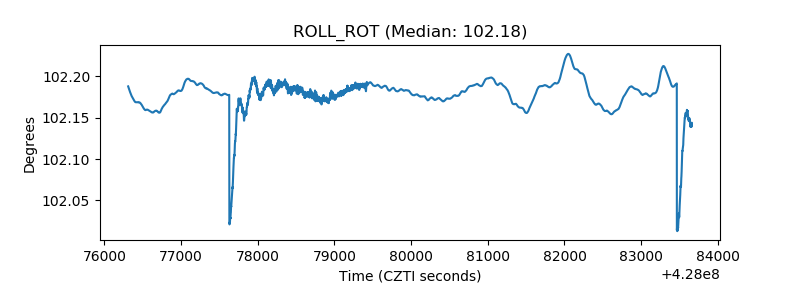 |
| _Roll_DEC | 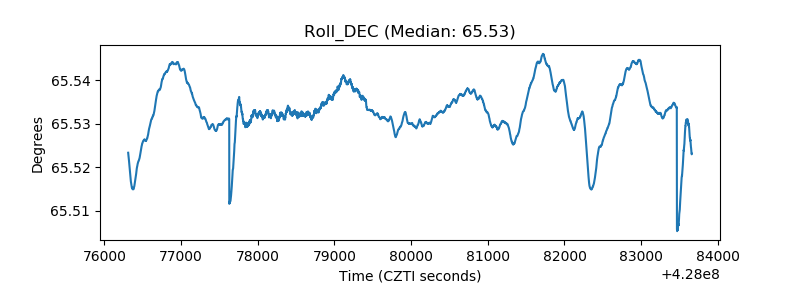 |
| _Roll_RA | 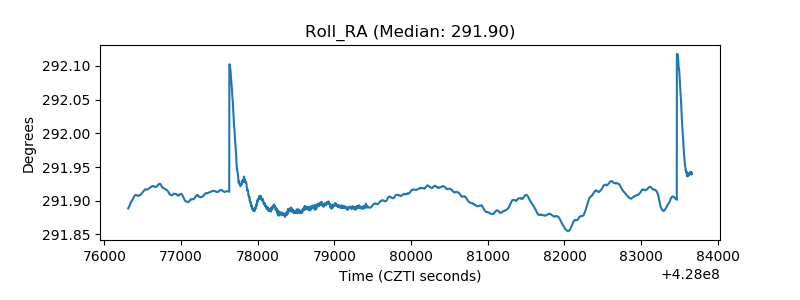 |
| Veto Counter | 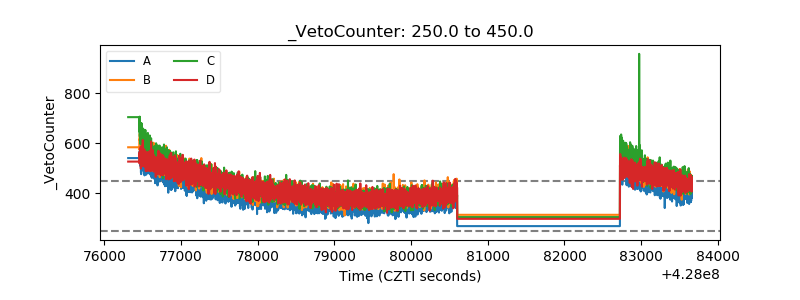 |