| Param | Original file | Final file |
|---|---|---|
| Filename | modeM0/AS1A12_102T01_9000005794_42316cztM0_level2.fits | modeM0/AS1A12_102T01_9000005794_42316cztM0_level2_quad_clean.evt |
| Size (bytes) | 286,715,520 | 87,410,880 |
| Size | 273.4 MB | 83.4 MB |
| Events in quadrant A | 2,726,093 | 591,663 |
| Events in quadrant B | 2,374,047 | 596,817 |
| Events in quadrant C | 2,352,290 | 582,387 |
| Events in quadrant D | 2,778,777 | 532,533 |
| Mode M9 | |||
|---|---|---|---|
| Quadrant | BADHDUFLAG | Total packets | Discarded packets |
| A | 0 | 23 | 0 |
| B | 0 | 23 | 0 |
| C | 0 | 24 | 0 |
| D | 0 | 24 | 0 |
| Mode SS | |||
|---|---|---|---|
| Quadrant | BADHDUFLAG | Total packets | Discarded packets |
| A | 0 | 100 | 0 |
| B | 0 | 100 | 0 |
| C | 0 | 100 | 0 |
| D | 0 | 100 | 0 |
| Mode M0 | |||
|---|---|---|---|
| Quadrant | BADHDUFLAG | Total packets | Discarded packets |
| A | 0 | 11115 | 2 |
| B | 0 | 10413 | 2 |
| C | 0 | 10003 | 2 |
| D | 0 | 11707 | 2 |
| Quadrant | Total seconds | Saturated seconds | Saturation percentage |
|---|---|---|---|
| A | 4896 | 22 | 0.449346% |
| B | 4896 | 34 | 0.694444% |
| C | 4896 | 7 | 0.142974% |
| D | 4896 | 102 | 2.083333% |
Noise dominated data is calculated using 1-second bins in cleaned event files. If a bin has >2000 counts, and if more than 50% of those come from <1% of pixels, then it is considered to be noise-dominated and hence unusable.
| Quadrant | # 1 sec bins | Bins with >0 counts | Bins with >2000 counts | High rate bins dominated by noise | Noise dominated (total time) | Noise dominated (detector-on time) | Marked lightcurve |
|---|---|---|---|---|---|---|---|
| A | 7048 | 4897 | 13 | 13 | 0.18% | 0.27% | 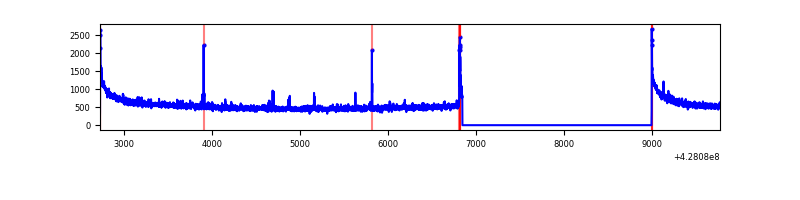 |
| B | 7048 | 4897 | 27 | 27 | 0.38% | 0.55% | 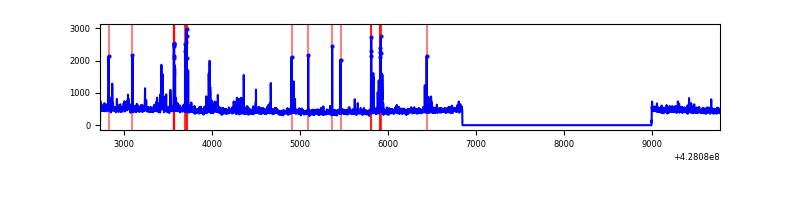 |
| C | 7048 | 4897 | 1 | 1 | 0.01% | 0.02% | 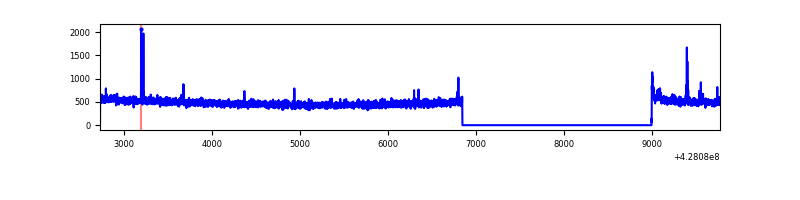 |
| D | 7048 | 4897 | 85 | 85 | 1.21% | 1.74% | 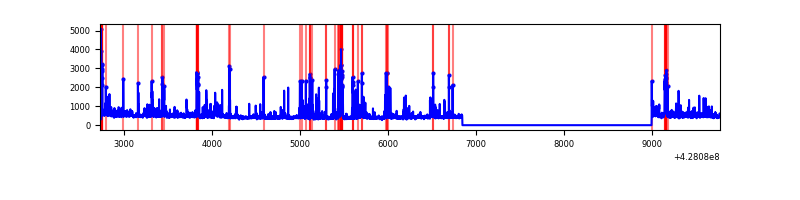 |
Top three noisy pixels from each quadrant. If the there are fewer than three noisy pixels in the level2.evt file, extra rows are filled as -1
| Pixel properties | Quadrant properties | ||||||
|---|---|---|---|---|---|---|---|
| Quadrant | DetID | PixID | Counts | Sigma | Mean | Median | Sigma |
| A | 10 | 83 | 557384 | 5052.68 | 543 | 534 | 110.2 |
| A | 7 | 3 | 43997 | 394.37 | 543 | 534 | 110.2 |
| A | 15 | 252 | 9086 | 77.6 | 543 | 534 | 110.2 |
| B | 5 | 172 | 65394 | 632.17 | 542 | 526 | 102.6 |
| B | 15 | 35 | 64034 | 618.91 | 542 | 526 | 102.6 |
| B | 3 | 112 | 60653 | 585.96 | 542 | 526 | 102.6 |
| C | 15 | 214 | 205491 | 1628.13 | 542 | 545 | 125.9 |
| C | 12 | 249 | 16292 | 125.1 | 542 | 545 | 125.9 |
| C | 3 | 233 | 14880 | 113.88 | 542 | 545 | 125.9 |
| D | 12 | 6 | 197766 | 1520.73 | 536 | 522 | 129.7 |
| D | 13 | 249 | 145506 | 1117.81 | 536 | 522 | 129.7 |
| D | 5 | 171 | 114643 | 879.86 | 536 | 522 | 129.7 |
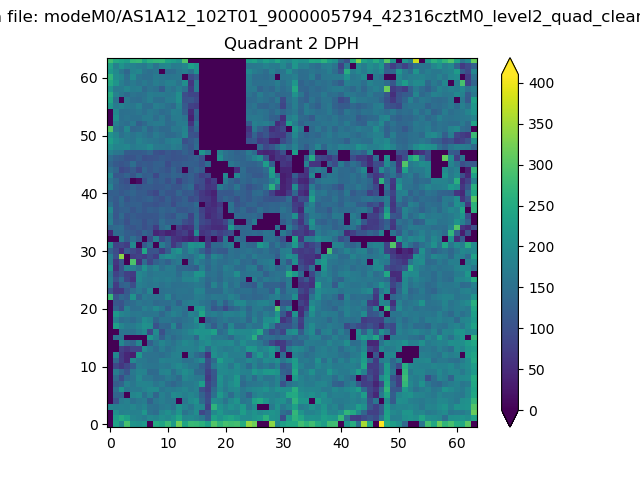
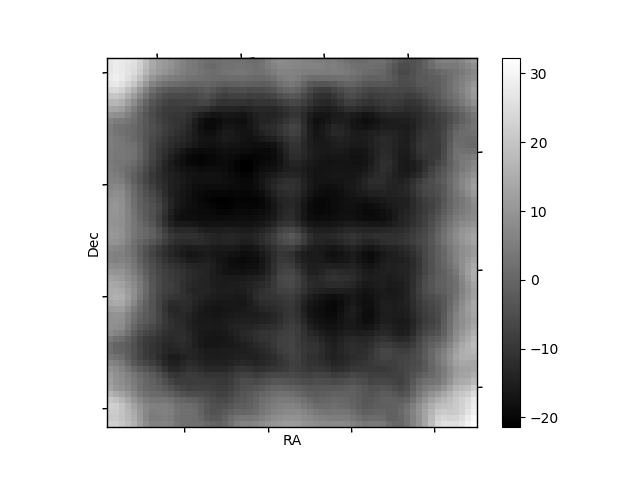
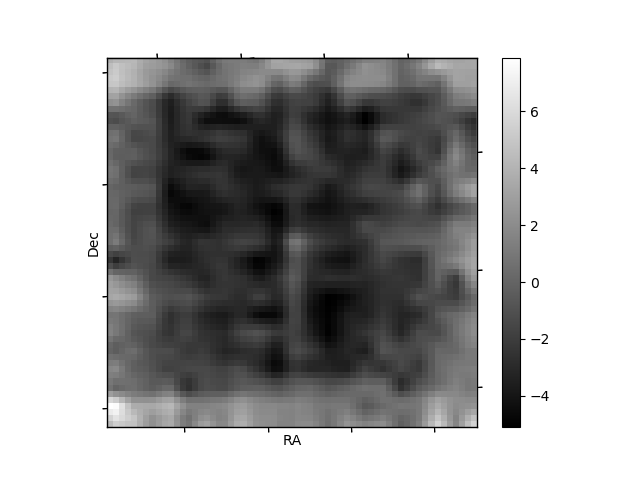
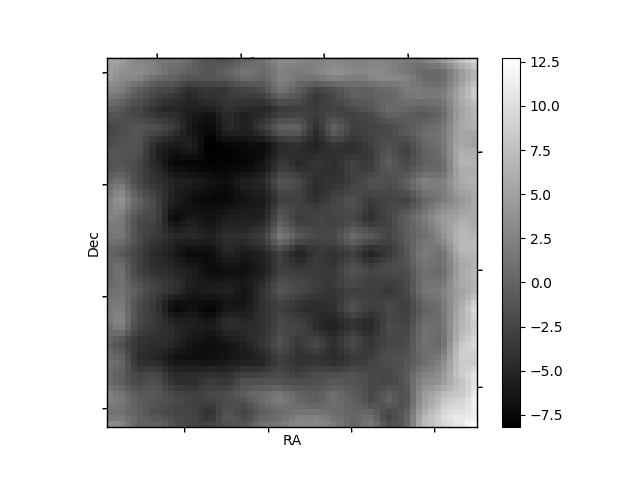
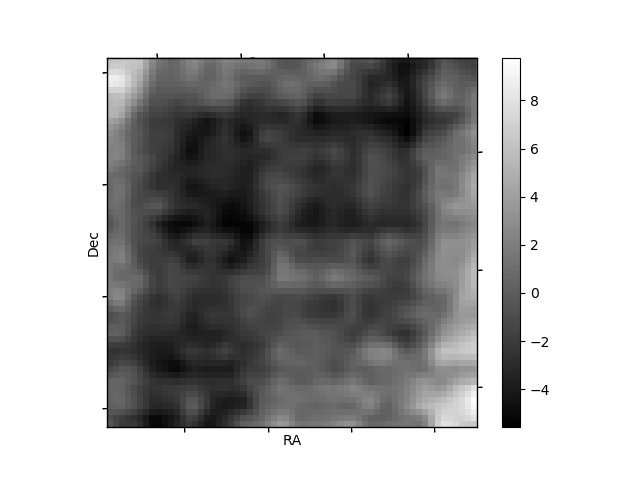
Histogram calculated using DETX and DETY for each event in the final _common_clean file
| Quadrant A | 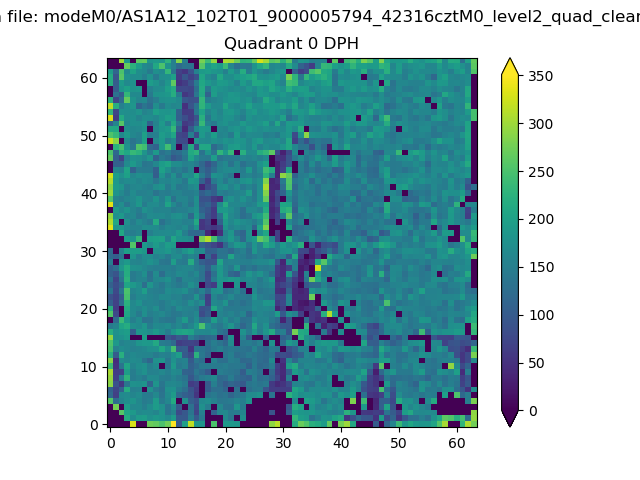 |
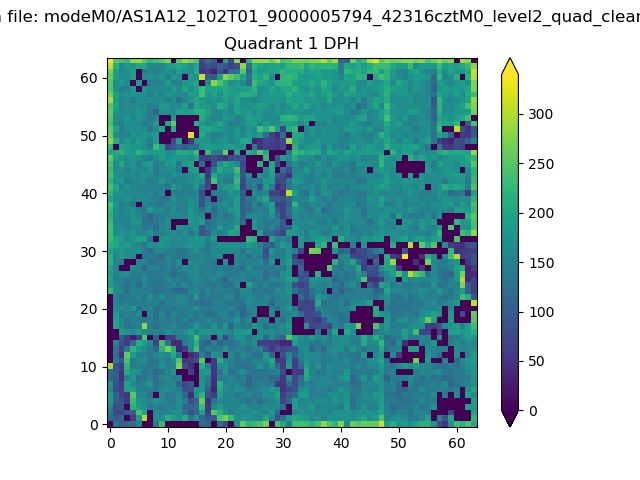 |
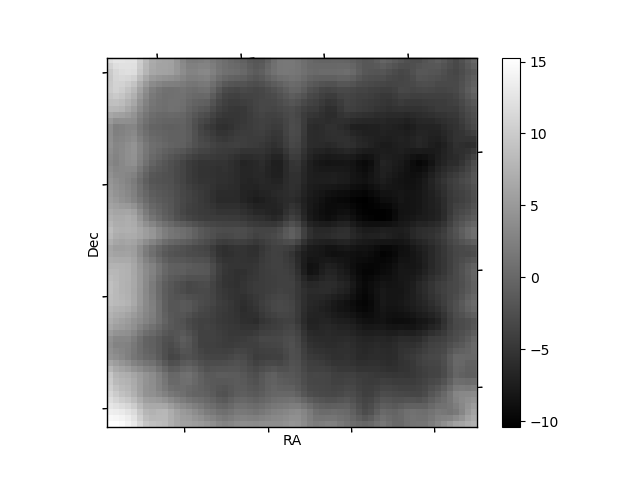
Quadrant B |
|---|---|---|---|
| Quadrant D | 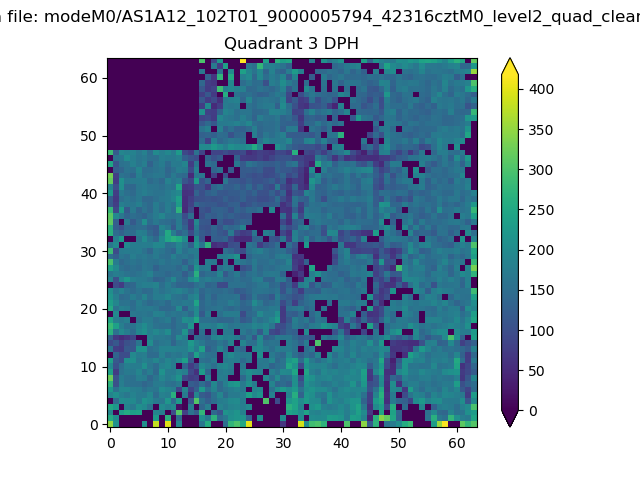 |
 |
Quadrant C |
| Plot type | Count rate plots | Images |
|---|---|---|
| Comparison with Poisson distribution Blue bars denote a histogram of data divided into 1 sec bins. Red curve is a Poisson curve with rate = median count rate of data. |
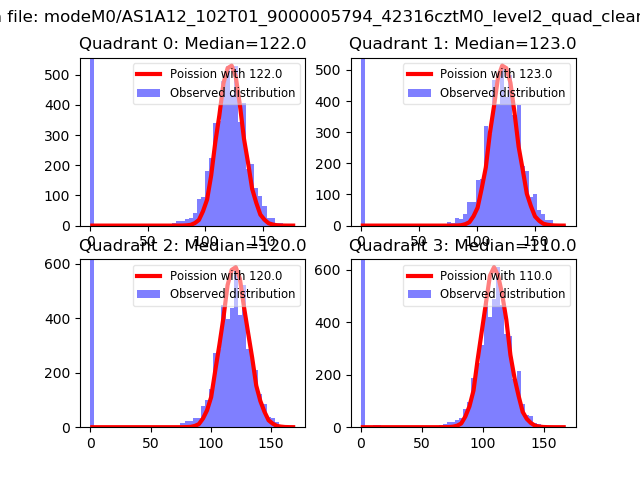 |
 |
| Quadrant-wise count rates Data is divided into 100 sec bins |
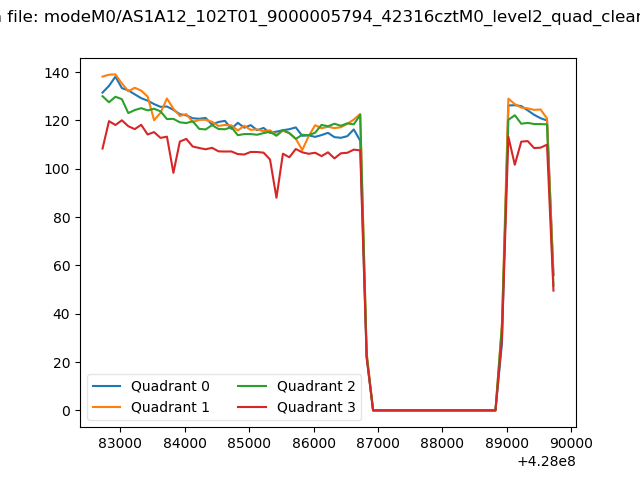 |
|
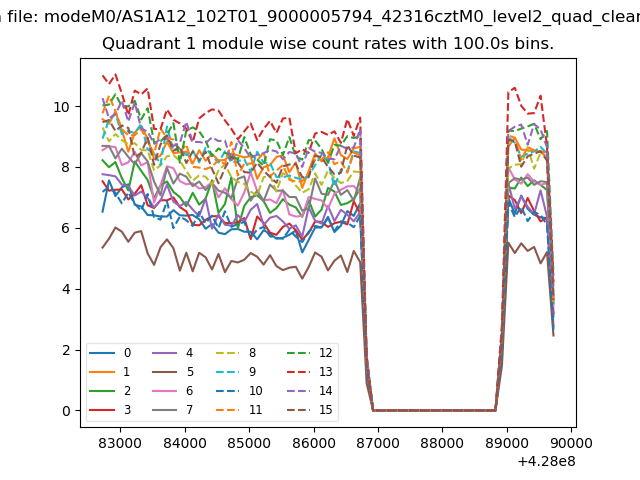
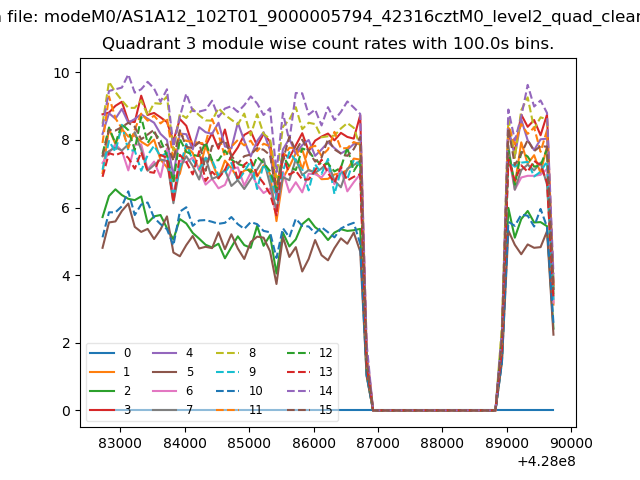
| Module-wise count rates for Quadrant A Data is divided into 100 sec bins |
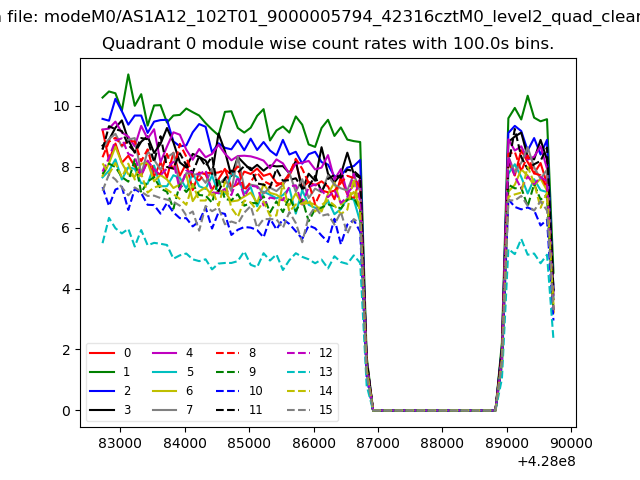 |
 |
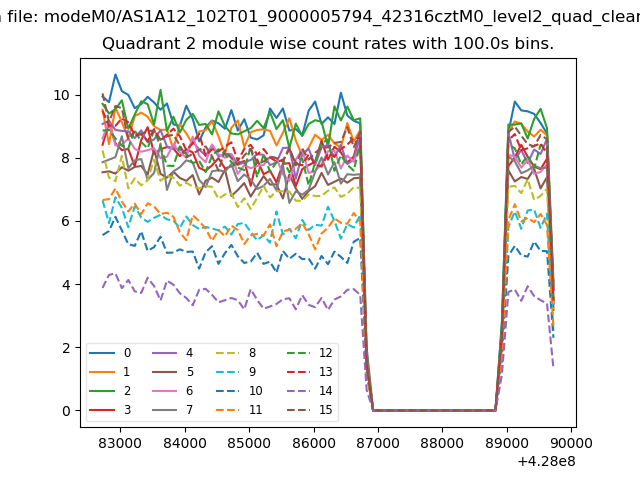
| Module-wise count rates for Quadrant B Data is divided into 100 sec bins |
 |
 |
| Module-wise count rates for Quadrant C Data is divided into 100 sec bins |
 |
 |
| Module-wise count rates for Quadrant D Data is divided into 100 sec bins |
 |
 |
| Parameter | Plot |
|---|---|
| CZT HV Monitor | 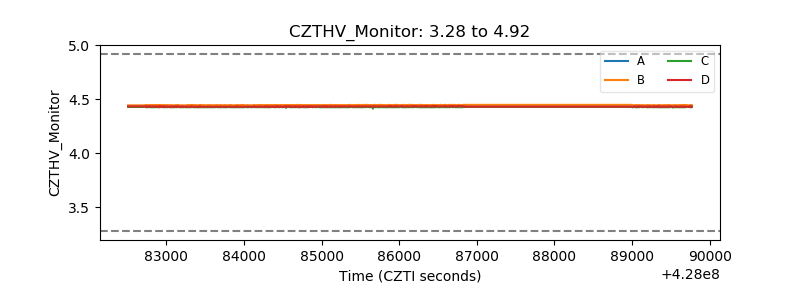 |
| D_VDD | 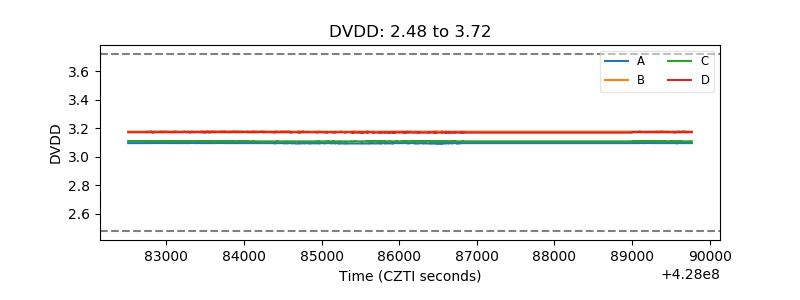 |
| Temperature 1 | 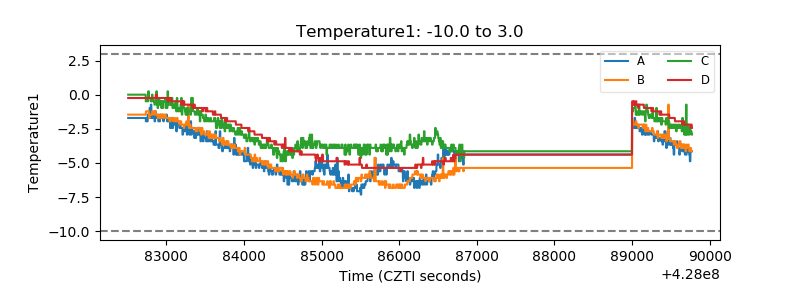 |
| Veto HV Monitor | 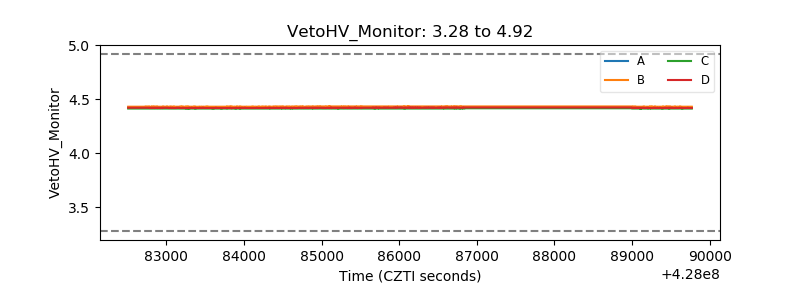 |
| Veto LLD |  |
| Alpha Counter | 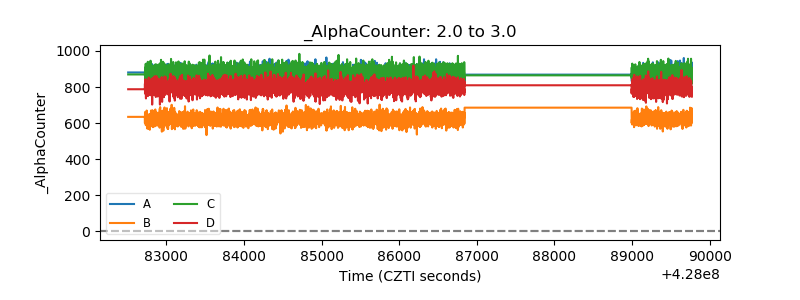 |
| _CPM_Rate | 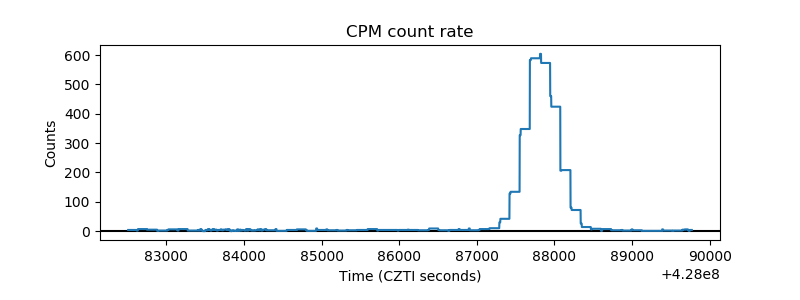 |
| CZT Counter | 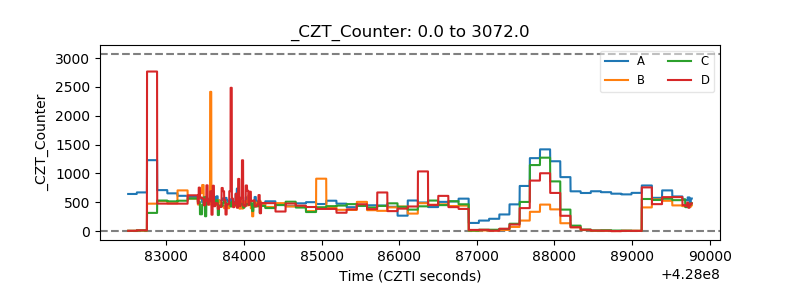 |
| +2.5 Volts monitor | 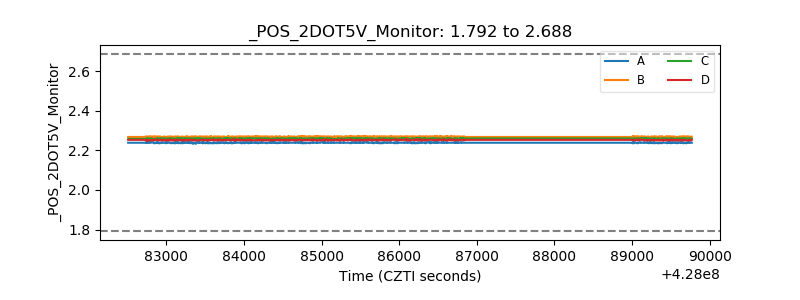 |
| +5 Volts monitor | 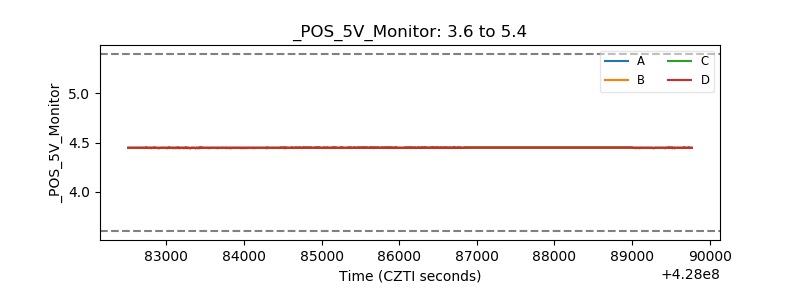 |
| _ROLL_ROT | 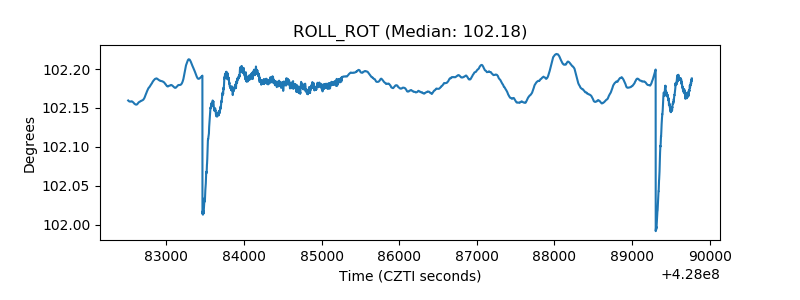 |
| _Roll_DEC | 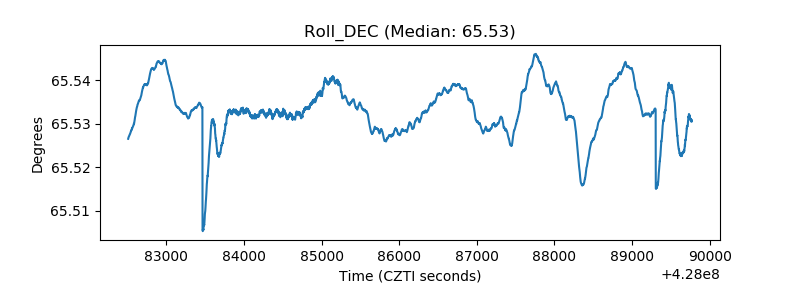 |
| _Roll_RA | 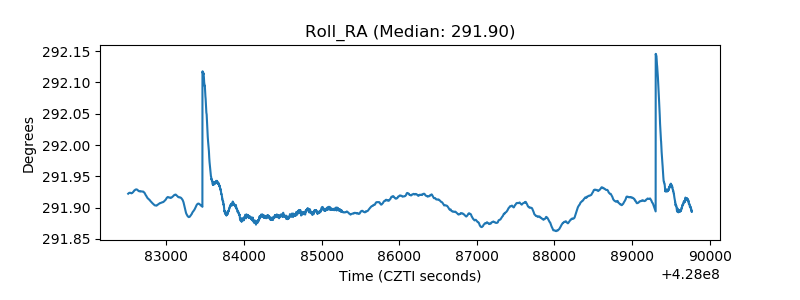 |
| Veto Counter | 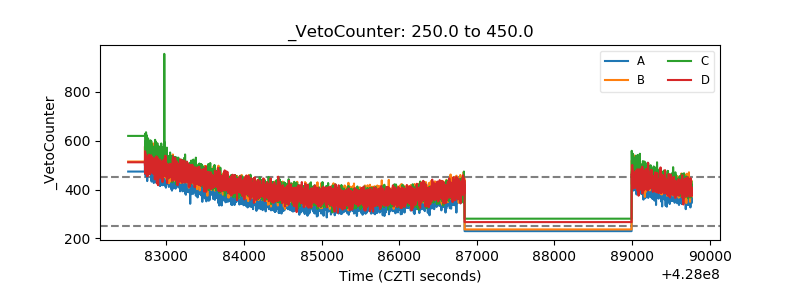 |