| Param | Original file | Final file |
|---|---|---|
| Filename | modeM0/AS1A12_102T01_9000005794_42317cztM0_level2.fits | modeM0/AS1A12_102T01_9000005794_42317cztM0_level2_quad_clean.evt |
| Size (bytes) | 278,807,040 | 85,844,160 |
| Size | 265.9 MB | 81.9 MB |
| Events in quadrant A | 2,648,565 | 574,004 |
| Events in quadrant B | 2,254,268 | 581,376 |
| Events in quadrant C | 2,328,486 | 569,290 |
| Events in quadrant D | 2,696,885 | 522,399 |
| Mode M9 | |||
|---|---|---|---|
| Quadrant | BADHDUFLAG | Total packets | Discarded packets |
| A | 0 | 33 | 0 |
| B | 0 | 34 | 0 |
| C | 0 | 34 | 0 |
| D | 0 | 34 | 0 |
| Mode SS | |||
|---|---|---|---|
| Quadrant | BADHDUFLAG | Total packets | Discarded packets |
| A | 0 | 102 | 0 |
| B | 0 | 102 | 0 |
| C | 0 | 102 | 0 |
| D | 0 | 102 | 0 |
| Mode M0 | |||
|---|---|---|---|
| Quadrant | BADHDUFLAG | Total packets | Discarded packets |
| A | 0 | 10983 | 2 |
| B | 0 | 10384 | 2 |
| C | 0 | 10194 | 3 |
| D | 0 | 11644 | 2 |
| Quadrant | Total seconds | Saturated seconds | Saturation percentage |
|---|---|---|---|
| A | 5028 | 16 | 0.318218% |
| B | 5028 | 27 | 0.536993% |
| C | 5027 | 3 | 0.059678% |
| D | 5027 | 69 | 1.372588% |
Noise dominated data is calculated using 1-second bins in cleaned event files. If a bin has >2000 counts, and if more than 50% of those come from <1% of pixels, then it is considered to be noise-dominated and hence unusable.
| Quadrant | # 1 sec bins | Bins with >0 counts | Bins with >2000 counts | High rate bins dominated by noise | Noise dominated (total time) | Noise dominated (detector-on time) | Marked lightcurve |
|---|---|---|---|---|---|---|---|
| A | 7091 | 5029 | 7 | 7 | 0.10% | 0.14% | 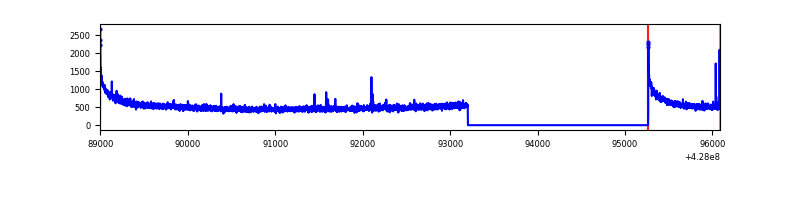 |
| B | 7091 | 5029 | 16 | 16 | 0.23% | 0.32% | 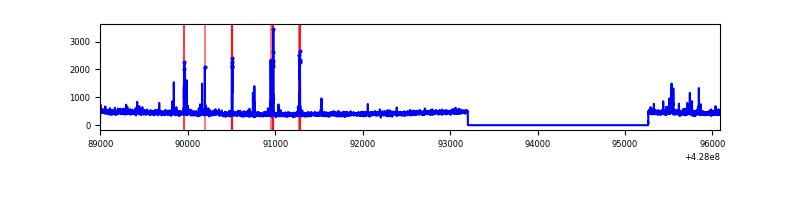 |
| C | 7090 | 5028 | 0 | 0 | 0.00% | 0.00% | 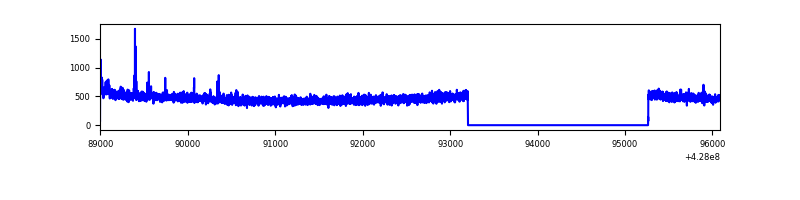 |
| D | 7090 | 5028 | 74 | 74 | 1.04% | 1.47% | 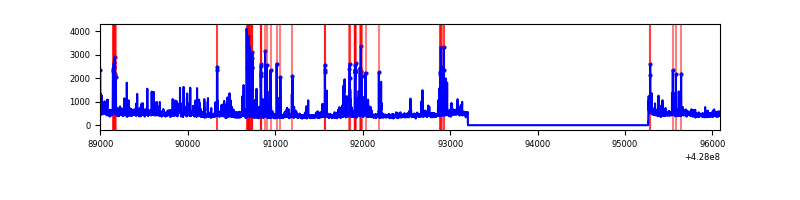 |
Top three noisy pixels from each quadrant. If the there are fewer than three noisy pixels in the level2.evt file, extra rows are filled as -1
| Pixel properties | Quadrant properties | ||||||
|---|---|---|---|---|---|---|---|
| Quadrant | DetID | PixID | Counts | Sigma | Mean | Median | Sigma |
| A | 10 | 83 | 544229 | 4988.13 | 535 | 524 | 109.0 |
| A | 13 | 6 | 10684 | 93.21 | 535 | 524 | 109.0 |
| A | 13 | 254 | 7854 | 67.25 | 535 | 524 | 109.0 |
| B | 5 | 172 | 49830 | 478.62 | 535 | 520 | 103.0 |
| B | 15 | 35 | 42328 | 405.81 | 535 | 520 | 103.0 |
| B | 5 | 255 | 33348 | 318.64 | 535 | 520 | 103.0 |
| C | 15 | 214 | 208902 | 1679.06 | 535 | 538 | 124.1 |
| C | 3 | 233 | 22841 | 179.72 | 535 | 538 | 124.1 |
| C | 12 | 249 | 9366 | 71.14 | 535 | 538 | 124.1 |
| D | 1 | 52 | 146450 | 1147.58 | 528 | 515 | 127.2 |
| D | 12 | 6 | 124137 | 972.12 | 528 | 515 | 127.2 |
| D | 2 | 249 | 112841 | 883.29 | 528 | 515 | 127.2 |
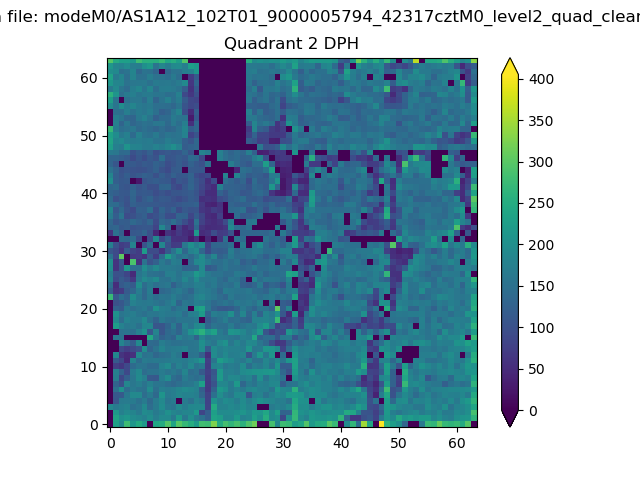
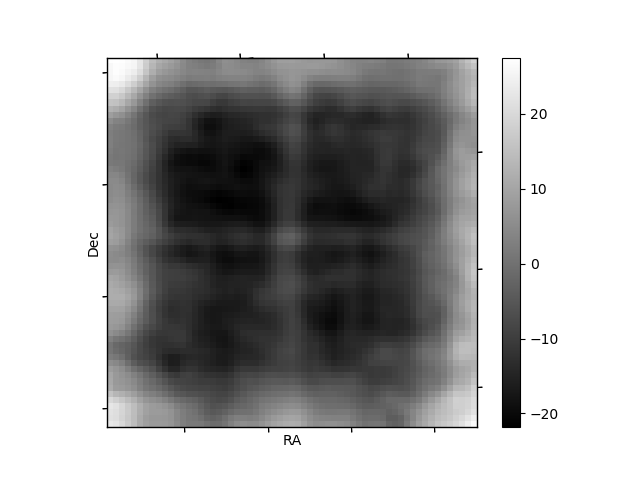
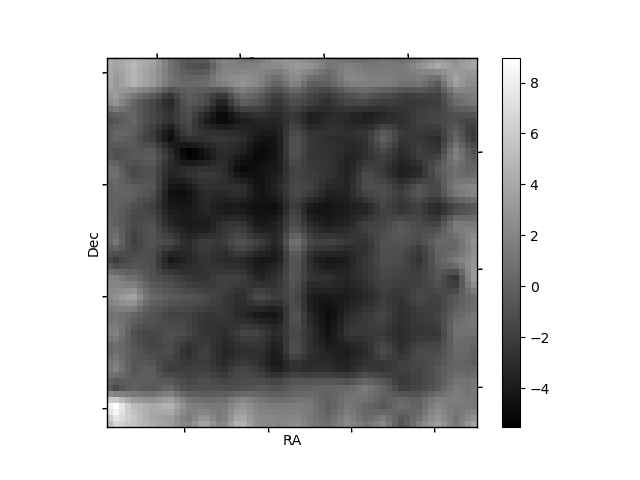
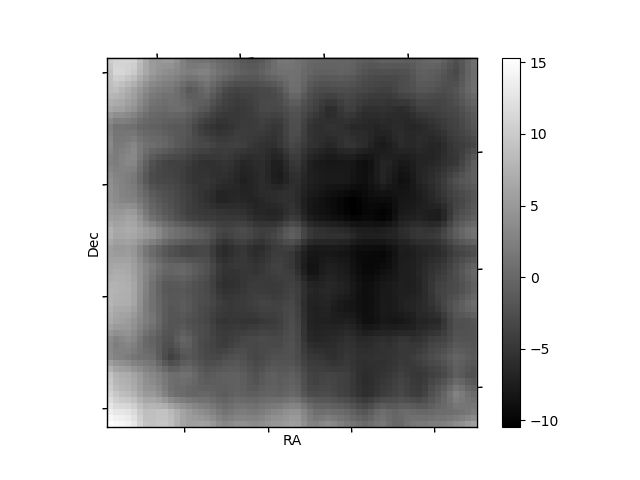
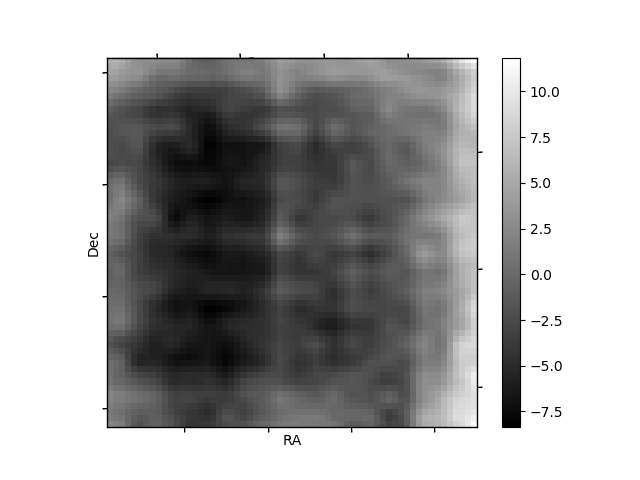
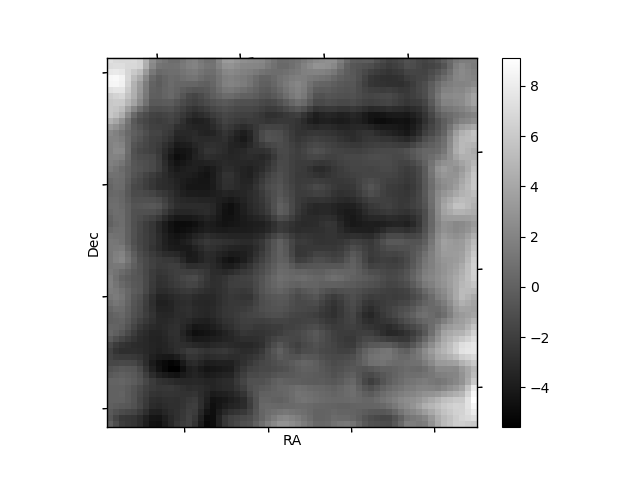
Histogram calculated using DETX and DETY for each event in the final _common_clean file
| Quadrant A | 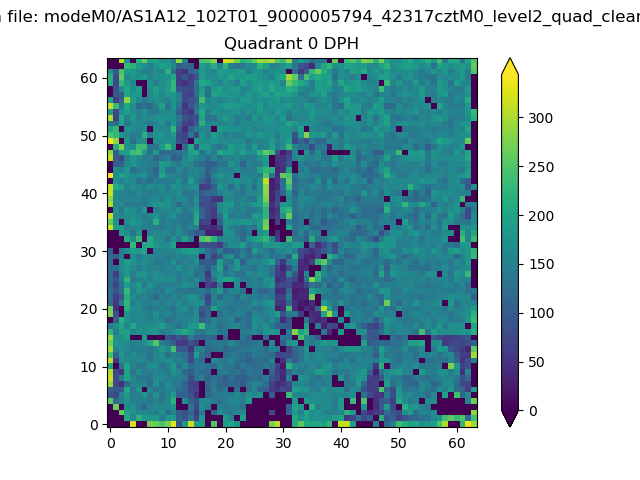 |
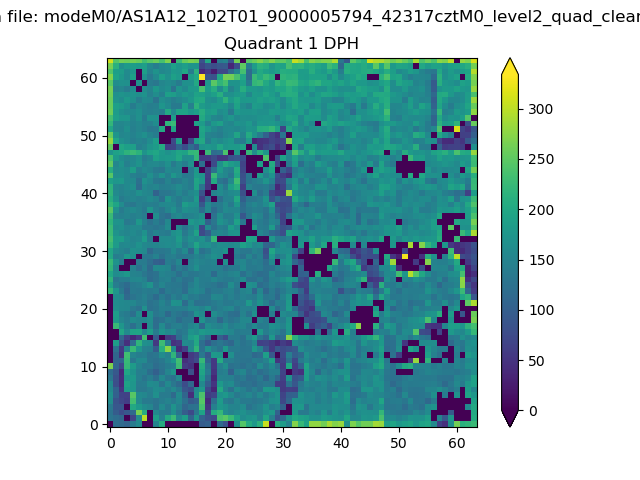 |
Quadrant B |
|---|---|---|---|
| Quadrant D | 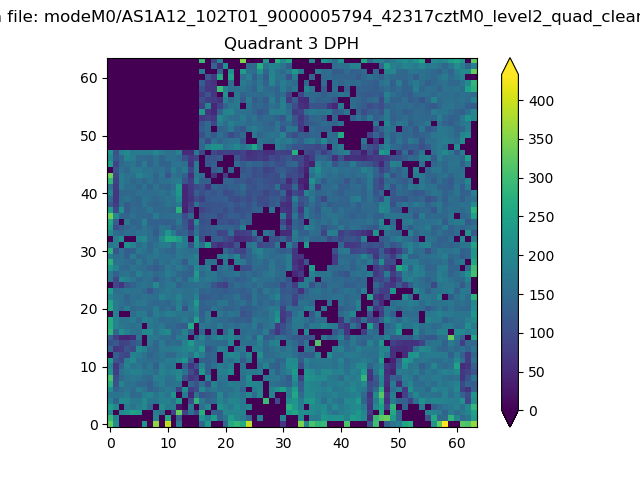 |
 |
Quadrant C |
| Plot type | Count rate plots | Images |
|---|---|---|
| Comparison with Poisson distribution Blue bars denote a histogram of data divided into 1 sec bins. Red curve is a Poisson curve with rate = median count rate of data. |
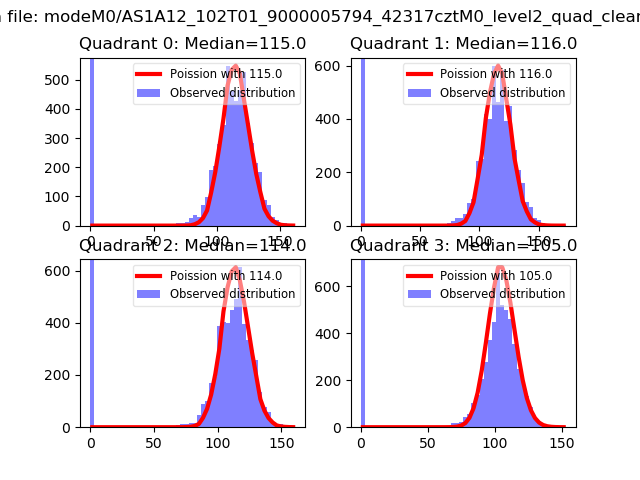 |
 |
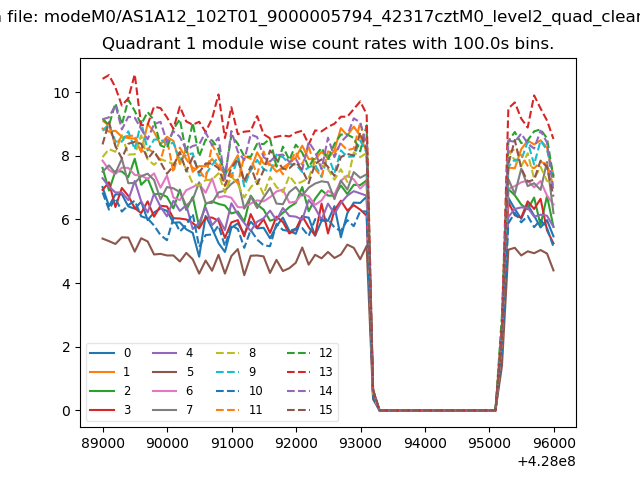
| Quadrant-wise count rates Data is divided into 100 sec bins |
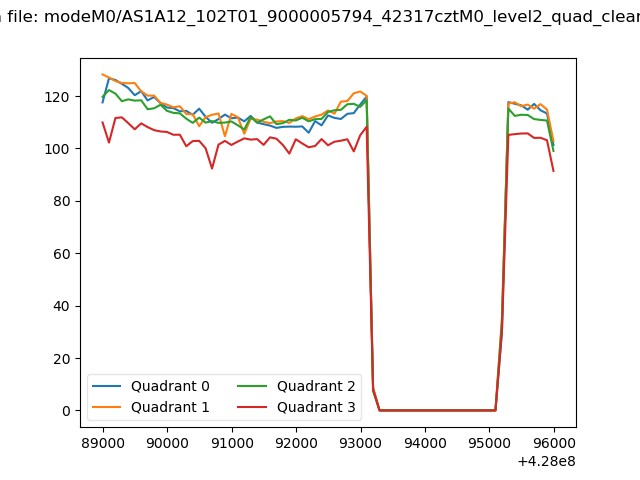 |
|
| Module-wise count rates for Quadrant A Data is divided into 100 sec bins |
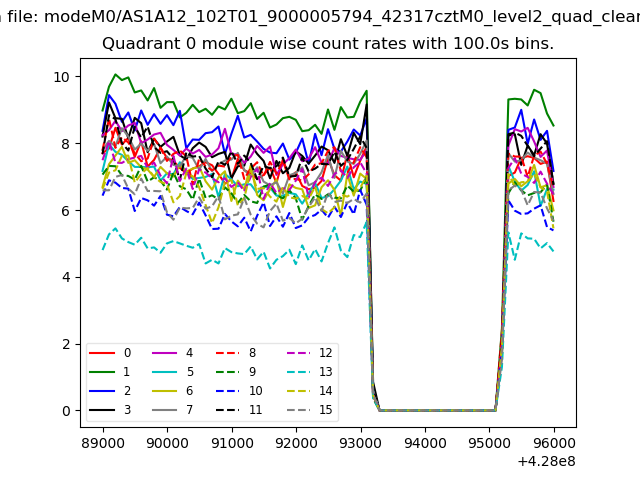 |
 |
| Module-wise count rates for Quadrant B Data is divided into 100 sec bins |
 |
 |
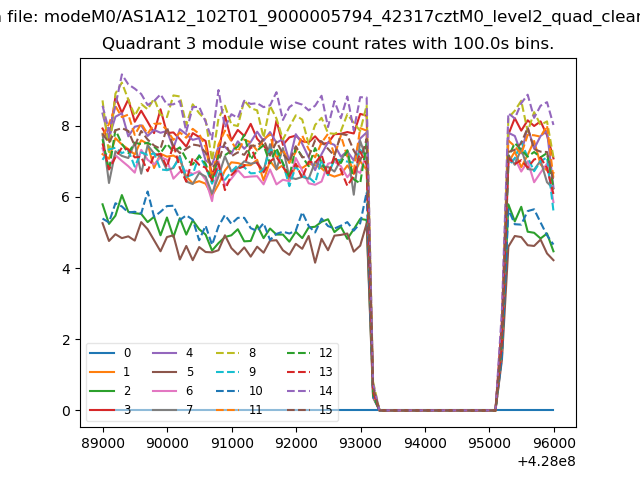
| Module-wise count rates for Quadrant C Data is divided into 100 sec bins |
 |
 |
| Module-wise count rates for Quadrant D Data is divided into 100 sec bins |
 |
 |
| Parameter | Plot |
|---|---|
| CZT HV Monitor | 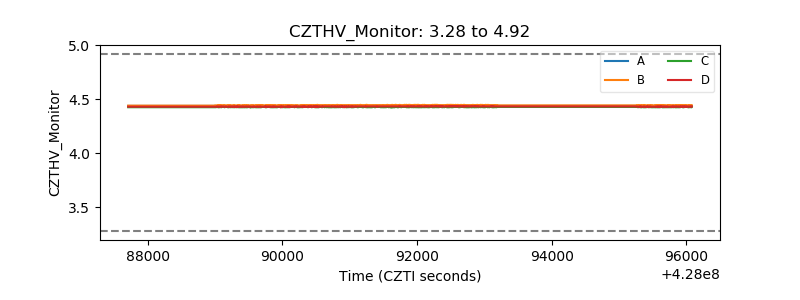 |
| D_VDD | 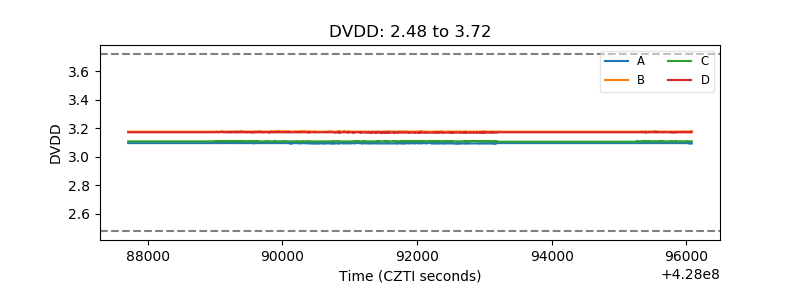 |
| Temperature 1 | 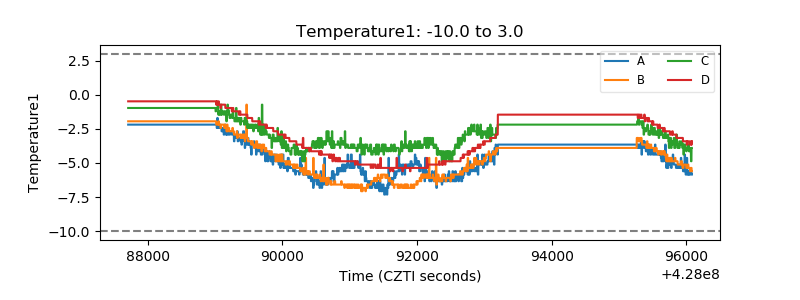 |
| Veto HV Monitor |  |
| Veto LLD | 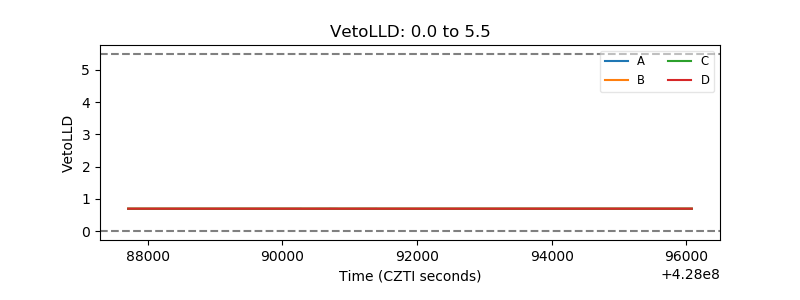 |
| Alpha Counter | 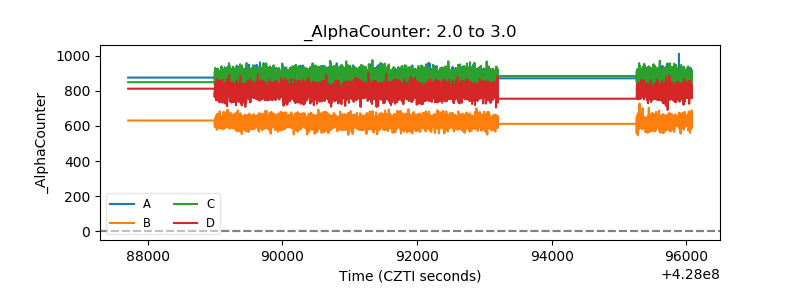 |
| _CPM_Rate | 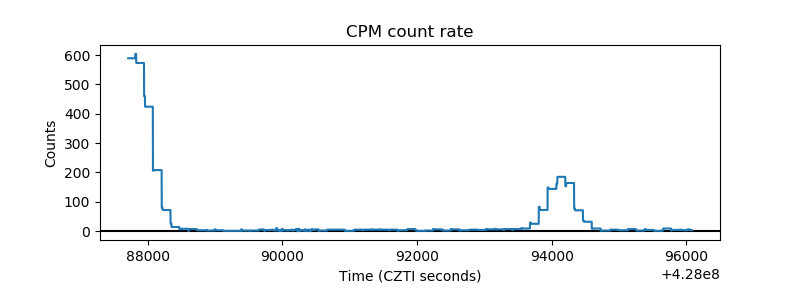 |
| CZT Counter | 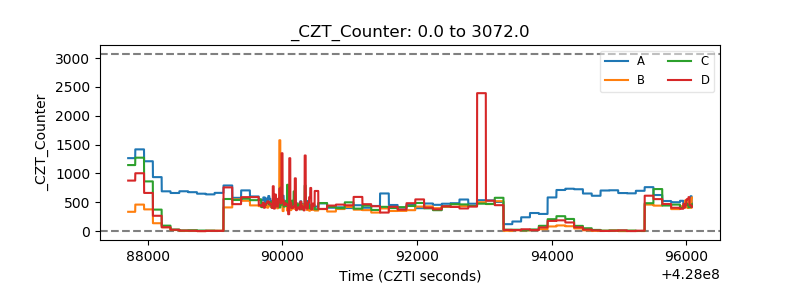 |
| +2.5 Volts monitor | 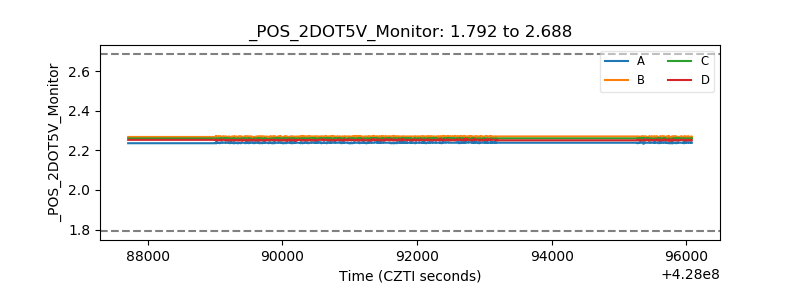 |
| +5 Volts monitor |  |
| _ROLL_ROT | 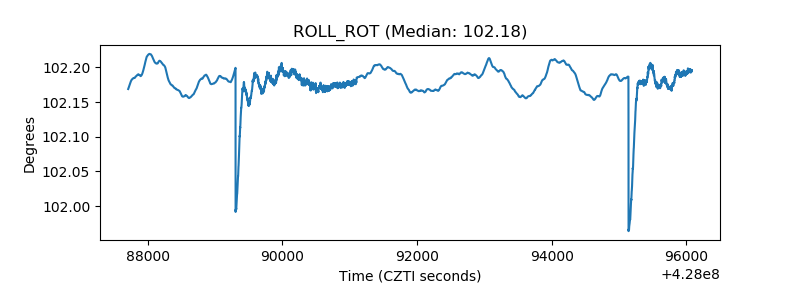 |
| _Roll_DEC | 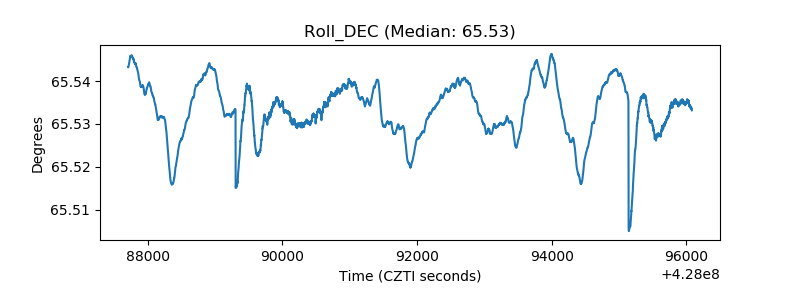 |
| _Roll_RA | 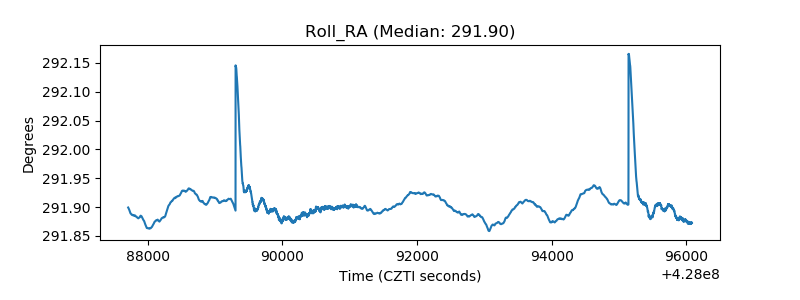 |
| Veto Counter | 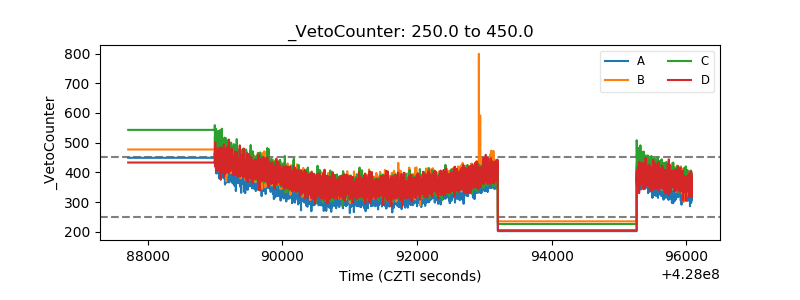 |