| Param | Original file | Final file |
|---|---|---|
| Filename | modeM0/AS1A12_102T01_9000005794_42318cztM0_level2.fits | modeM0/AS1A12_102T01_9000005794_42318cztM0_level2_quad_clean.evt |
| Size (bytes) | 283,832,640 | 82,189,440 |
| Size | 270.7 MB | 78.4 MB |
| Events in quadrant A | 2,805,152 | 545,771 |
| Events in quadrant B | 2,326,058 | 554,097 |
| Events in quadrant C | 2,226,446 | 543,598 |
| Events in quadrant D | 2,760,152 | 495,395 |
| Mode M9 | |||
|---|---|---|---|
| Quadrant | BADHDUFLAG | Total packets | Discarded packets |
| A | 0 | 29 | 0 |
| B | 0 | 30 | 0 |
| C | 0 | 30 | 0 |
| D | 0 | 30 | 0 |
| Mode SS | |||
|---|---|---|---|
| Quadrant | BADHDUFLAG | Total packets | Discarded packets |
| A | 0 | 104 | 0 |
| B | 0 | 104 | 0 |
| C | 0 | 104 | 0 |
| D | 0 | 104 | 0 |
| Mode M0 | |||
|---|---|---|---|
| Quadrant | BADHDUFLAG | Total packets | Discarded packets |
| A | 0 | 11576 | 2 |
| B | 0 | 10654 | 2 |
| C | 0 | 9988 | 2 |
| D | 0 | 11794 | 2 |
| Quadrant | Total seconds | Saturated seconds | Saturation percentage |
|---|---|---|---|
| A | 4981 | 31 | 0.622365% |
| B | 4981 | 48 | 0.963662% |
| C | 4981 | 3 | 0.060229% |
| D | 4981 | 132 | 2.650070% |
Noise dominated data is calculated using 1-second bins in cleaned event files. If a bin has >2000 counts, and if more than 50% of those come from <1% of pixels, then it is considered to be noise-dominated and hence unusable.
| Quadrant | # 1 sec bins | Bins with >0 counts | Bins with >2000 counts | High rate bins dominated by noise | Noise dominated (total time) | Noise dominated (detector-on time) | Marked lightcurve |
|---|---|---|---|---|---|---|---|
| A | 6774 | 4982 | 14 | 14 | 0.21% | 0.28% | 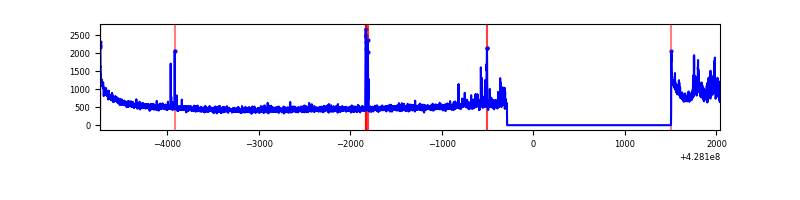 |
| B | 6774 | 4982 | 30 | 30 | 0.44% | 0.60% | 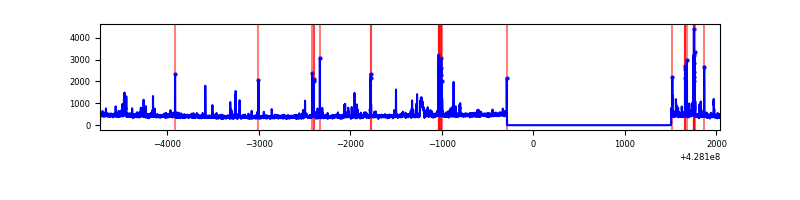 |
| C | 6774 | 4982 | 0 | 0 | 0.00% | 0.00% | 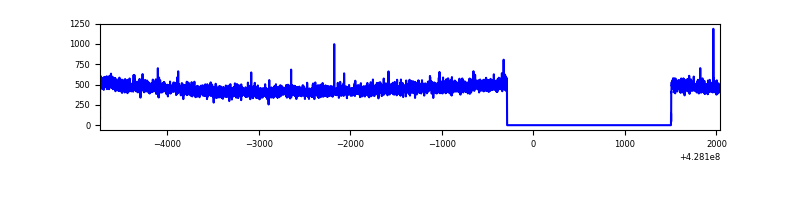 |
| D | 6774 | 4982 | 119 | 119 | 1.76% | 2.39% | 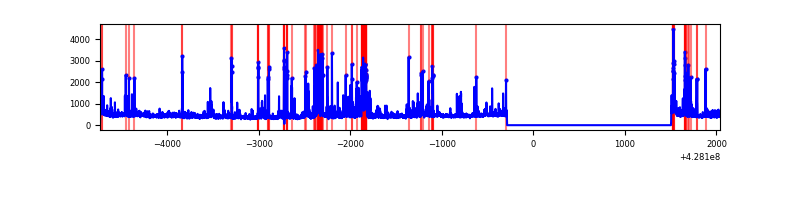 |
Top three noisy pixels from each quadrant. If the there are fewer than three noisy pixels in the level2.evt file, extra rows are filled as -1
| Pixel properties | Quadrant properties | ||||||
|---|---|---|---|---|---|---|---|
| Quadrant | DetID | PixID | Counts | Sigma | Mean | Median | Sigma |
| A | 10 | 83 | 517032 | 4862.22 | 520 | 509 | 106.2 |
| A | 15 | 223 | 217888 | 2046.27 | 520 | 509 | 106.2 |
| A | 15 | 252 | 38131 | 354.15 | 520 | 509 | 106.2 |
| B | 5 | 172 | 157827 | 1556.94 | 519 | 503 | 101.0 |
| B | 3 | 112 | 49068 | 480.62 | 519 | 503 | 101.0 |
| B | 15 | 35 | 31811 | 309.84 | 519 | 503 | 101.0 |
| C | 15 | 214 | 209038 | 1735.04 | 516 | 519 | 120.2 |
| C | 12 | 249 | 4294 | 31.41 | 516 | 519 | 120.2 |
| C | 13 | 61 | 3450 | 24.39 | 516 | 519 | 120.2 |
| D | 12 | 6 | 260158 | 2109.44 | 506 | 493 | 123.1 |
| D | 2 | 249 | 187872 | 1522.21 | 506 | 493 | 123.1 |
| D | 13 | 249 | 153635 | 1244.08 | 506 | 493 | 123.1 |
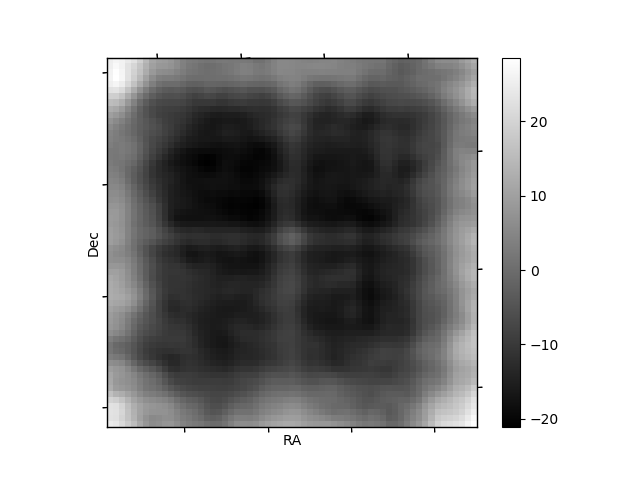
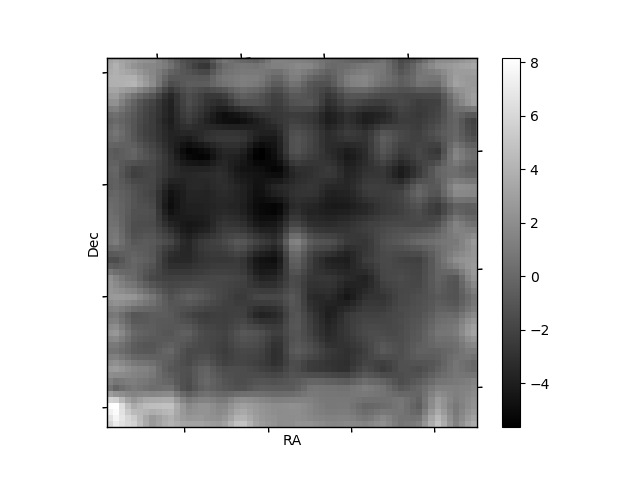
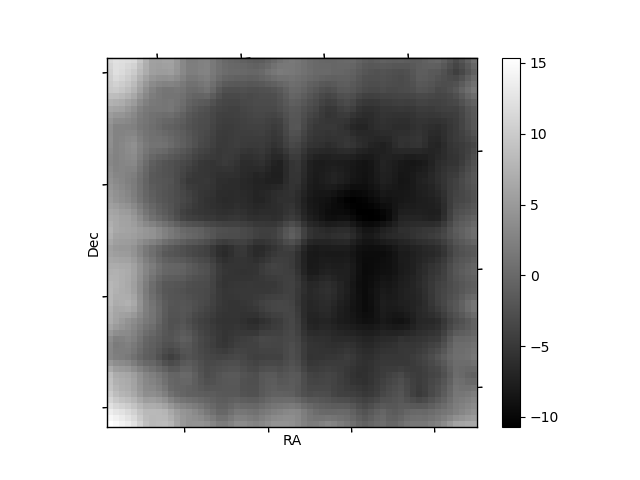
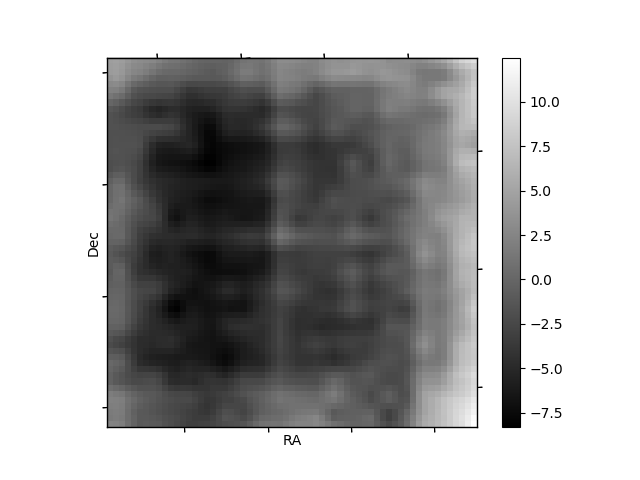
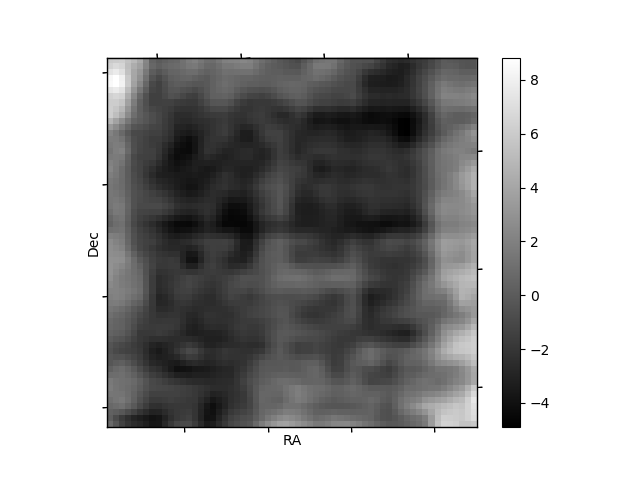
Histogram calculated using DETX and DETY for each event in the final _common_clean file
| Quadrant A | 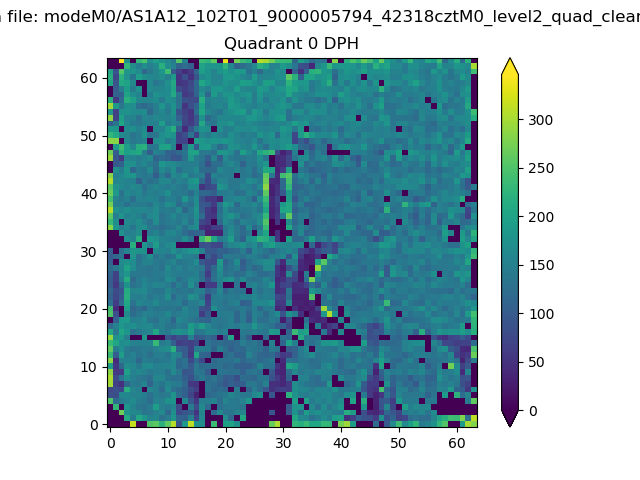 |
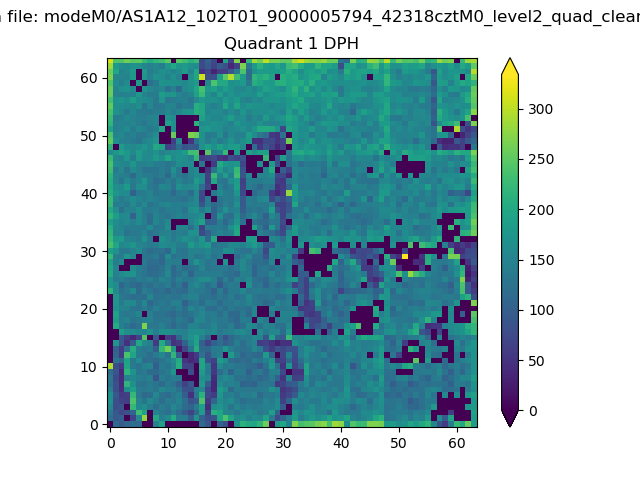 |
Quadrant B |
|---|---|---|---|
| Quadrant D | 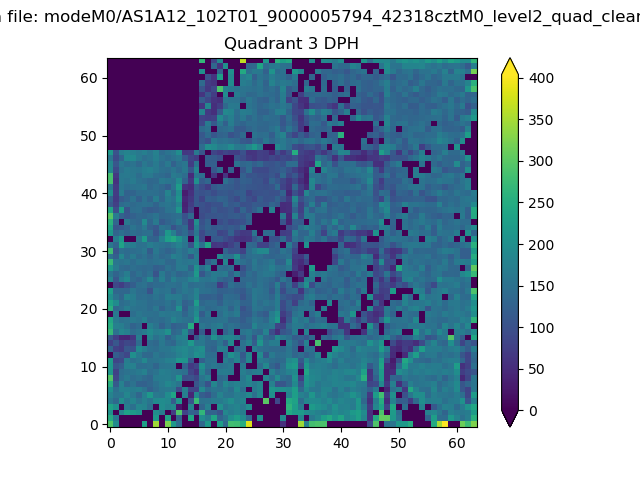 |
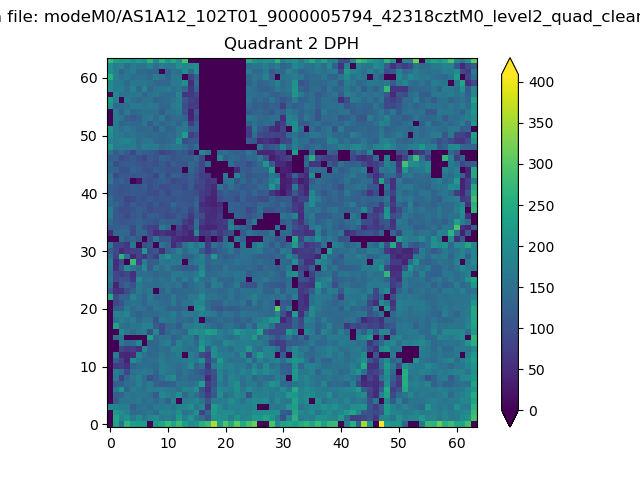 |
Quadrant C |
| Plot type | Count rate plots | Images |
|---|---|---|
| Comparison with Poisson distribution Blue bars denote a histogram of data divided into 1 sec bins. Red curve is a Poisson curve with rate = median count rate of data. |
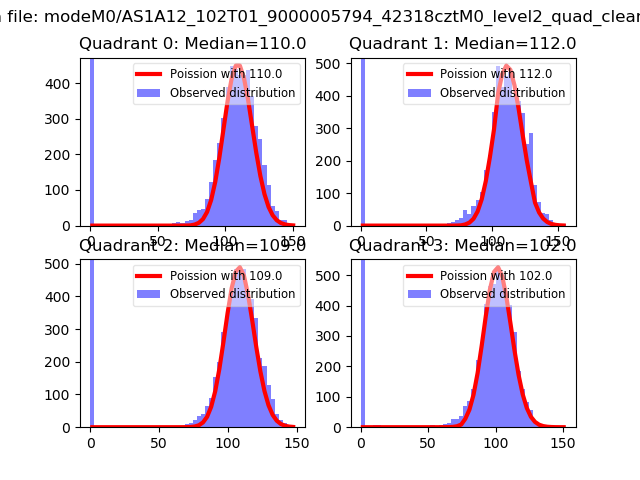 |
 |
| Quadrant-wise count rates Data is divided into 100 sec bins |
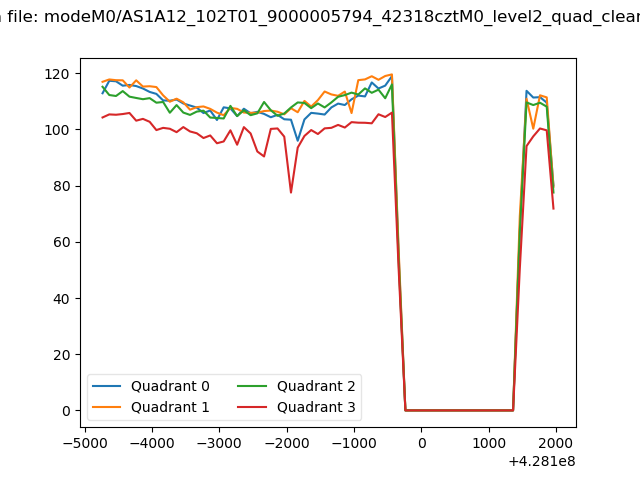 |
|
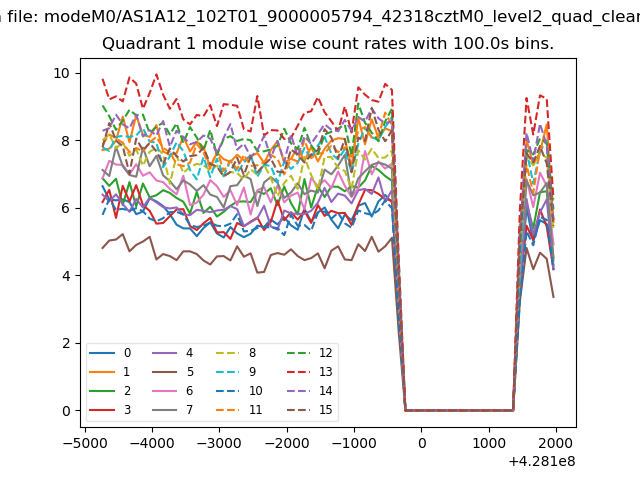
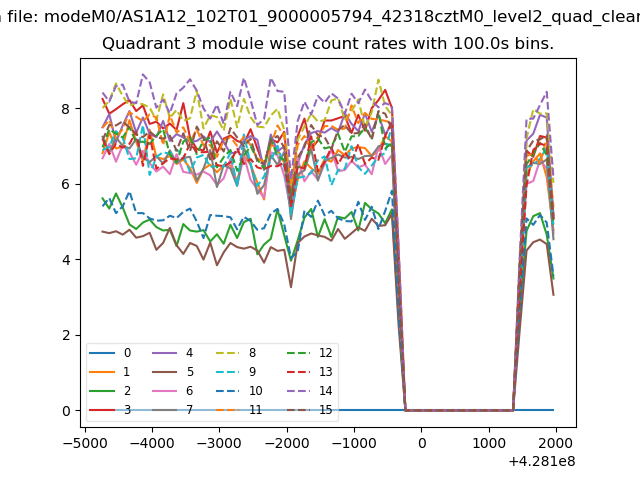
| Module-wise count rates for Quadrant A Data is divided into 100 sec bins |
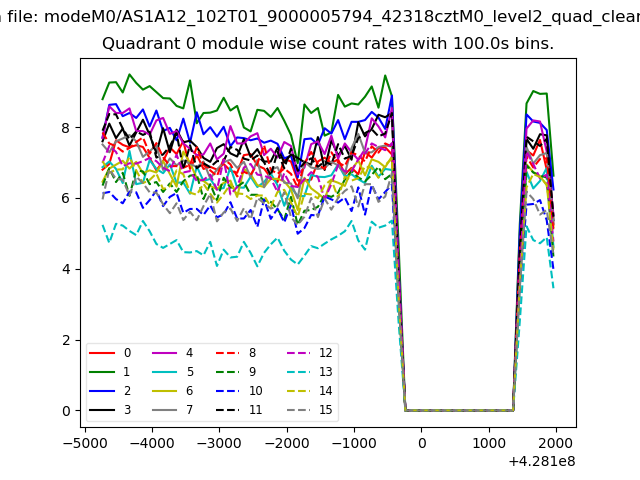 |
 |
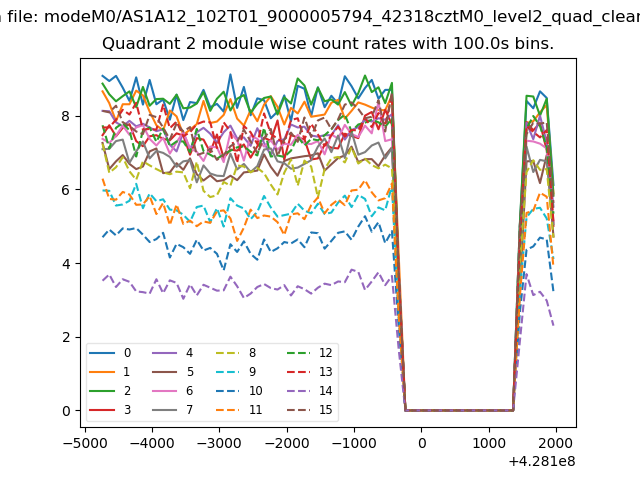
| Module-wise count rates for Quadrant B Data is divided into 100 sec bins |
 |
 |
| Module-wise count rates for Quadrant C Data is divided into 100 sec bins |
 |
 |
| Module-wise count rates for Quadrant D Data is divided into 100 sec bins |
 |
 |
| Parameter | Plot |
|---|---|
| CZT HV Monitor | 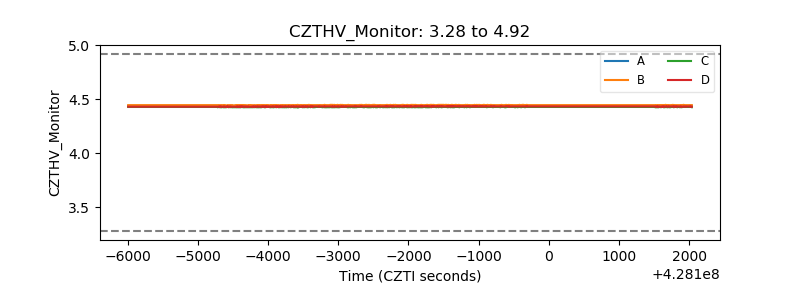 |
| D_VDD | 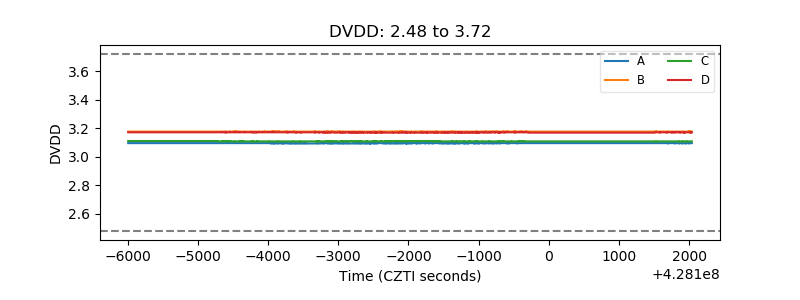 |
| Temperature 1 | 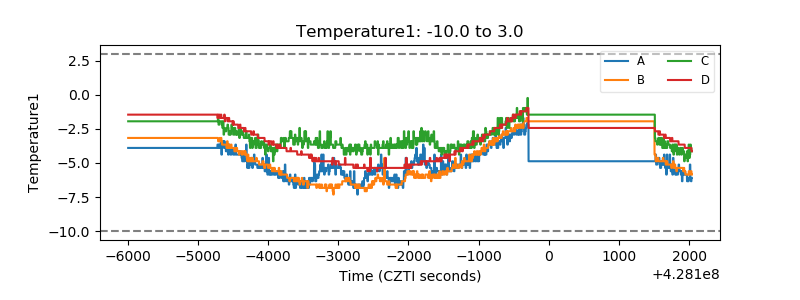 |
| Veto HV Monitor | 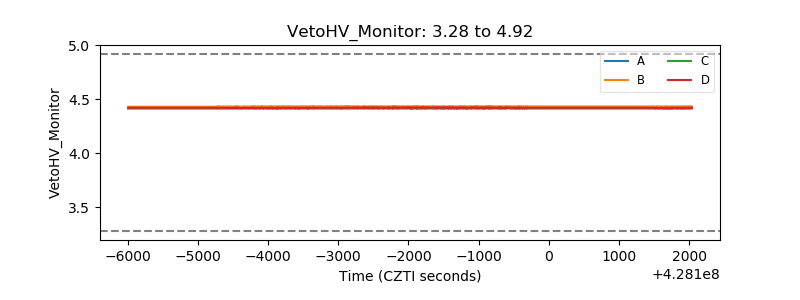 |
| Veto LLD |  |
| Alpha Counter | 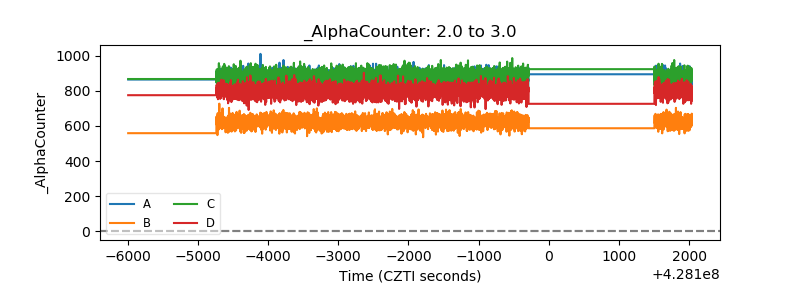 |
| _CPM_Rate | 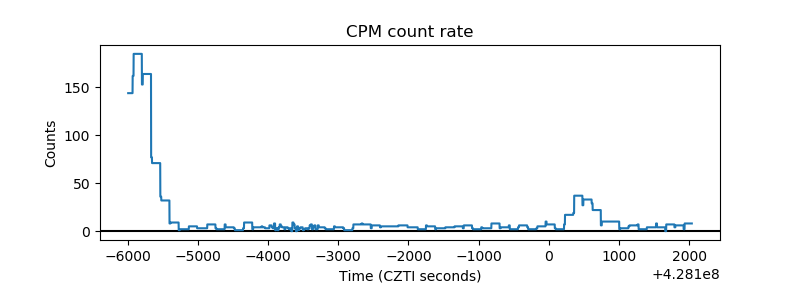 |
| CZT Counter | 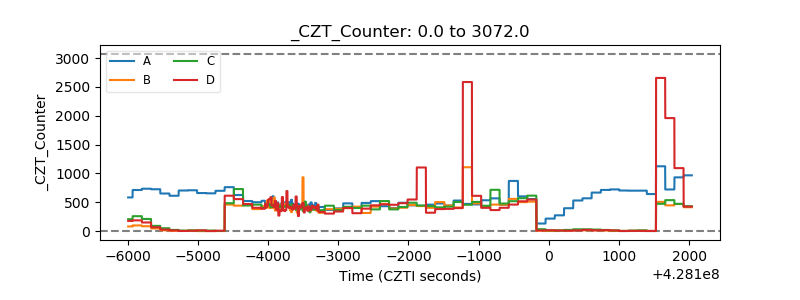 |
| +2.5 Volts monitor | 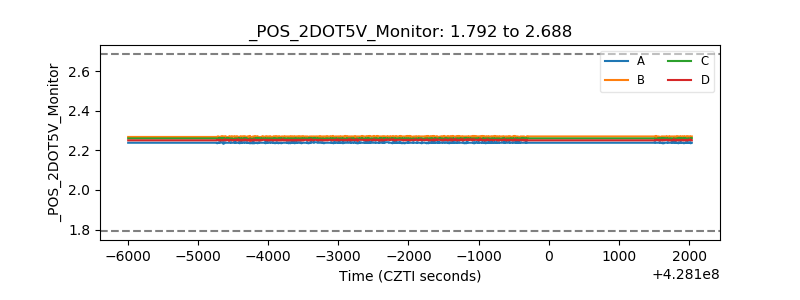 |
| +5 Volts monitor | 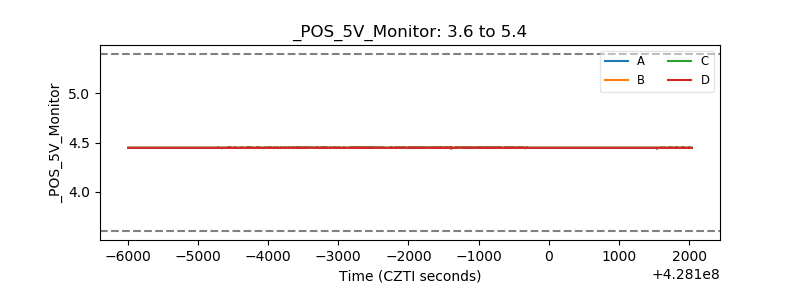 |
| _ROLL_ROT | 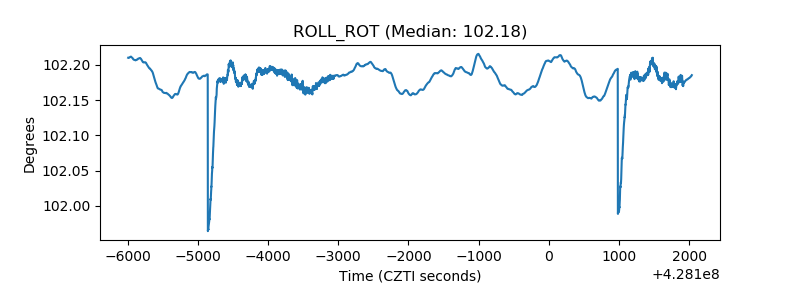 |
| _Roll_DEC | 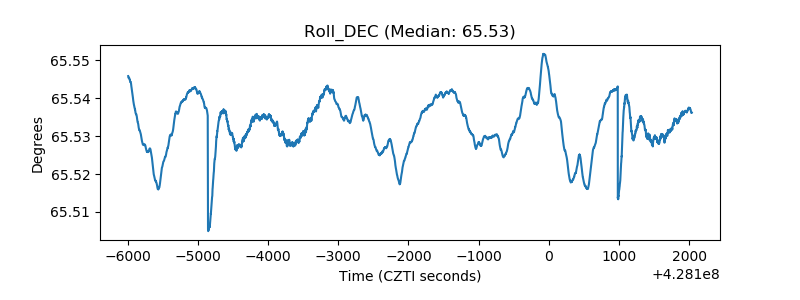 |
| _Roll_RA | 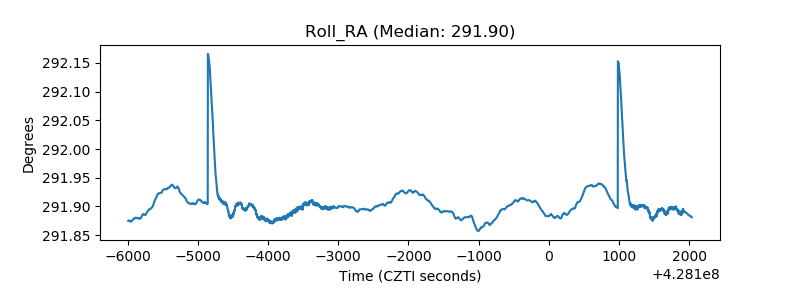 |
| Veto Counter | 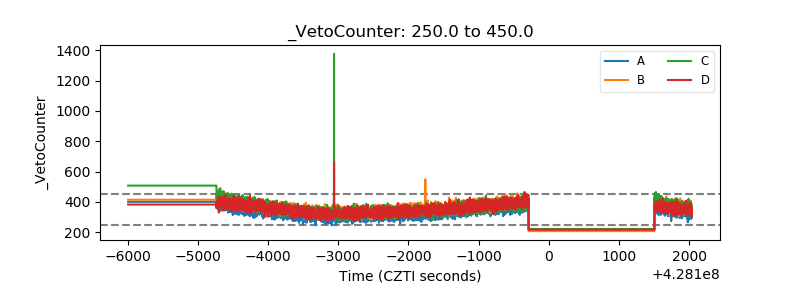 |