| Param | Original file | Final file |
|---|---|---|
| Filename | modeM0/AS1C07_001T10_9000005796_42319cztM0_level2.fits | modeM0/AS1C07_001T10_9000005796_42319cztM0_level2_quad_clean.evt |
| Size (bytes) | 266,310,720 | 75,021,120 |
| Size | 254.0 MB | 71.5 MB |
| Events in quadrant A | 2,857,076 | 492,877 |
| Events in quadrant B | 1,996,806 | 505,168 |
| Events in quadrant C | 2,126,646 | 492,846 |
| Events in quadrant D | 2,517,359 | 456,411 |
| Mode M0 | |||
|---|---|---|---|
| Quadrant | BADHDUFLAG | Total packets | Discarded packets |
| A | 0 | 11506 | 1 |
| B | 0 | 9400 | 2 |
| C | 0 | 9462 | 1 |
| D | 0 | 10878 | 1 |
| Mode SS | |||
|---|---|---|---|
| Quadrant | BADHDUFLAG | Total packets | Discarded packets |
| A | 0 | 96 | 0 |
| B | 0 | 96 | 0 |
| C | 0 | 96 | 0 |
| D | 0 | 96 | 0 |
| Mode M9 | |||
|---|---|---|---|
| Quadrant | BADHDUFLAG | Total packets | Discarded packets |
| A | 0 | 14 | 0 |
| B | 0 | 14 | 0 |
| C | 0 | 14 | 0 |
| D | 0 | 14 | 0 |
| Quadrant | Total seconds | Saturated seconds | Saturation percentage |
|---|---|---|---|
| A | 4610 | 66 | 1.431670% |
| B | 4609 | 7 | 0.151877% |
| C | 4609 | 20 | 0.433934% |
| D | 4609 | 77 | 1.670644% |
Noise dominated data is calculated using 1-second bins in cleaned event files. If a bin has >2000 counts, and if more than 50% of those come from <1% of pixels, then it is considered to be noise-dominated and hence unusable.
| Quadrant | # 1 sec bins | Bins with >0 counts | Bins with >2000 counts | High rate bins dominated by noise | Noise dominated (total time) | Noise dominated (detector-on time) | Marked lightcurve |
|---|---|---|---|---|---|---|---|
| A | 6071 | 4611 | 43 | 43 | 0.71% | 0.93% | 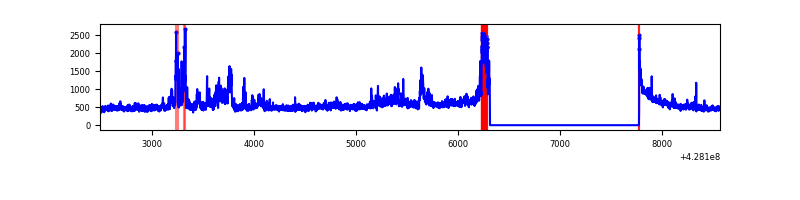 |
| B | 6070 | 4610 | 0 | 0 | 0.00% | 0.00% | 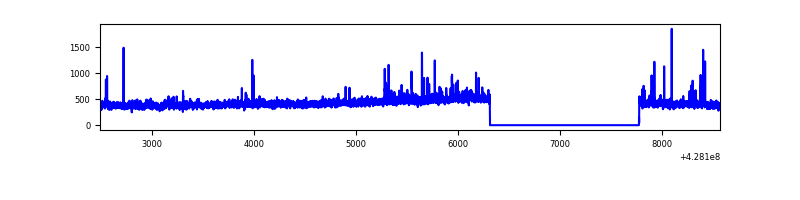 |
| C | 6070 | 4610 | 19 | 19 | 0.31% | 0.41% | 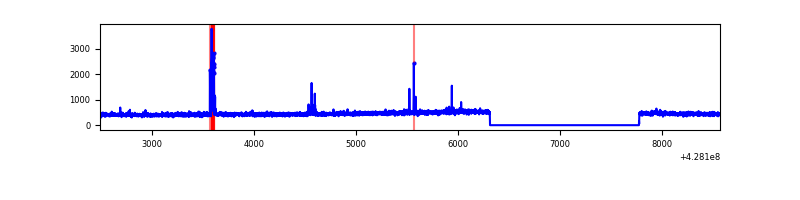 |
| D | 6070 | 4610 | 71 | 71 | 1.17% | 1.54% | 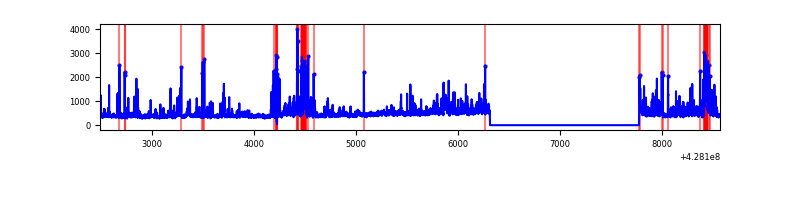 |
Top three noisy pixels from each quadrant. If the there are fewer than three noisy pixels in the level2.evt file, extra rows are filled as -1
| Pixel properties | Quadrant properties | ||||||
|---|---|---|---|---|---|---|---|
| Quadrant | DetID | PixID | Counts | Sigma | Mean | Median | Sigma |
| A | 15 | 223 | 553074 | 5525.41 | 488 | 479 | 100.0 |
| A | 10 | 83 | 402163 | 4016.44 | 488 | 479 | 100.0 |
| A | 13 | 248 | 8284 | 78.04 | 488 | 479 | 100.0 |
| B | 3 | 112 | 23218 | 240.99 | 485 | 471 | 94.4 |
| B | 5 | 172 | 18328 | 189.18 | 485 | 471 | 94.4 |
| B | 0 | 245 | 17349 | 178.81 | 485 | 471 | 94.4 |
| C | 15 | 214 | 188996 | 1691.32 | 477 | 479 | 111.5 |
| C | 9 | 54 | 55361 | 492.38 | 477 | 479 | 111.5 |
| C | 12 | 249 | 13427 | 116.17 | 477 | 479 | 111.5 |
| D | 1 | 52 | 175133 | 1508.33 | 474 | 461 | 115.8 |
| D | 12 | 6 | 168171 | 1448.21 | 474 | 461 | 115.8 |
| D | 5 | 70 | 101244 | 870.28 | 474 | 461 | 115.8 |
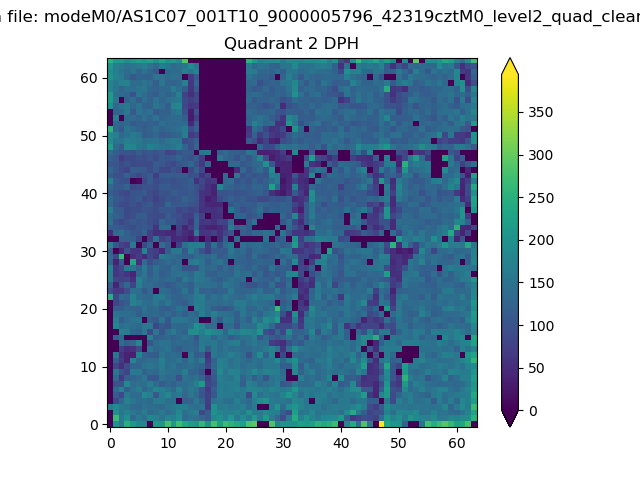
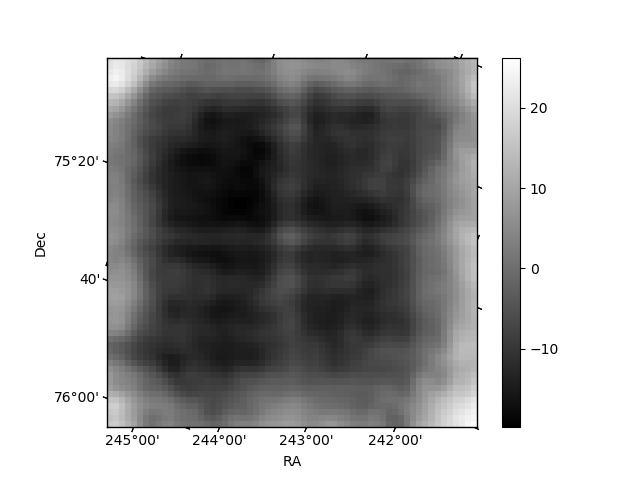
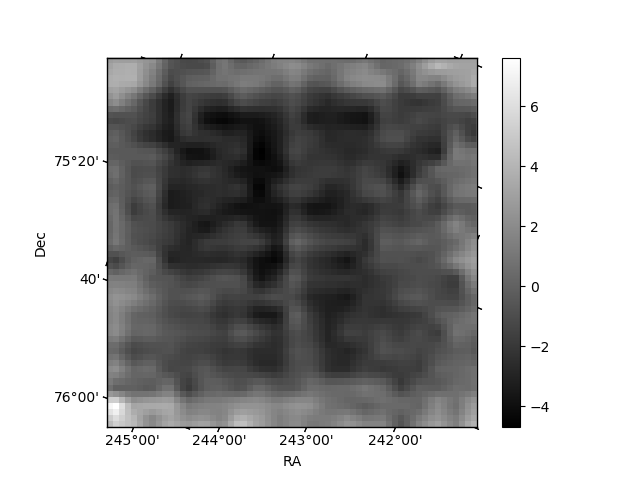
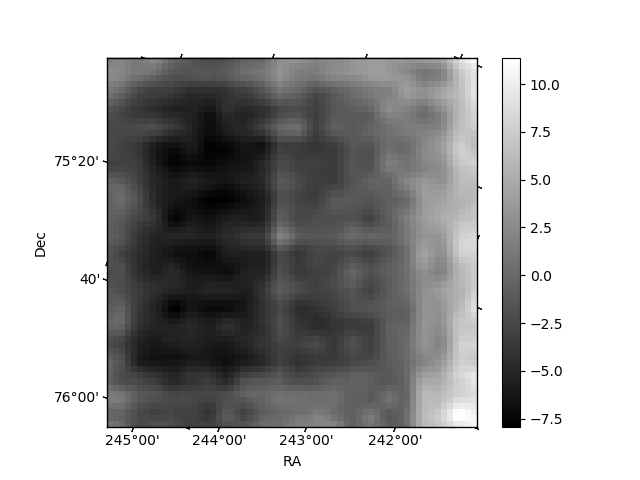
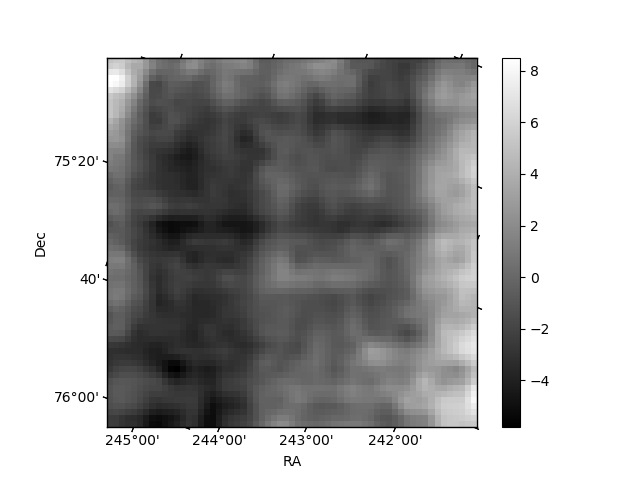
Histogram calculated using DETX and DETY for each event in the final _common_clean file
| Quadrant A | 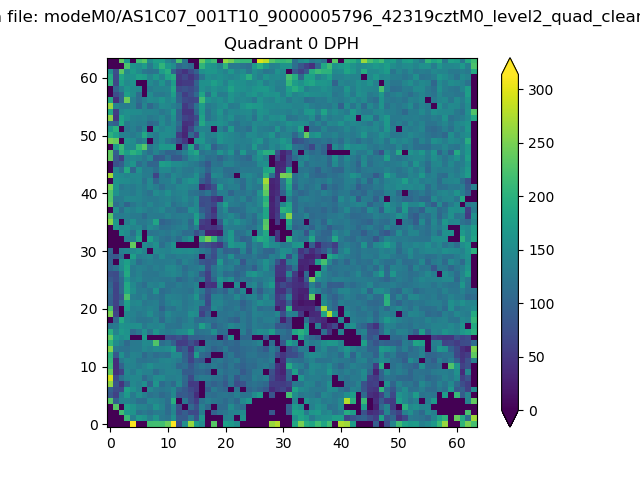 |
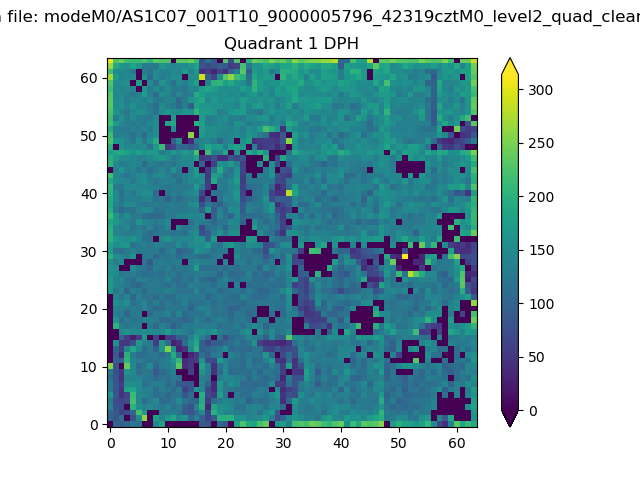 |
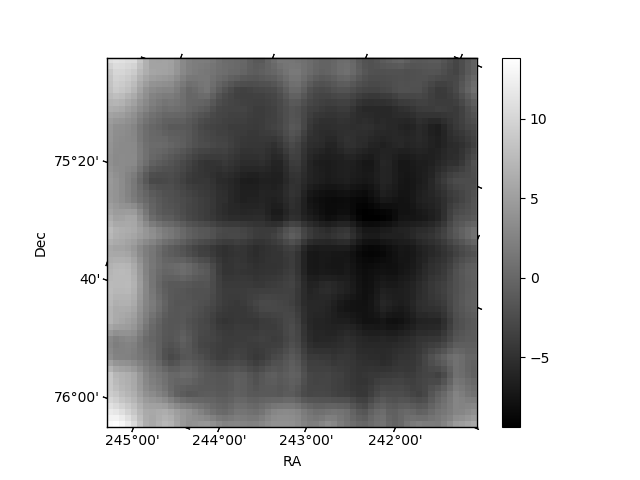
Quadrant B |
|---|---|---|---|
| Quadrant D | 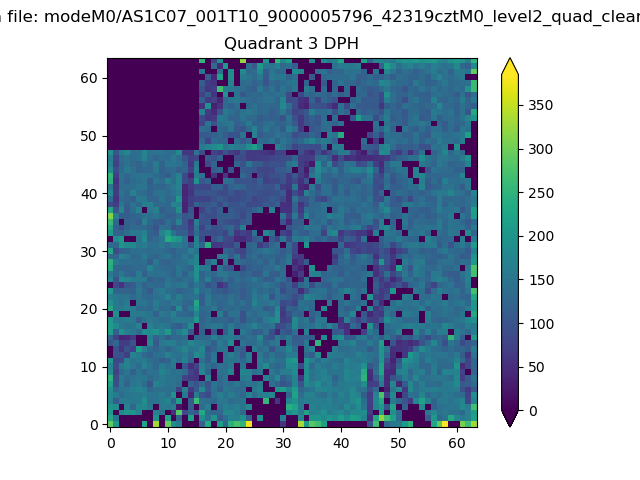 |
 |
Quadrant C |
| Plot type | Count rate plots | Images |
|---|---|---|
| Comparison with Poisson distribution Blue bars denote a histogram of data divided into 1 sec bins. Red curve is a Poisson curve with rate = median count rate of data. |
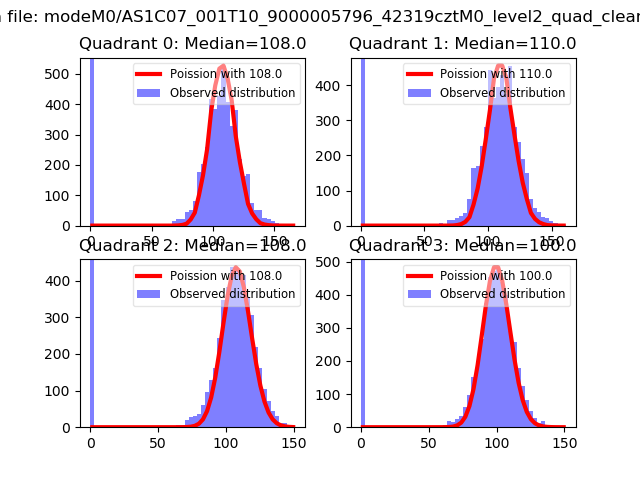 |
 |
| Quadrant-wise count rates Data is divided into 100 sec bins |
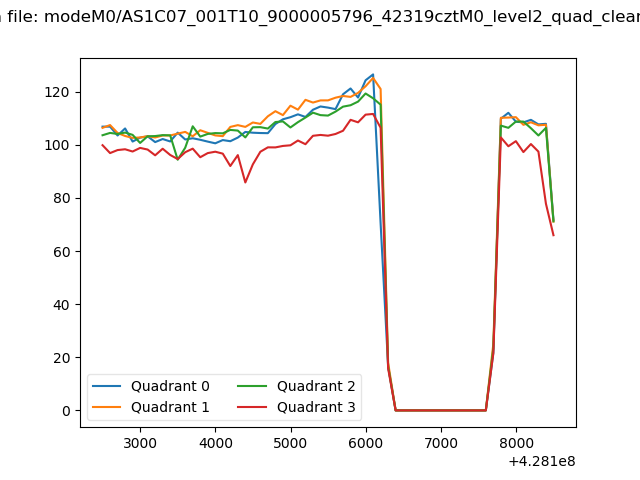 |
|
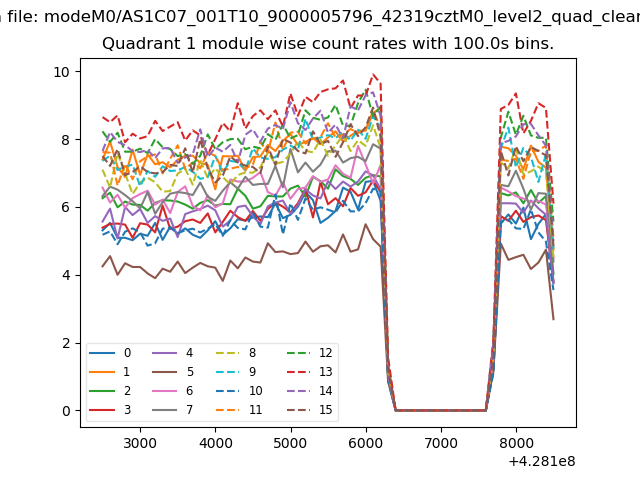
| Module-wise count rates for Quadrant A Data is divided into 100 sec bins |
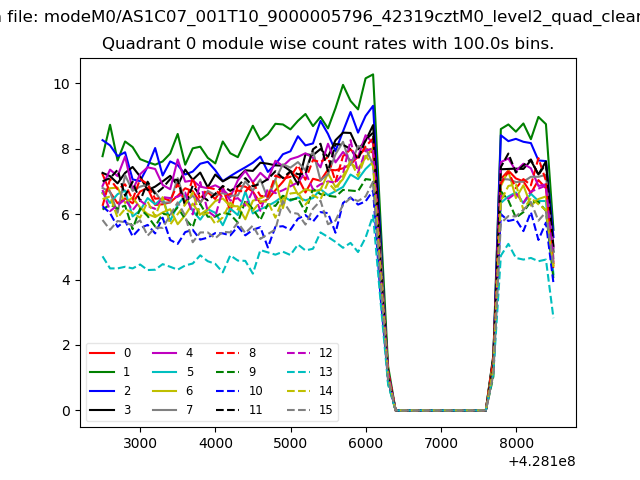 |
 |
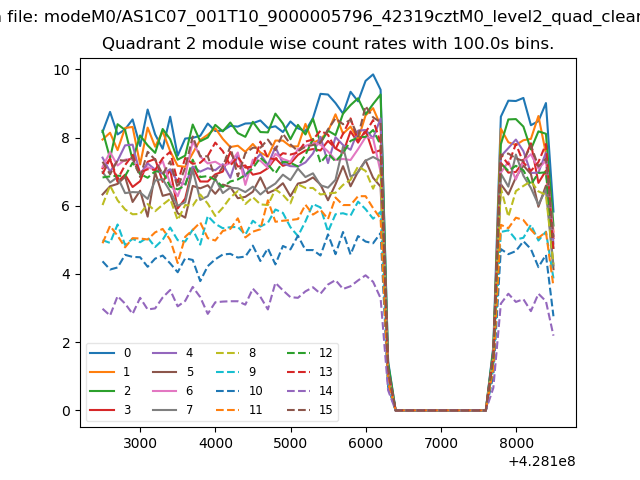
| Module-wise count rates for Quadrant B Data is divided into 100 sec bins |
 |
 |
| Module-wise count rates for Quadrant C Data is divided into 100 sec bins |
 |
 |
| Module-wise count rates for Quadrant D Data is divided into 100 sec bins |
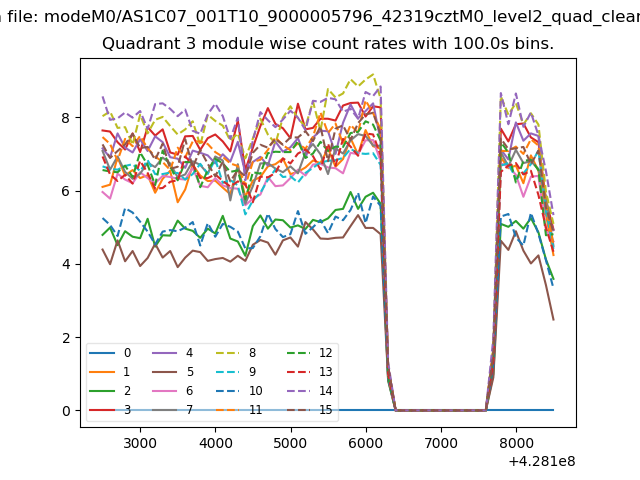 |
 |
| Parameter | Plot |
|---|---|
| CZT HV Monitor | 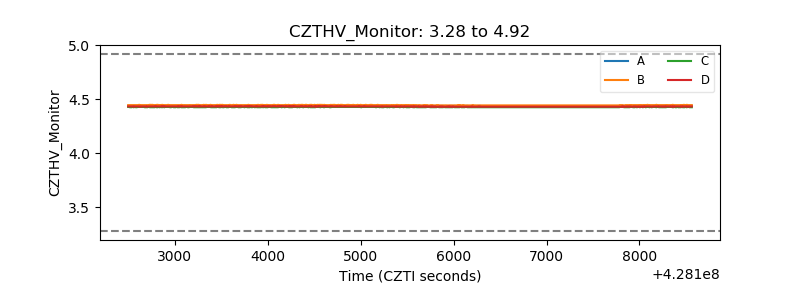 |
| D_VDD | 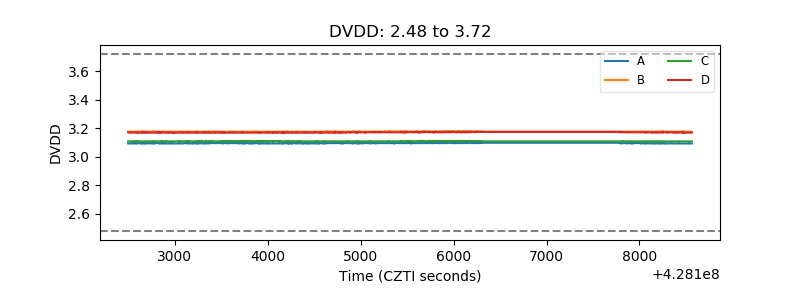 |
| Temperature 1 | 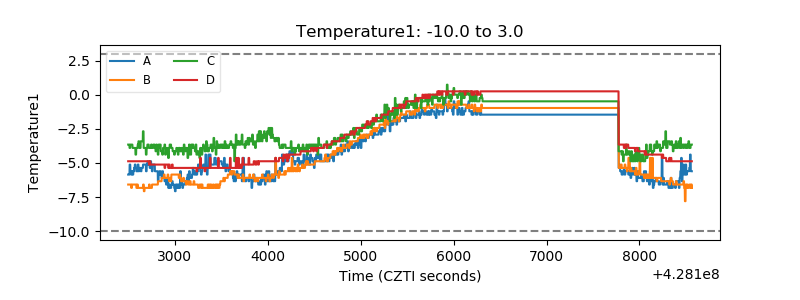 |
| Veto HV Monitor | 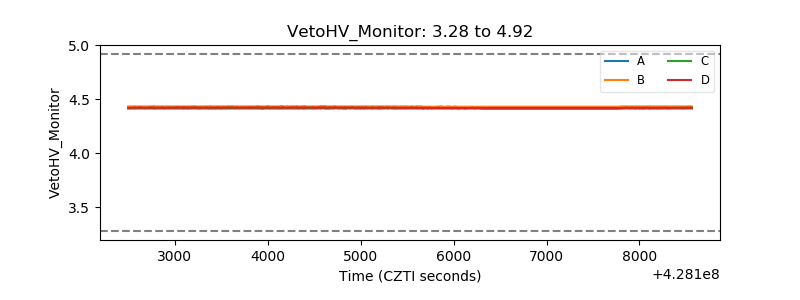 |
| Veto LLD | 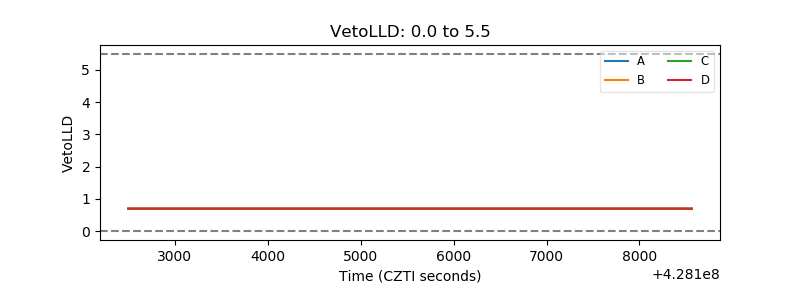 |
| Alpha Counter | 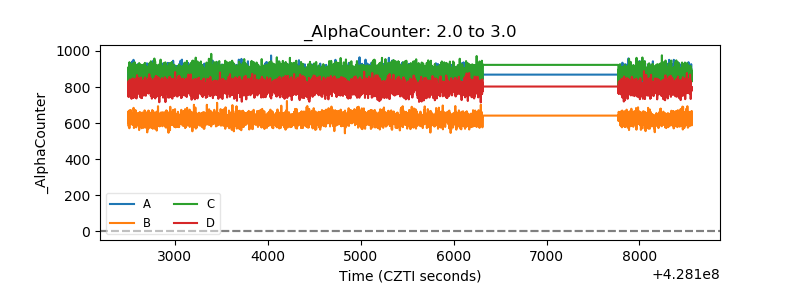 |
| _CPM_Rate | 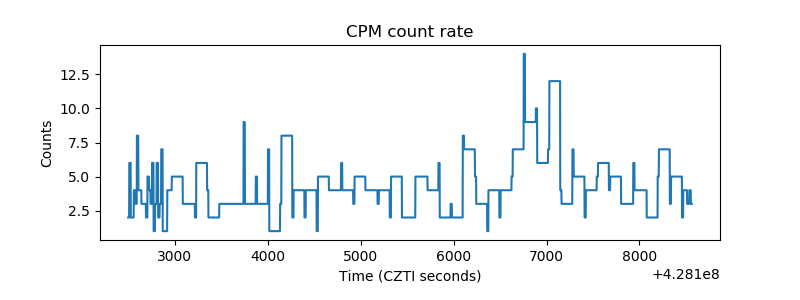 |
| CZT Counter | 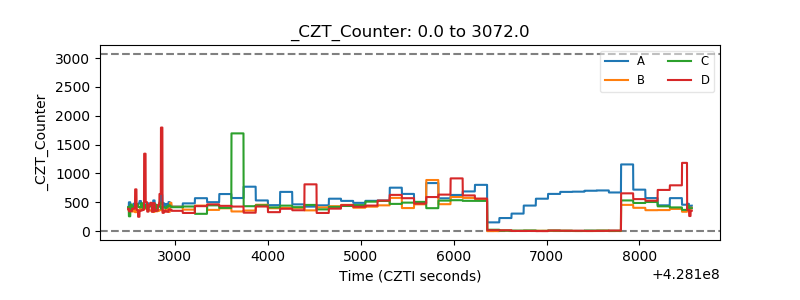 |
| +2.5 Volts monitor | 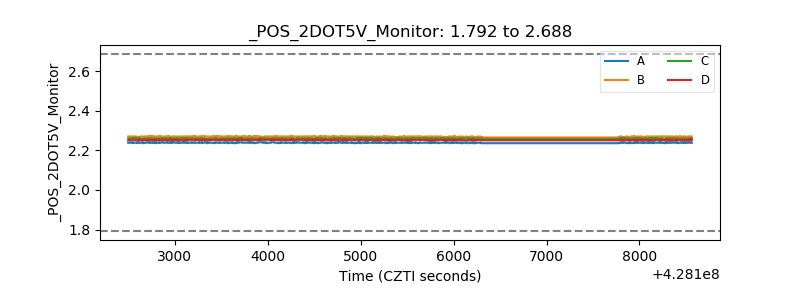 |
| +5 Volts monitor | 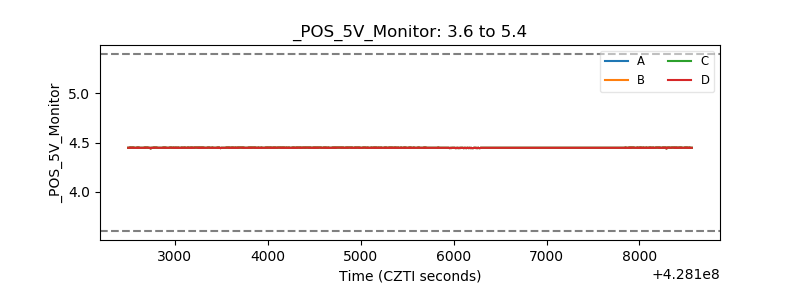 |
| _ROLL_ROT | 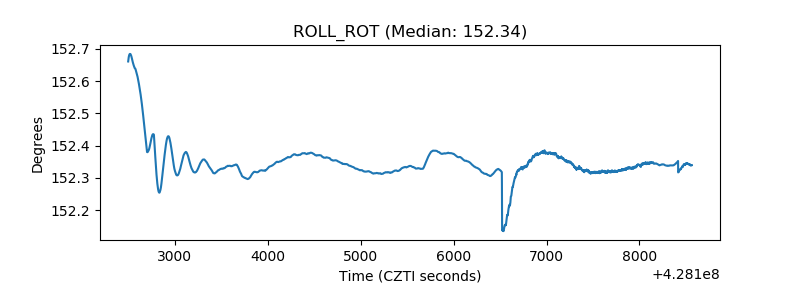 |
| _Roll_DEC | 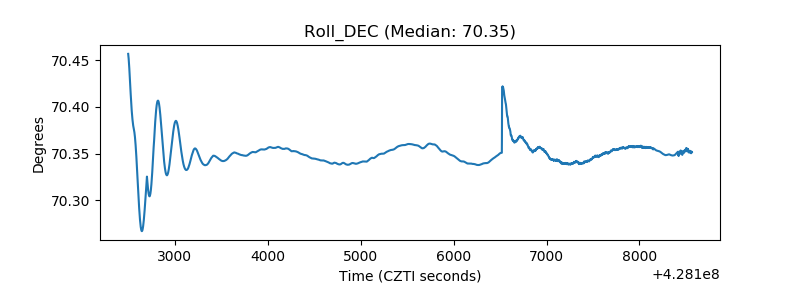 |
| _Roll_RA | 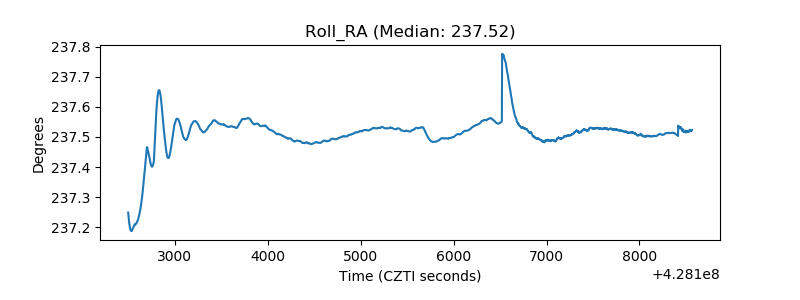 |
| Veto Counter | 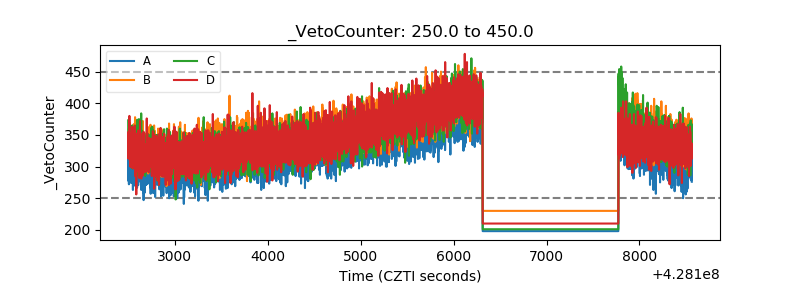 |