| Param | Original file | Final file |
|---|---|---|
| Filename | modeM0/AS1C07_001T10_9000005796_42323cztM0_level2.fits | modeM0/AS1C07_001T10_9000005796_42323cztM0_level2_quad_clean.evt |
| Size (bytes) | 1,060,623,360 | 251,280,000 |
| Size | 1011.5 MB | 239.6 MB |
| Events in quadrant A | 13,680,693 | 1,579,459 |
| Events in quadrant B | 7,593,896 | 1,713,039 |
| Events in quadrant C | 7,410,663 | 1,681,395 |
| Events in quadrant D | 9,331,443 | 1,524,810 |
| Mode M0 | |||
|---|---|---|---|
| Quadrant | BADHDUFLAG | Total packets | Discarded packets |
| A | 0 | 51370 | 4 |
| B | 0 | 34030 | 4 |
| C | 0 | 32514 | 4 |
| D | 0 | 39446 | 4 |
| Mode SS | |||
|---|---|---|---|
| Quadrant | BADHDUFLAG | Total packets | Discarded packets |
| A | 0 | 330 | 0 |
| B | 0 | 330 | 0 |
| C | 0 | 330 | 0 |
| D | 0 | 330 | 0 |
| Mode M9 | |||
|---|---|---|---|
| Quadrant | BADHDUFLAG | Total packets | Discarded packets |
| A | 0 | 54 | 0 |
| B | 0 | 54 | 0 |
| C | 0 | 54 | 0 |
| D | 0 | 54 | 0 |
| Quadrant | Total seconds | Saturated seconds | Saturation percentage |
|---|---|---|---|
| A | 16072 | 1031 | 6.414883% |
| B | 16072 | 113 | 0.703086% |
| C | 16072 | 21 | 0.130662% |
| D | 16072 | 440 | 2.737680% |
Noise dominated data is calculated using 1-second bins in cleaned event files. If a bin has >2000 counts, and if more than 50% of those come from <1% of pixels, then it is considered to be noise-dominated and hence unusable.
| Quadrant | # 1 sec bins | Bins with >0 counts | Bins with >2000 counts | High rate bins dominated by noise | Noise dominated (total time) | Noise dominated (detector-on time) | Marked lightcurve |
|---|---|---|---|---|---|---|---|
| A | 21471 | 16076 | 887 | 887 | 4.13% | 5.52% | 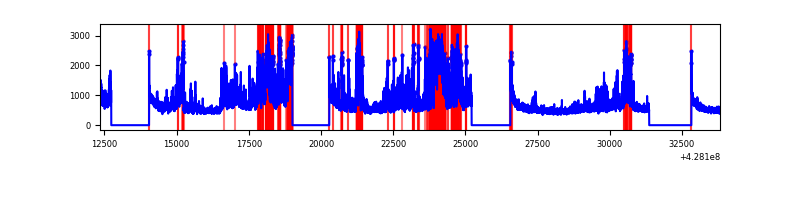 |
| B | 21471 | 16076 | 78 | 78 | 0.36% | 0.49% | 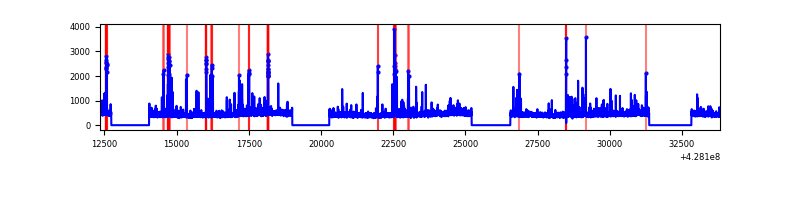 |
| C | 21471 | 16076 | 6 | 6 | 0.03% | 0.04% | 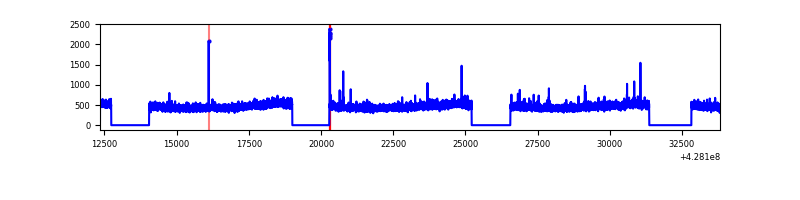 |
| D | 21471 | 16076 | 391 | 391 | 1.82% | 2.43% | 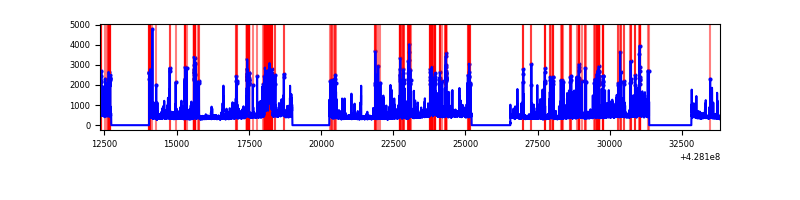 |
Top three noisy pixels from each quadrant. If the there are fewer than three noisy pixels in the level2.evt file, extra rows are filled as -1
| Pixel properties | Quadrant properties | ||||||
|---|---|---|---|---|---|---|---|
| Quadrant | DetID | PixID | Counts | Sigma | Mean | Median | Sigma |
| A | 15 | 223 | 5417180 | 15565.19 | 1709 | 1669 | 347.9 |
| A | 10 | 83 | 1556989 | 4470.28 | 1709 | 1669 | 347.9 |
| A | 15 | 252 | 40216 | 110.79 | 1709 | 1669 | 347.9 |
| B | 5 | 255 | 250953 | 760.94 | 1726 | 1678 | 327.6 |
| B | 5 | 172 | 217166 | 657.81 | 1726 | 1678 | 327.6 |
| B | 3 | 112 | 119341 | 359.18 | 1726 | 1678 | 327.6 |
| C | 15 | 214 | 680355 | 1728.53 | 1702 | 1712 | 392.6 |
| C | 9 | 54 | 28469 | 68.15 | 1702 | 1712 | 392.6 |
| C | 15 | 159 | 27758 | 66.34 | 1702 | 1712 | 392.6 |
| D | 1 | 52 | 761583 | 1849.59 | 1696 | 1648 | 410.9 |
| D | 5 | 32 | 322160 | 780.09 | 1696 | 1648 | 410.9 |
| D | 12 | 233 | 265374 | 641.88 | 1696 | 1648 | 410.9 |
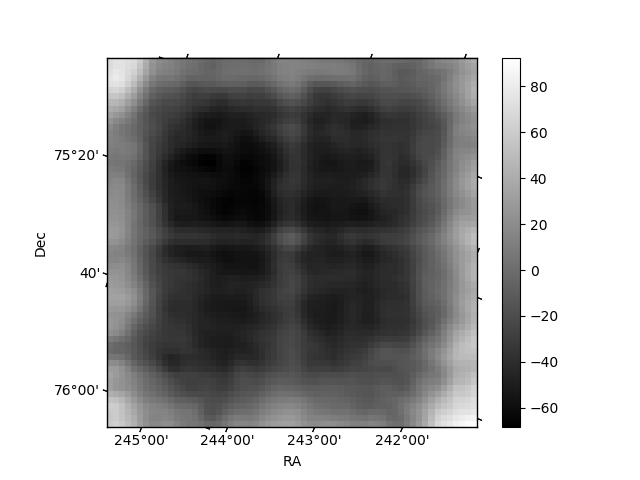
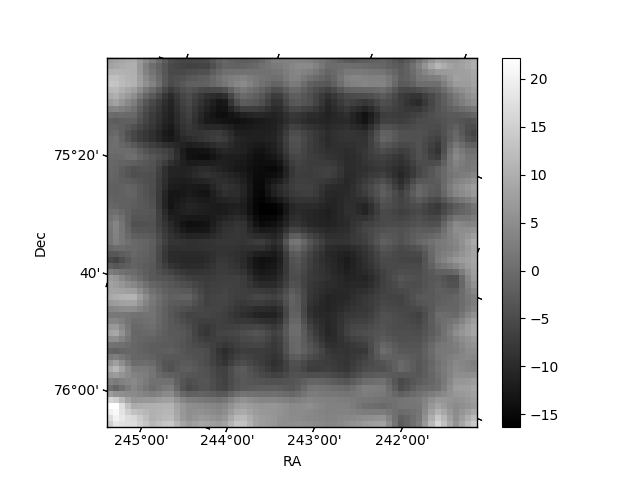
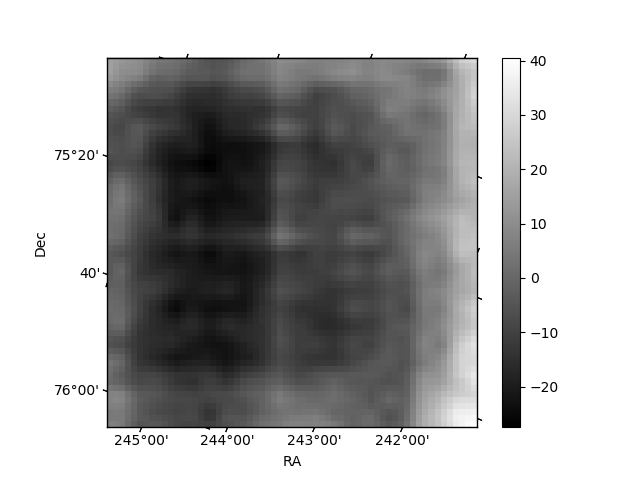
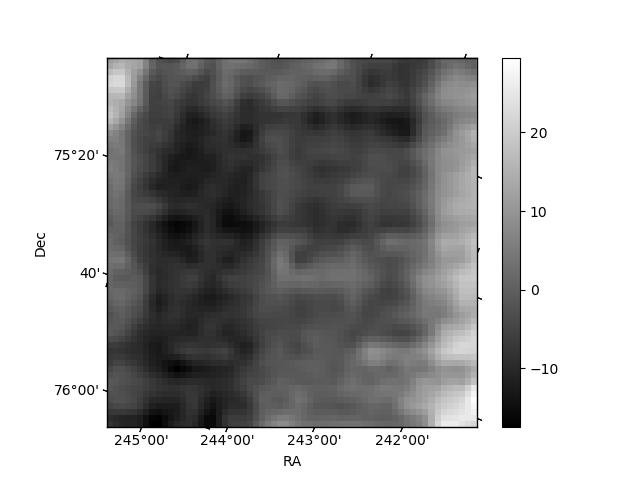
Histogram calculated using DETX and DETY for each event in the final _common_clean file
| Quadrant A | 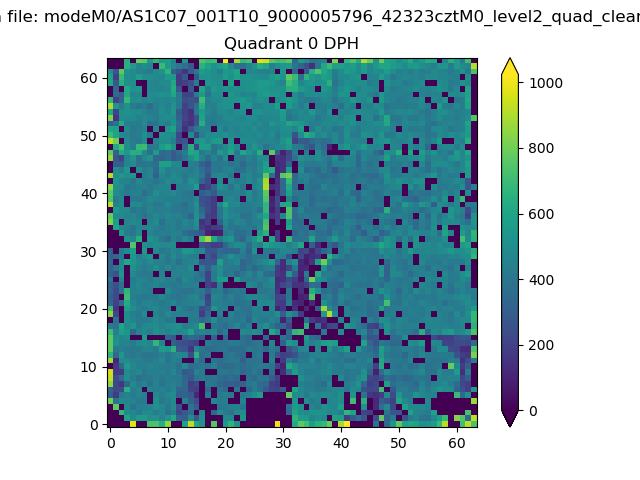 |
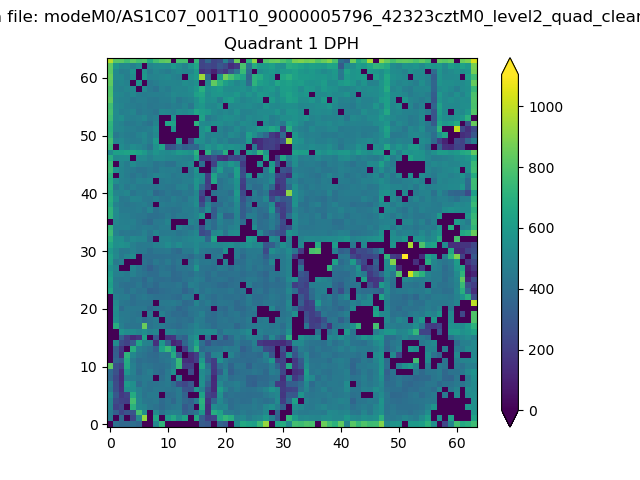 |
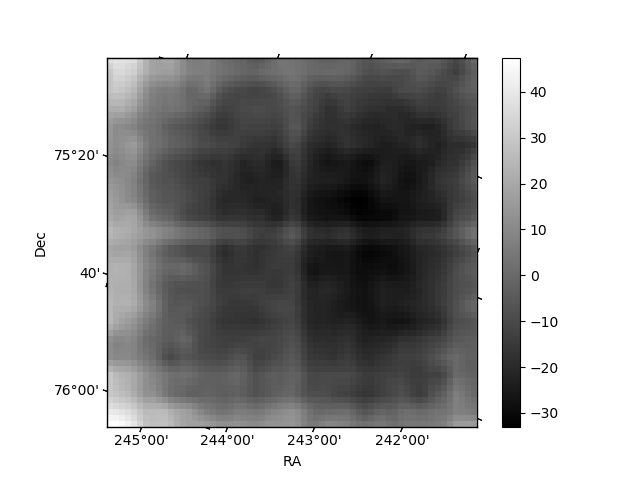
Quadrant B |
|---|---|---|---|
| Quadrant D | 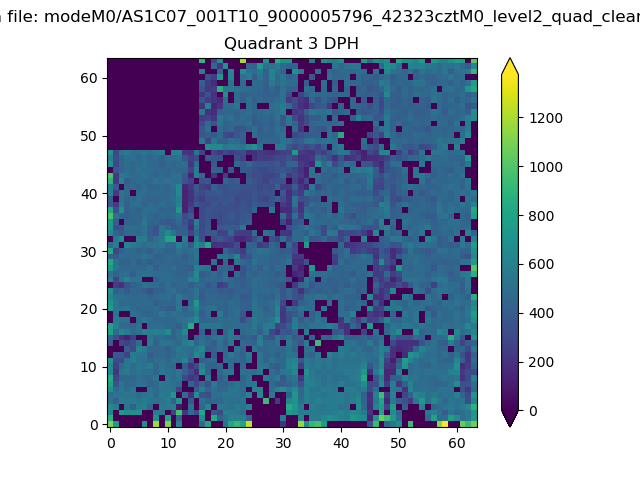 |
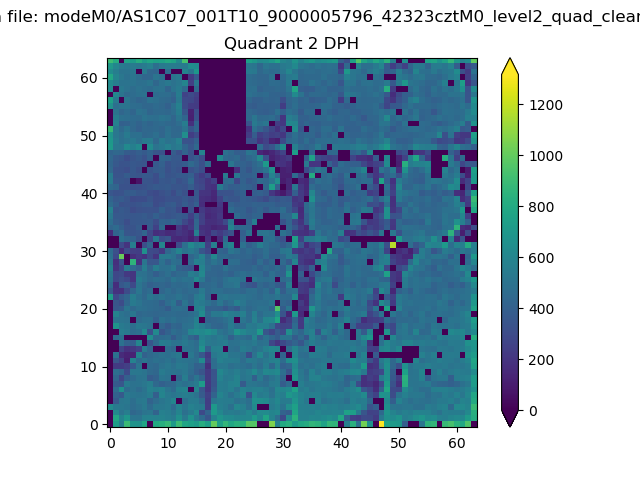 |
Quadrant C |
| Plot type | Count rate plots | Images |
|---|---|---|
| Comparison with Poisson distribution Blue bars denote a histogram of data divided into 1 sec bins. Red curve is a Poisson curve with rate = median count rate of data. |
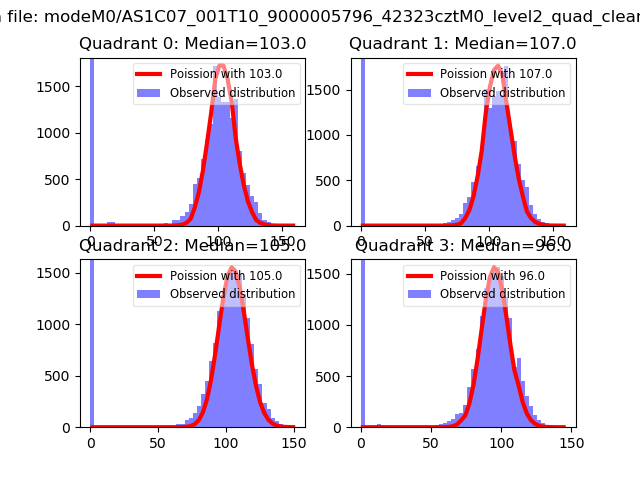 |
 |
| Quadrant-wise count rates Data is divided into 100 sec bins |
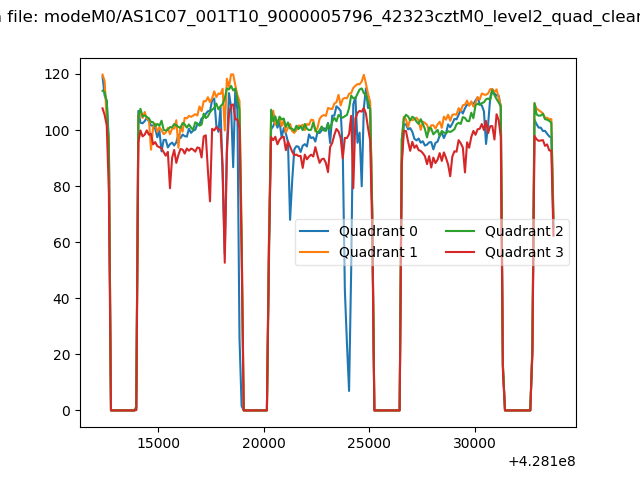 |
|
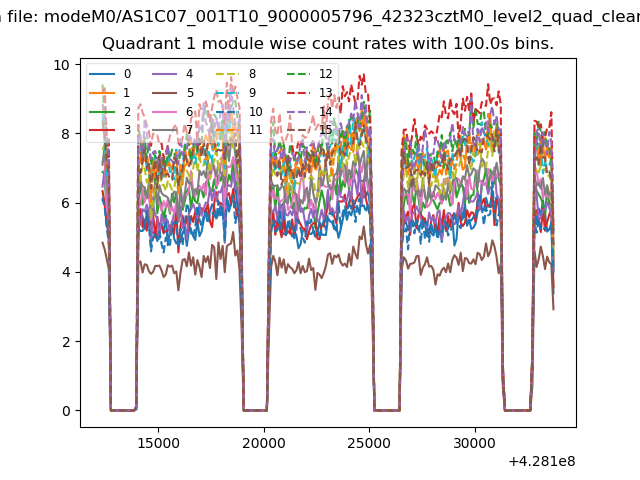
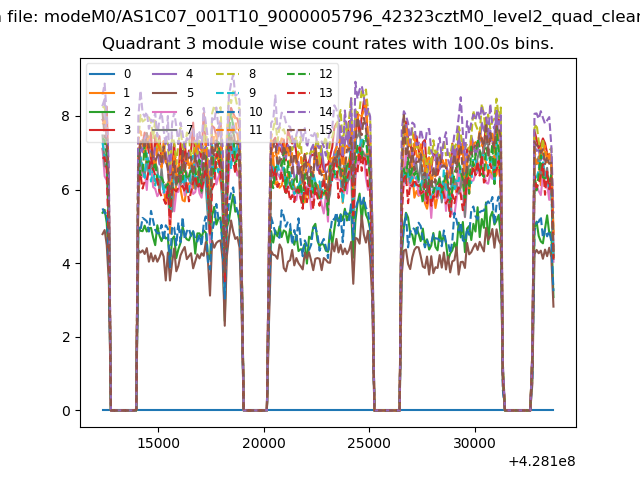
| Module-wise count rates for Quadrant A Data is divided into 100 sec bins |
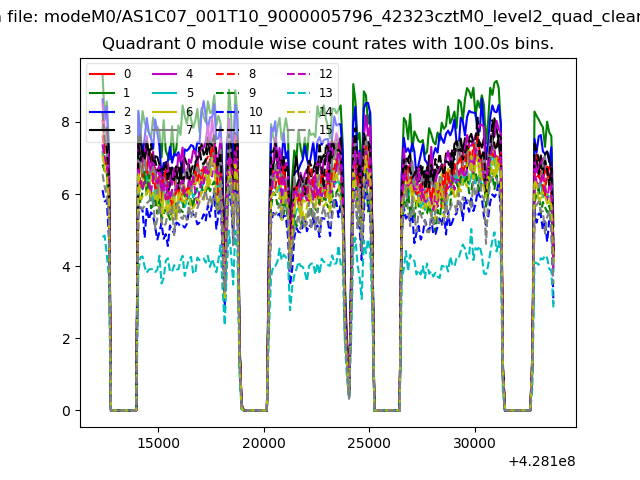 |
 |
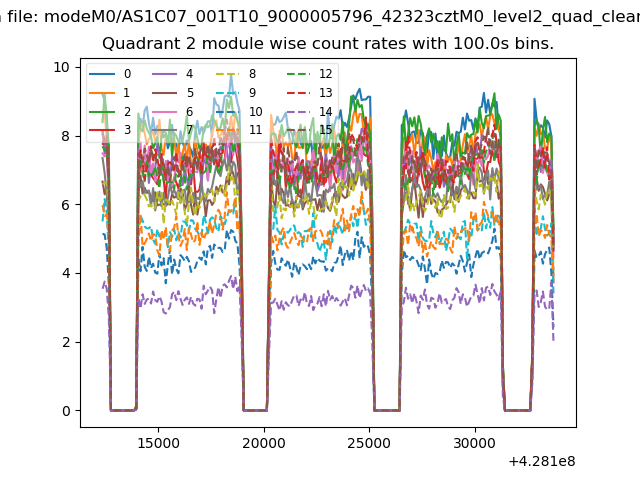
| Module-wise count rates for Quadrant B Data is divided into 100 sec bins |
 |
 |
| Module-wise count rates for Quadrant C Data is divided into 100 sec bins |
 |
 |
| Module-wise count rates for Quadrant D Data is divided into 100 sec bins |
 |
 |
| Parameter | Plot |
|---|---|
| CZT HV Monitor | 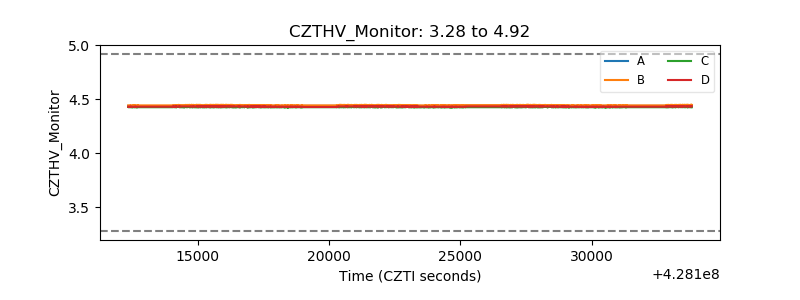 |
| D_VDD | 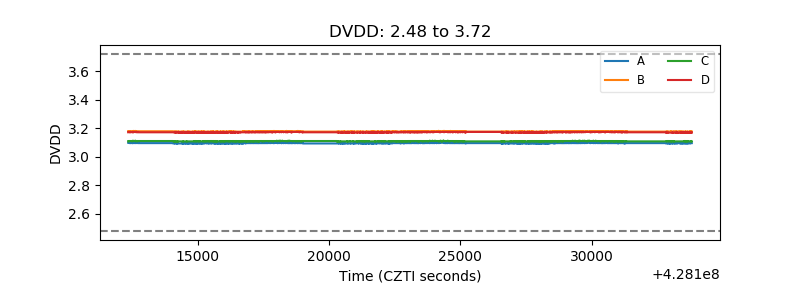 |
| Temperature 1 | 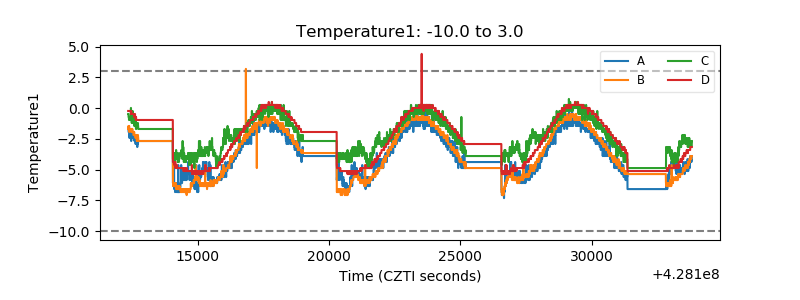 |
| Veto HV Monitor | 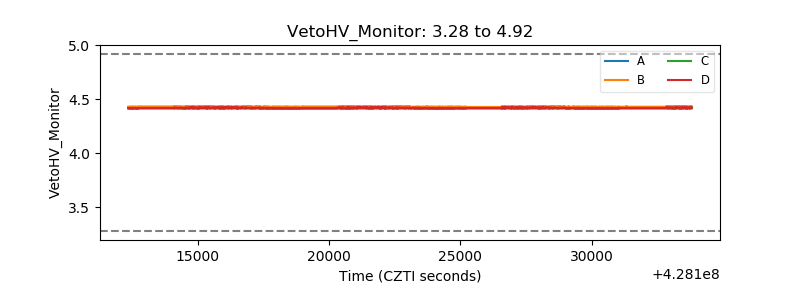 |
| Veto LLD | 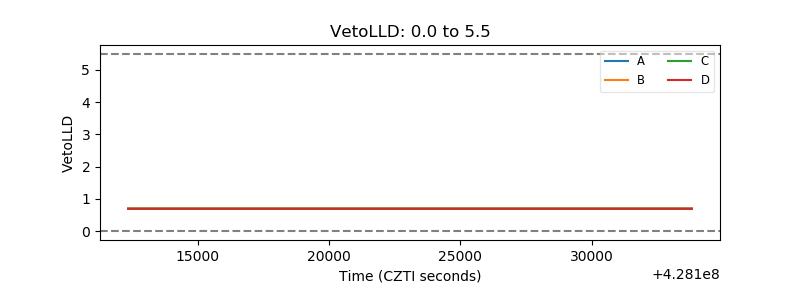 |
| Alpha Counter | 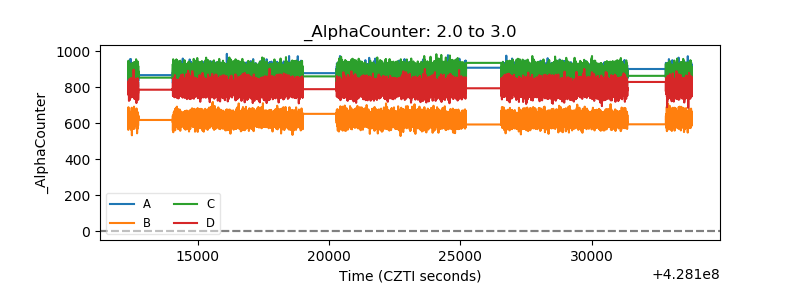 |
| _CPM_Rate | 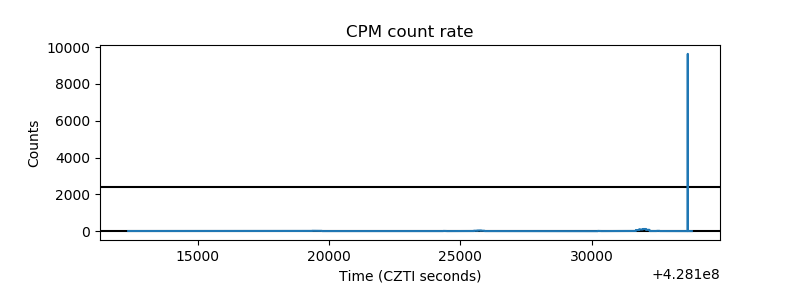 |
| CZT Counter | 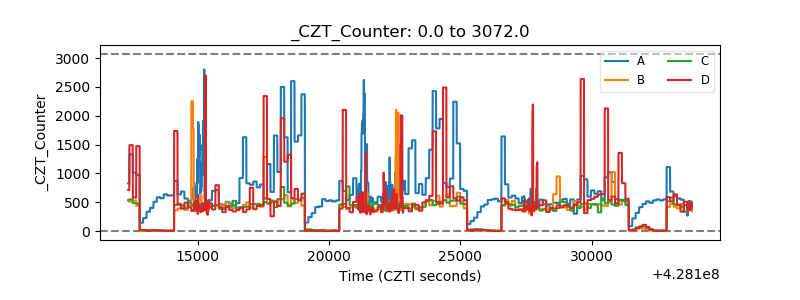 |
| +2.5 Volts monitor | 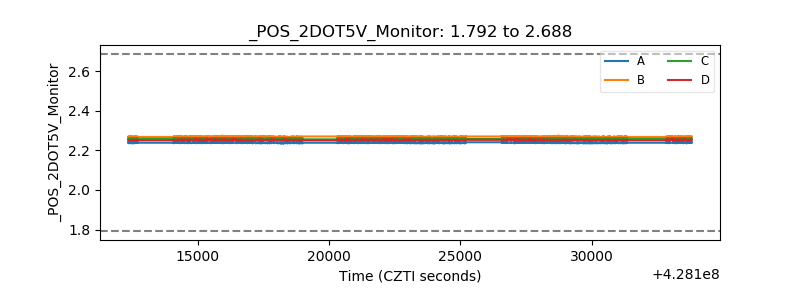 |
| +5 Volts monitor | 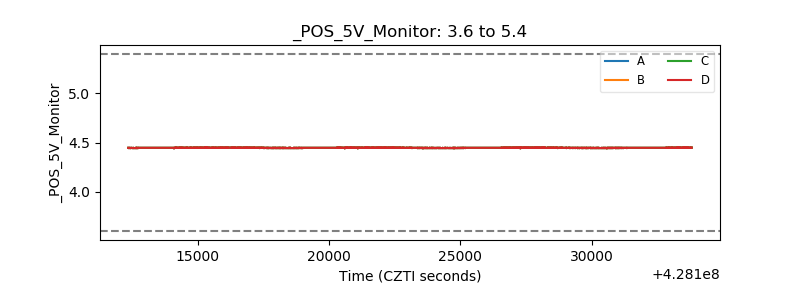 |
| _ROLL_ROT | 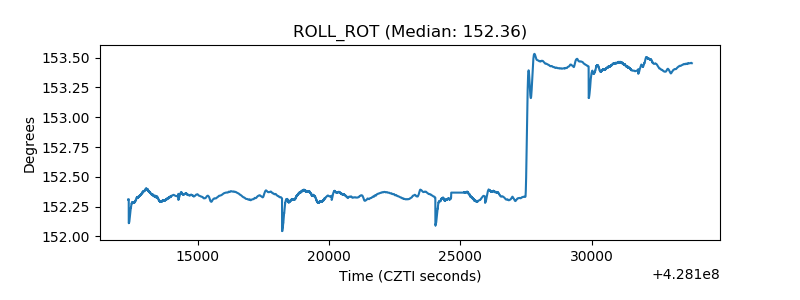 |
| _Roll_DEC | 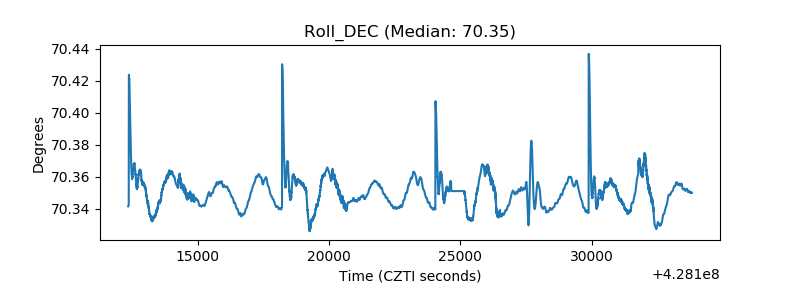 |
| _Roll_RA | 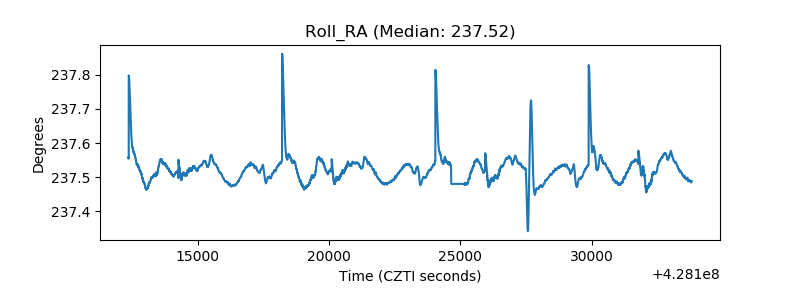 |
| Veto Counter | 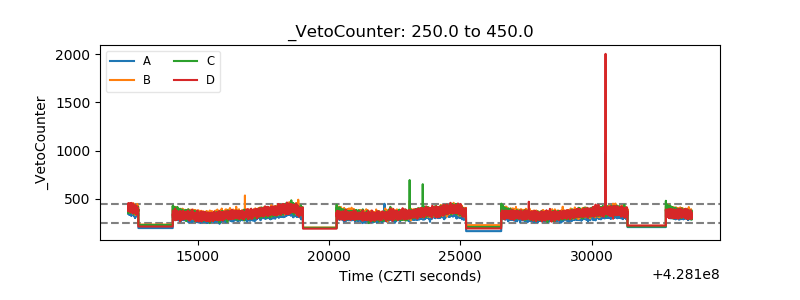 |