| Param | Original file | Final file |
|---|---|---|
| Filename | modeM0/AS1C07_001T10_9000005796_42325cztM0_level2.fits | modeM0/AS1C07_001T10_9000005796_42325cztM0_level2_quad_clean.evt |
| Size (bytes) | 333,109,440 | 89,020,800 |
| Size | 317.7 MB | 84.9 MB |
| Events in quadrant A | 3,202,410 | 598,739 |
| Events in quadrant B | 2,497,128 | 608,279 |
| Events in quadrant C | 2,530,652 | 582,831 |
| Events in quadrant D | 3,678,620 | 526,116 |
| Mode M0 | |||
|---|---|---|---|
| Quadrant | BADHDUFLAG | Total packets | Discarded packets |
| A | 0 | 12759 | 2 |
| B | 0 | 11213 | 2 |
| C | 0 | 11026 | 2 |
| D | 0 | 14679 | 3 |
| Mode SS | |||
|---|---|---|---|
| Quadrant | BADHDUFLAG | Total packets | Discarded packets |
| A | 0 | 112 | 0 |
| B | 0 | 112 | 0 |
| C | 0 | 112 | 0 |
| D | 0 | 112 | 0 |
| Mode M9 | |||
|---|---|---|---|
| Quadrant | BADHDUFLAG | Total packets | Discarded packets |
| A | 0 | 24 | 0 |
| B | 0 | 25 | 0 |
| C | 0 | 25 | 0 |
| D | 0 | 25 | 0 |
| Quadrant | Total seconds | Saturated seconds | Saturation percentage |
|---|---|---|---|
| A | 5415 | 22 | 0.406279% |
| B | 5415 | 16 | 0.295476% |
| C | 5415 | 10 | 0.184672% |
| D | 5414 | 202 | 3.731068% |
Noise dominated data is calculated using 1-second bins in cleaned event files. If a bin has >2000 counts, and if more than 50% of those come from <1% of pixels, then it is considered to be noise-dominated and hence unusable.
| Quadrant | # 1 sec bins | Bins with >0 counts | Bins with >2000 counts | High rate bins dominated by noise | Noise dominated (total time) | Noise dominated (detector-on time) | Marked lightcurve |
|---|---|---|---|---|---|---|---|
| A | 7148 | 5416 | 5 | 5 | 0.07% | 0.09% | 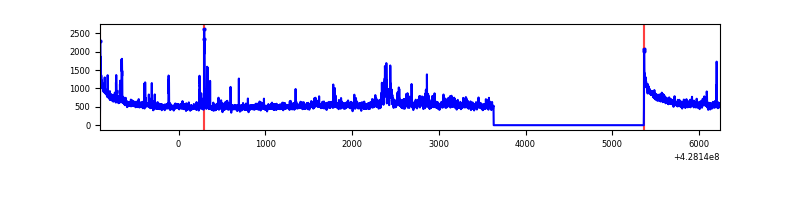 |
| B | 7148 | 5416 | 6 | 6 | 0.08% | 0.11% | 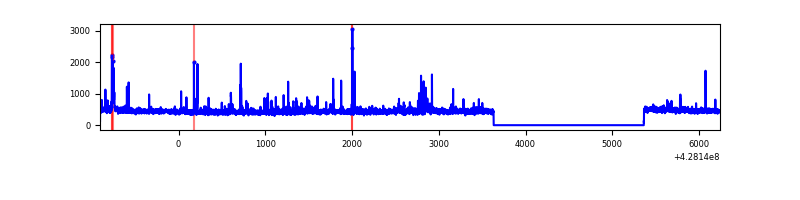 |
| C | 7148 | 5416 | 2 | 2 | 0.03% | 0.04% | 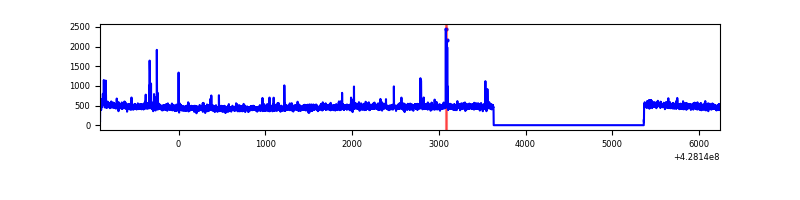 |
| D | 7147 | 5415 | 189 | 189 | 2.64% | 3.49% | 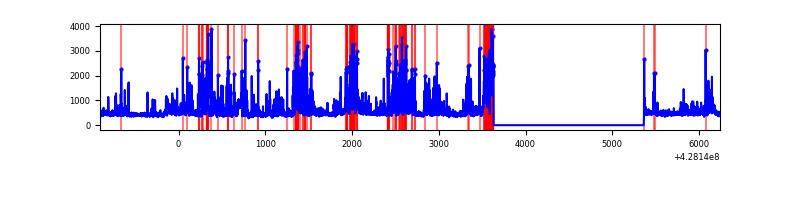 |
Top three noisy pixels from each quadrant. If the there are fewer than three noisy pixels in the level2.evt file, extra rows are filled as -1
| Pixel properties | Quadrant properties | ||||||
|---|---|---|---|---|---|---|---|
| Quadrant | DetID | PixID | Counts | Sigma | Mean | Median | Sigma |
| A | 10 | 83 | 608009 | 5040.32 | 591 | 579 | 120.5 |
| A | 15 | 223 | 221631 | 1834.24 | 591 | 579 | 120.5 |
| A | 10 | 255 | 39628 | 324.02 | 591 | 579 | 120.5 |
| B | 5 | 172 | 82492 | 735.08 | 584 | 569 | 111.4 |
| B | 5 | 255 | 31559 | 278.07 | 584 | 569 | 111.4 |
| B | 0 | 245 | 21541 | 188.18 | 584 | 569 | 111.4 |
| C | 15 | 214 | 232512 | 1744.82 | 573 | 577 | 132.9 |
| C | 15 | 159 | 50612 | 376.41 | 573 | 577 | 132.9 |
| C | 12 | 249 | 7602 | 52.85 | 573 | 577 | 132.9 |
| D | 1 | 52 | 609367 | 4339.01 | 571 | 552 | 140.3 |
| D | 5 | 32 | 213252 | 1515.91 | 571 | 552 | 140.3 |
| D | 13 | 249 | 210135 | 1493.69 | 571 | 552 | 140.3 |
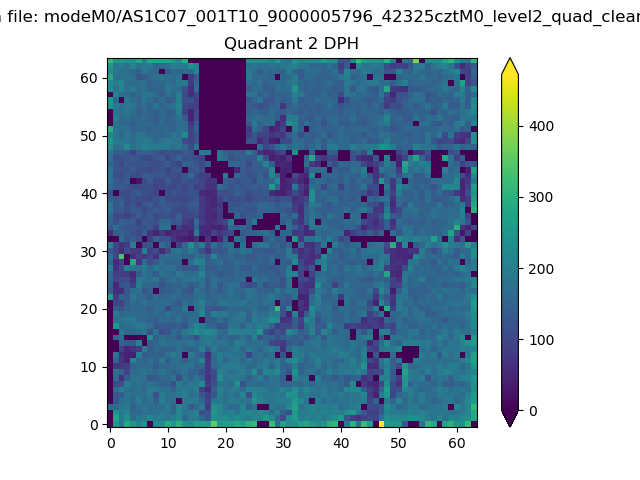
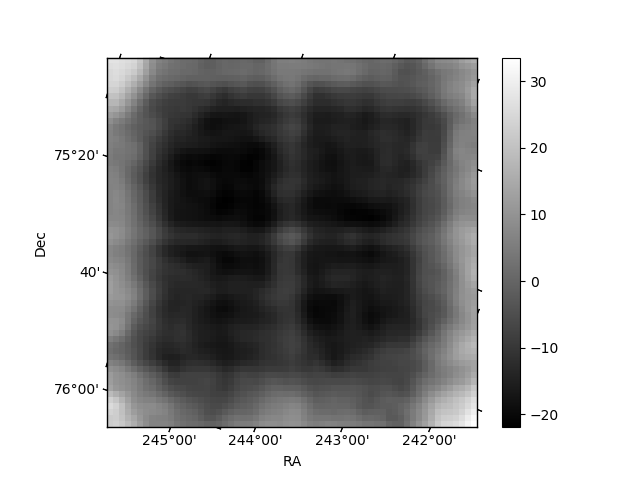
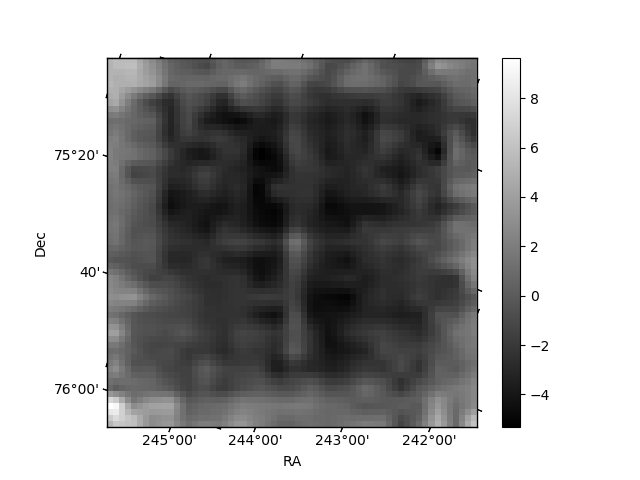
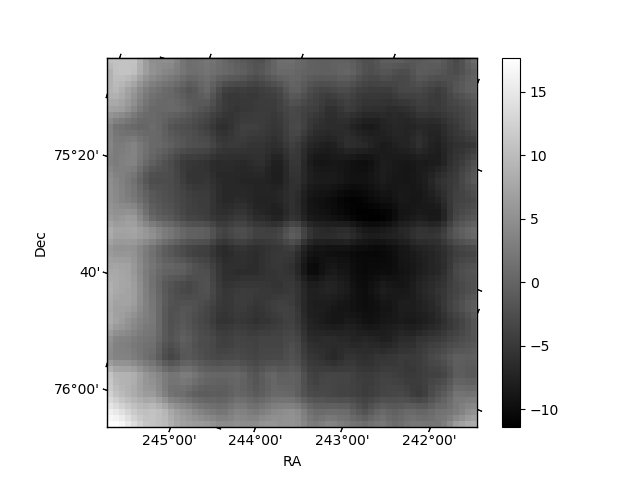
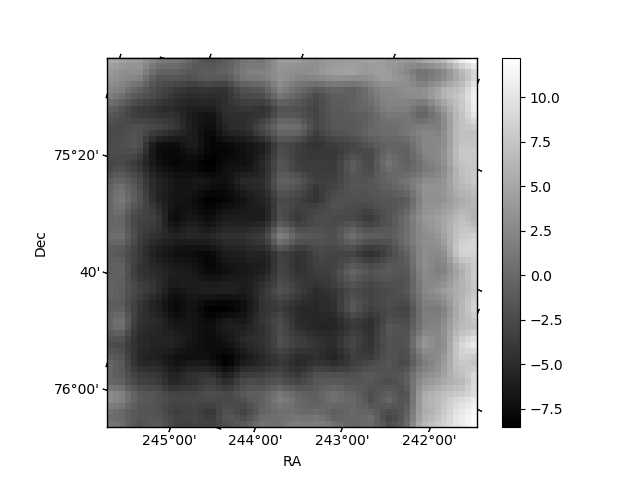
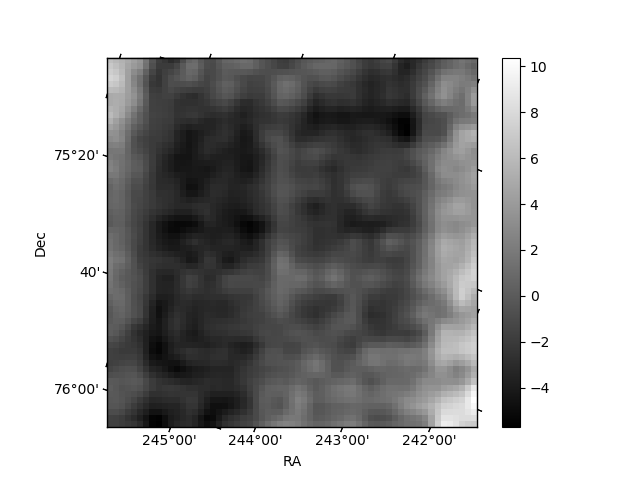
Histogram calculated using DETX and DETY for each event in the final _common_clean file
| Quadrant A | 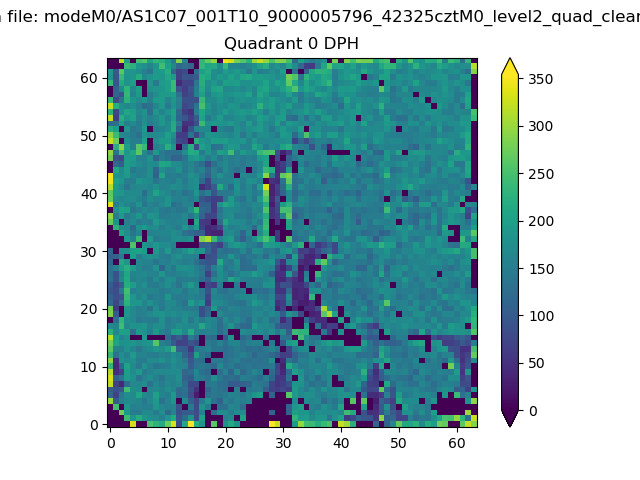 |
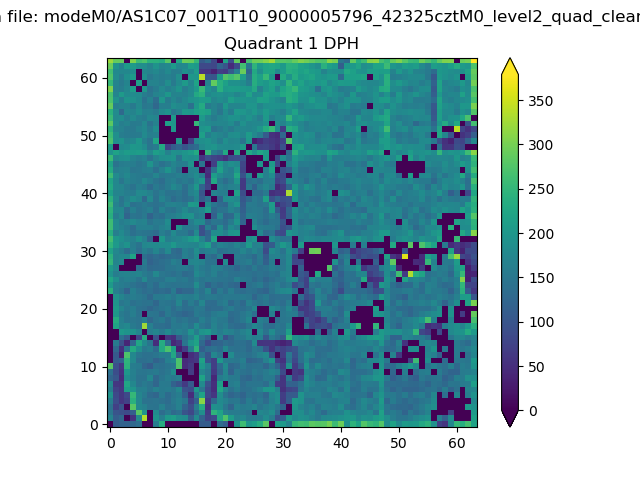 |
Quadrant B |
|---|---|---|---|
| Quadrant D | 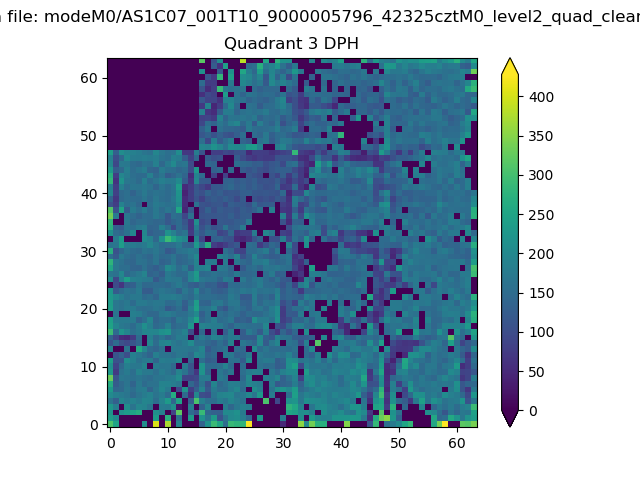 |
 |
Quadrant C |
| Plot type | Count rate plots | Images |
|---|---|---|
| Comparison with Poisson distribution Blue bars denote a histogram of data divided into 1 sec bins. Red curve is a Poisson curve with rate = median count rate of data. |
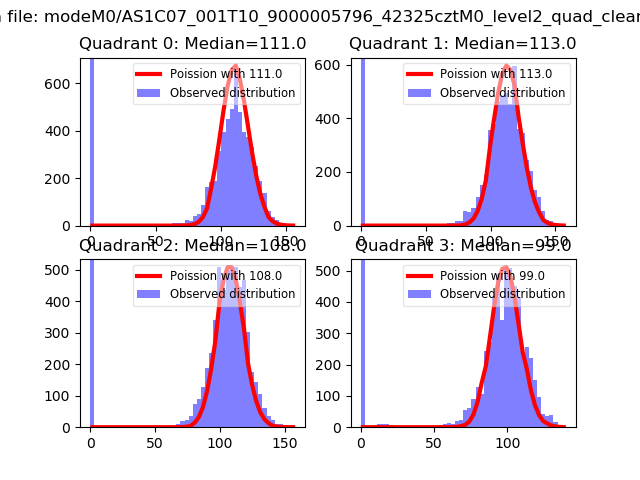 |
 |
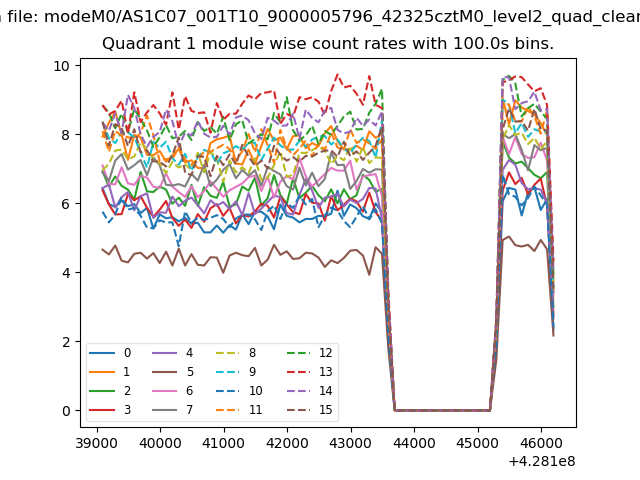
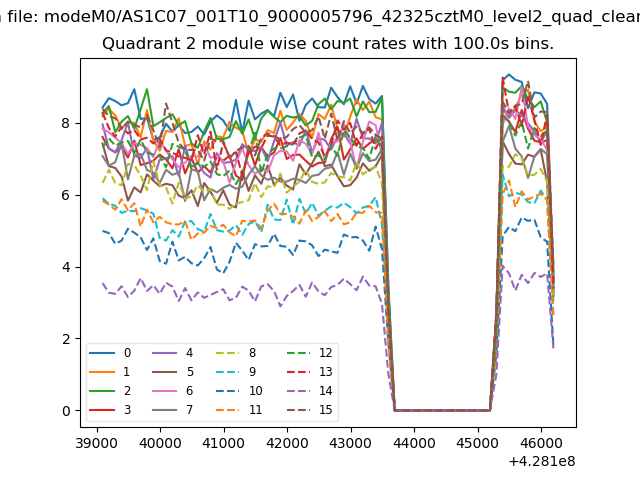
| Quadrant-wise count rates Data is divided into 100 sec bins |
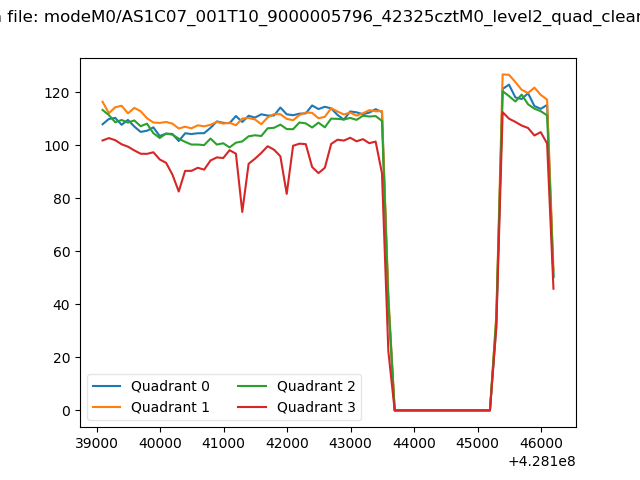 |
|
| Module-wise count rates for Quadrant A Data is divided into 100 sec bins |
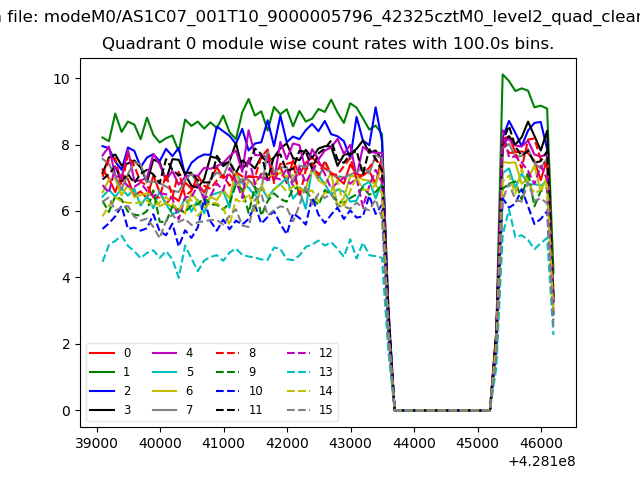 |
 |
| Module-wise count rates for Quadrant B Data is divided into 100 sec bins |
 |
 |
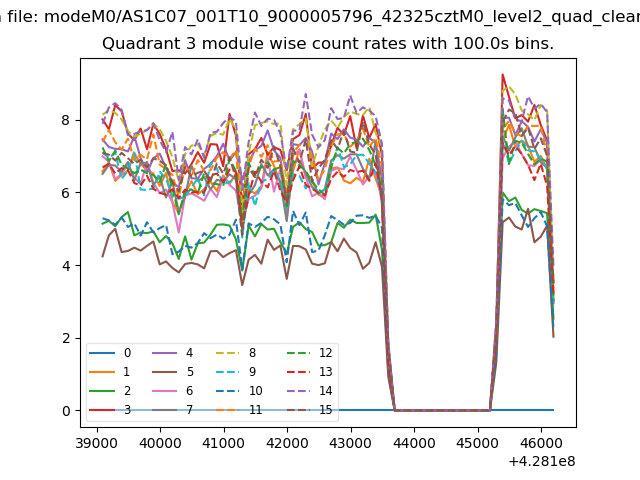
| Module-wise count rates for Quadrant C Data is divided into 100 sec bins |
 |
 |
| Module-wise count rates for Quadrant D Data is divided into 100 sec bins |
 |
 |
| Parameter | Plot |
|---|---|
| CZT HV Monitor | 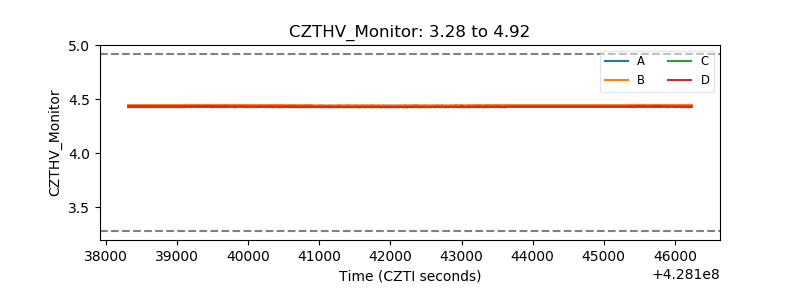 |
| D_VDD | 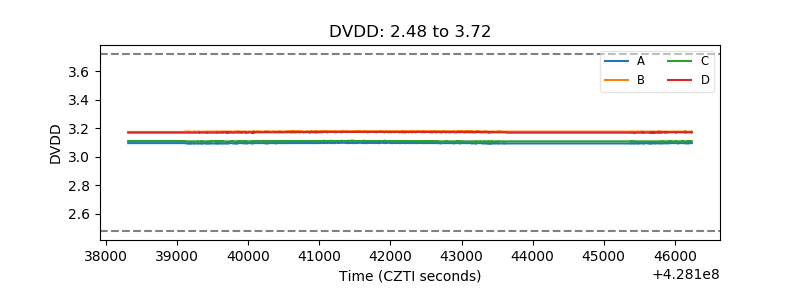 |
| Temperature 1 | 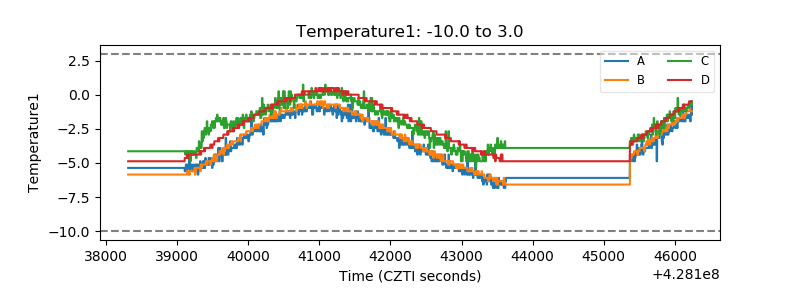 |
| Veto HV Monitor | 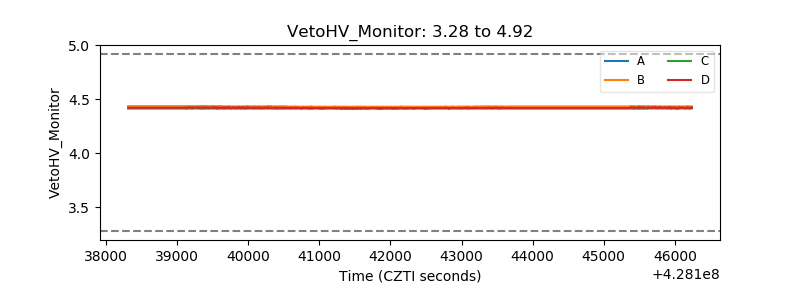 |
| Veto LLD | 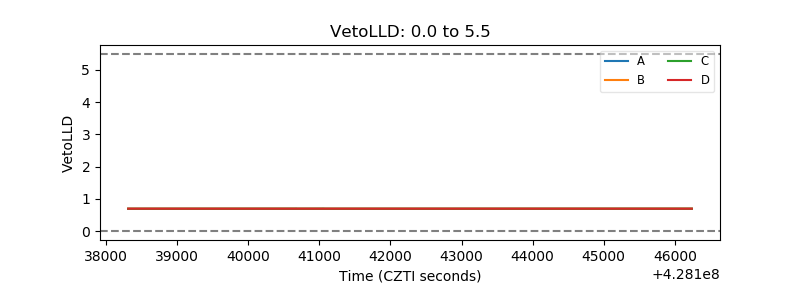 |
| Alpha Counter | 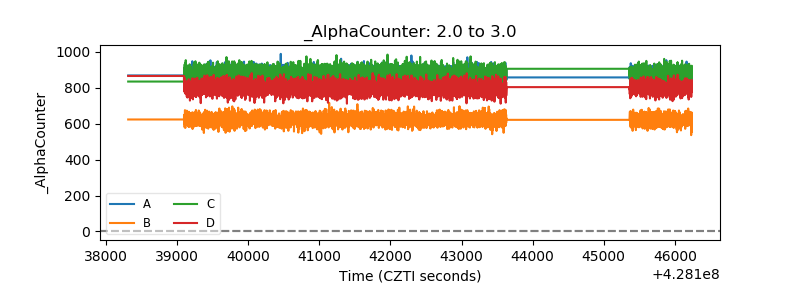 |
| _CPM_Rate | 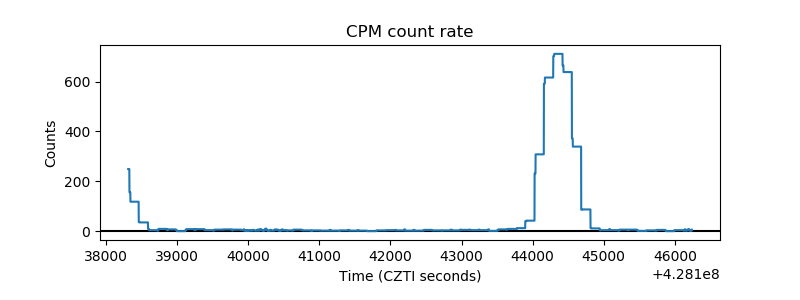 |
| CZT Counter | 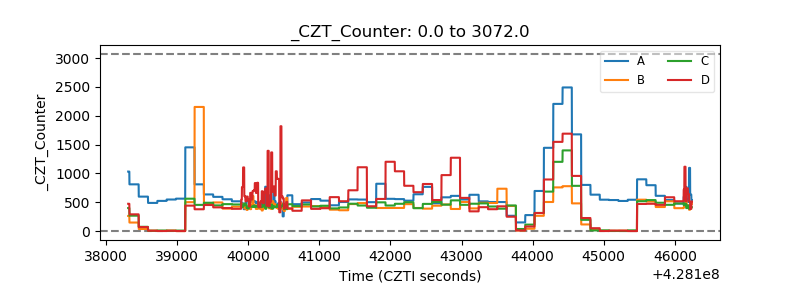 |
| +2.5 Volts monitor | 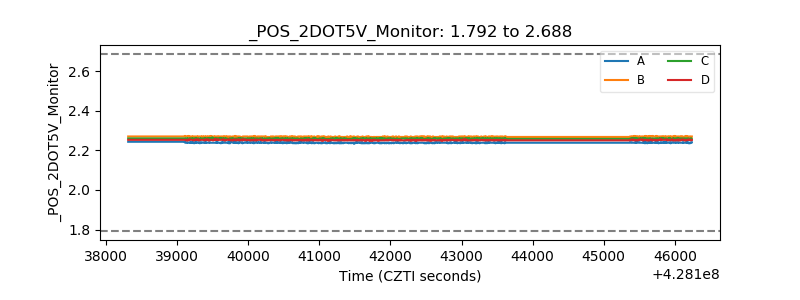 |
| +5 Volts monitor | 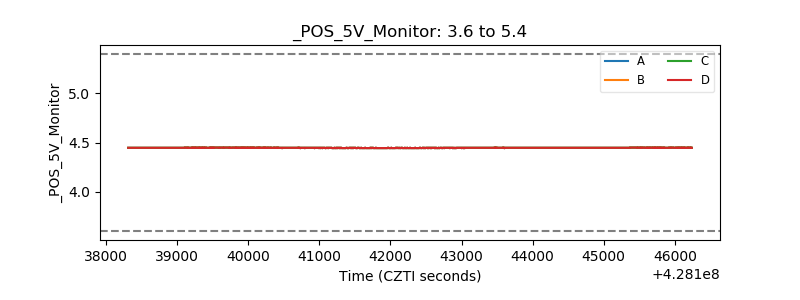 |
| _ROLL_ROT | 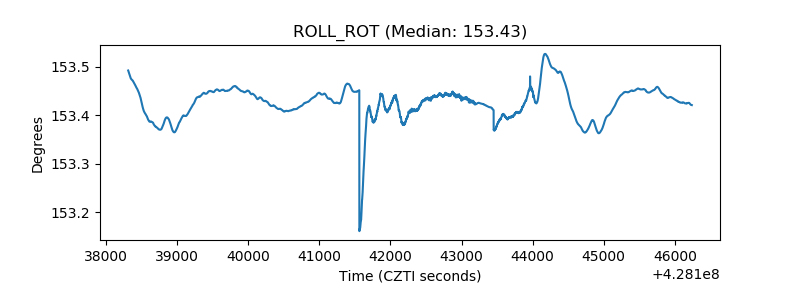 |
| _Roll_DEC | 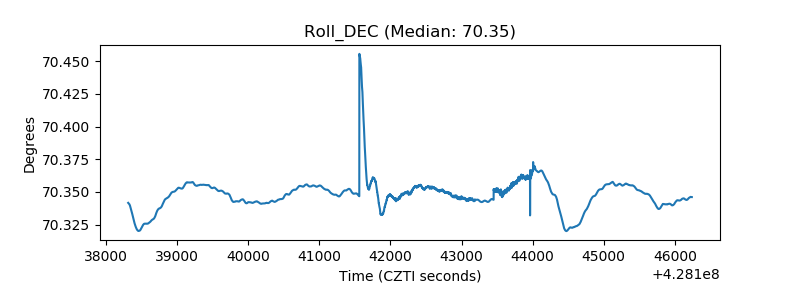 |
| _Roll_RA | 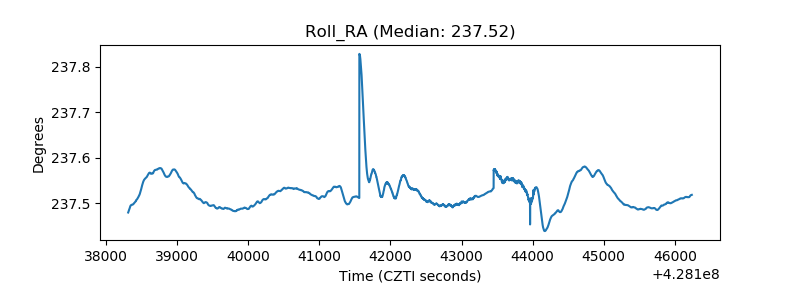 |
| Veto Counter | 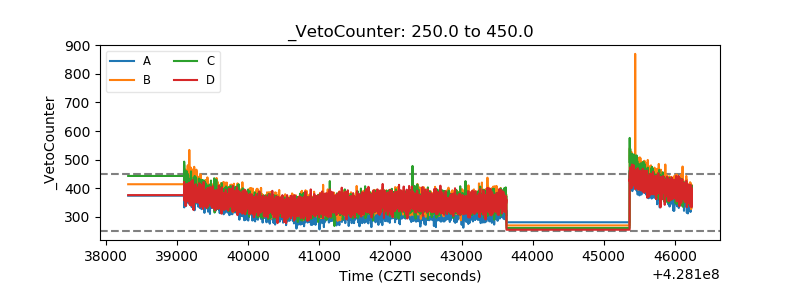 |