| Param | Original file | Final file |
|---|---|---|
| Filename | modeM0/AS1C07_001T10_9000005796_42327cztM0_level2.fits | modeM0/AS1C07_001T10_9000005796_42327cztM0_level2_quad_clean.evt |
| Size (bytes) | 349,873,920 | 92,724,480 |
| Size | 333.7 MB | 88.4 MB |
| Events in quadrant A | 3,415,740 | 633,468 |
| Events in quadrant B | 2,693,407 | 636,073 |
| Events in quadrant C | 2,527,406 | 610,863 |
| Events in quadrant D | 3,893,177 | 547,826 |
| Mode M0 | |||
|---|---|---|---|
| Quadrant | BADHDUFLAG | Total packets | Discarded packets |
| A | 0 | 13690 | 1 |
| B | 0 | 11594 | 1 |
| C | 0 | 10909 | 1 |
| D | 0 | 15226 | 1 |
| Mode SS | |||
|---|---|---|---|
| Quadrant | BADHDUFLAG | Total packets | Discarded packets |
| A | 0 | 112 | 0 |
| B | 0 | 112 | 0 |
| C | 0 | 112 | 0 |
| D | 0 | 112 | 0 |
| Mode M9 | |||
|---|---|---|---|
| Quadrant | BADHDUFLAG | Total packets | Discarded packets |
| A | 0 | 18 | 0 |
| B | 0 | 18 | 0 |
| C | 0 | 18 | 0 |
| D | 0 | 18 | 0 |
| Quadrant | Total seconds | Saturated seconds | Saturation percentage |
|---|---|---|---|
| A | 5414 | 18 | 0.332471% |
| B | 5414 | 32 | 0.591060% |
| C | 5413 | 2 | 0.036948% |
| D | 5414 | 271 | 5.005541% |
Noise dominated data is calculated using 1-second bins in cleaned event files. If a bin has >2000 counts, and if more than 50% of those come from <1% of pixels, then it is considered to be noise-dominated and hence unusable.
| Quadrant | # 1 sec bins | Bins with >0 counts | Bins with >2000 counts | High rate bins dominated by noise | Noise dominated (total time) | Noise dominated (detector-on time) | Marked lightcurve |
|---|---|---|---|---|---|---|---|
| A | 7267 | 5415 | 6 | 6 | 0.08% | 0.11% | 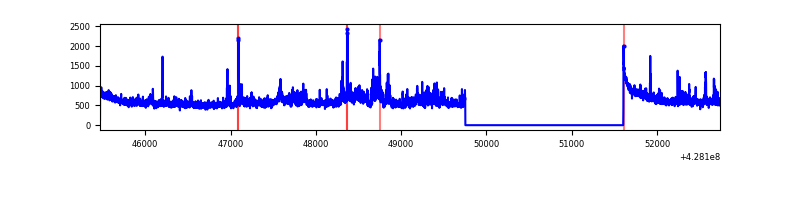 |
| B | 7267 | 5415 | 23 | 23 | 0.32% | 0.42% | 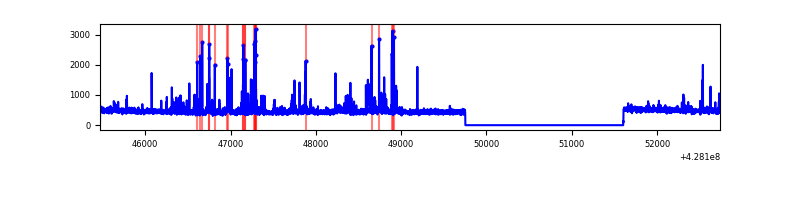 |
| C | 7266 | 5414 | 0 | 0 | 0.00% | 0.00% | 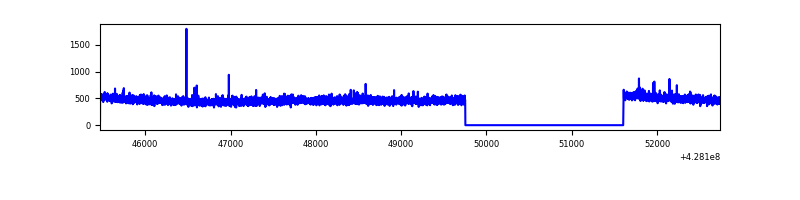 |
| D | 7267 | 5415 | 242 | 242 | 3.33% | 4.47% | 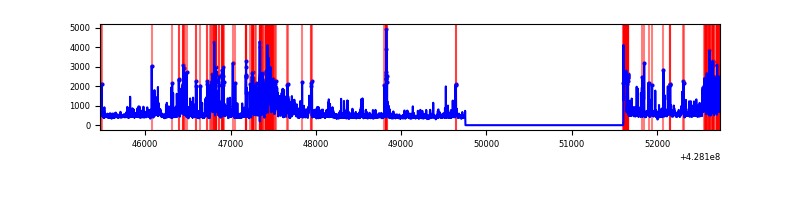 |
Top three noisy pixels from each quadrant. If the there are fewer than three noisy pixels in the level2.evt file, extra rows are filled as -1
| Pixel properties | Quadrant properties | ||||||
|---|---|---|---|---|---|---|---|
| Quadrant | DetID | PixID | Counts | Sigma | Mean | Median | Sigma |
| A | 10 | 83 | 581040 | 4683.06 | 606 | 594 | 123.9 |
| A | 15 | 223 | 398041 | 3206.62 | 606 | 594 | 123.9 |
| A | 13 | 248 | 34231 | 271.38 | 606 | 594 | 123.9 |
| B | 5 | 172 | 128390 | 1134.16 | 594 | 579 | 112.7 |
| B | 0 | 229 | 58164 | 511.0 | 594 | 579 | 112.7 |
| B | 3 | 112 | 39780 | 347.86 | 594 | 579 | 112.7 |
| C | 15 | 214 | 229376 | 1698.01 | 584 | 589 | 134.7 |
| C | 12 | 249 | 16881 | 120.92 | 584 | 589 | 134.7 |
| C | 13 | 61 | 4007 | 25.37 | 584 | 589 | 134.7 |
| D | 2 | 249 | 543808 | 3866.76 | 580 | 564 | 140.5 |
| D | 1 | 52 | 523251 | 3720.44 | 580 | 564 | 140.5 |
| D | 10 | 199 | 198400 | 1408.18 | 580 | 564 | 140.5 |
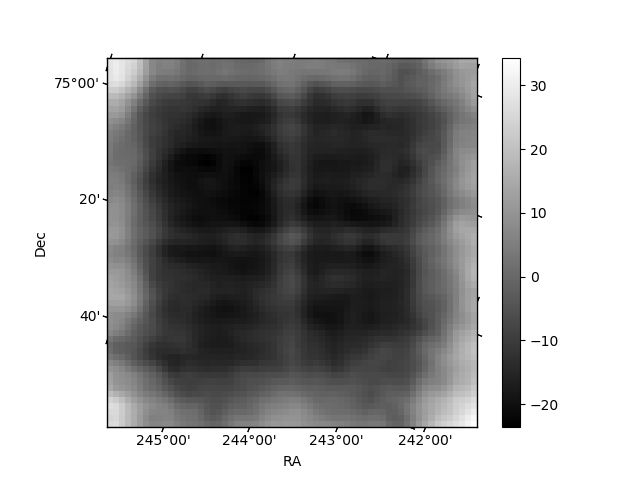
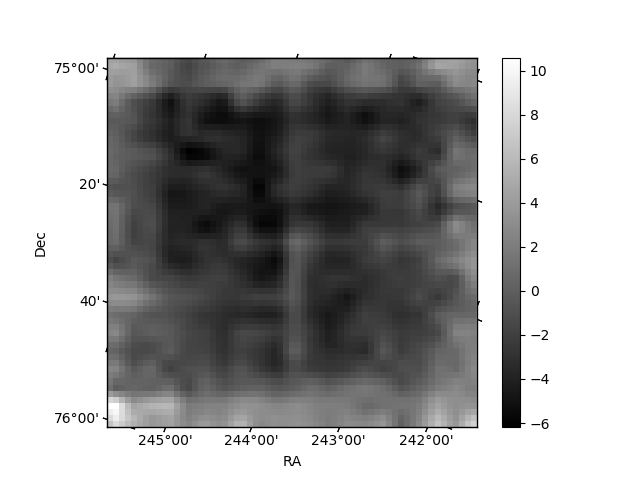
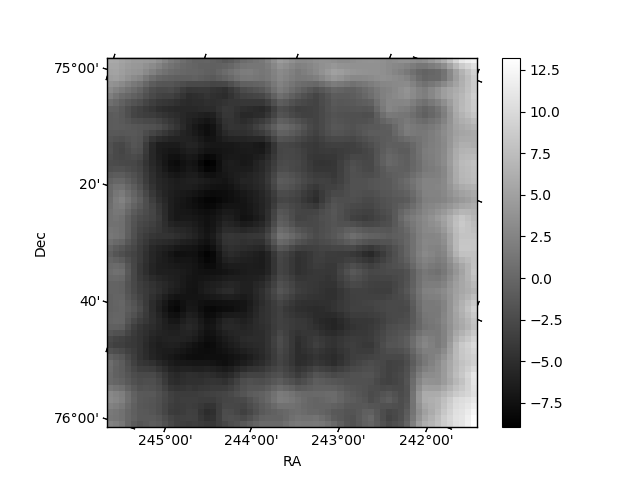
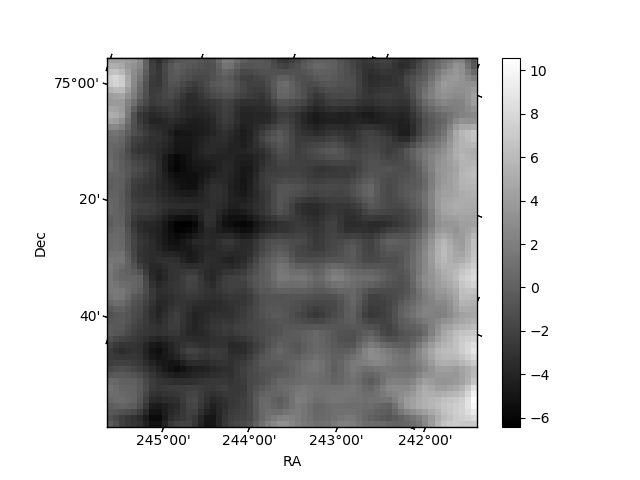
Histogram calculated using DETX and DETY for each event in the final _common_clean file
| Quadrant A | 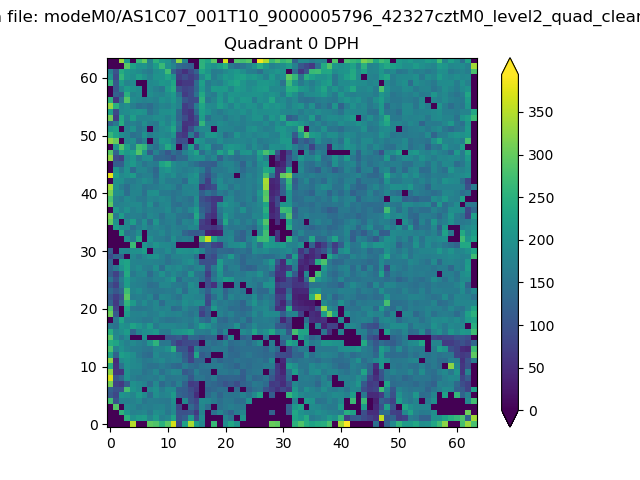 |
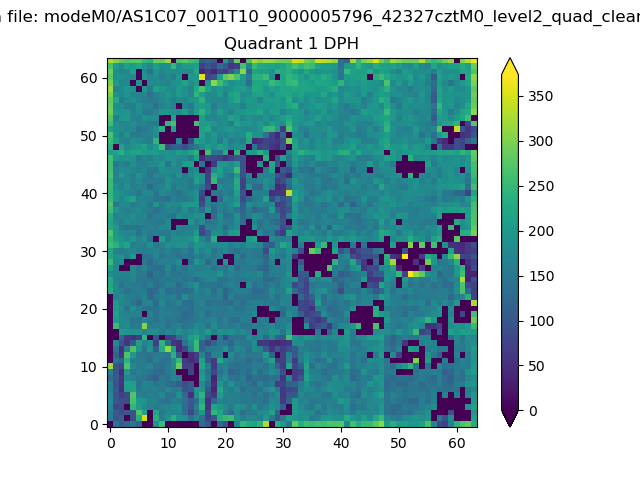 |
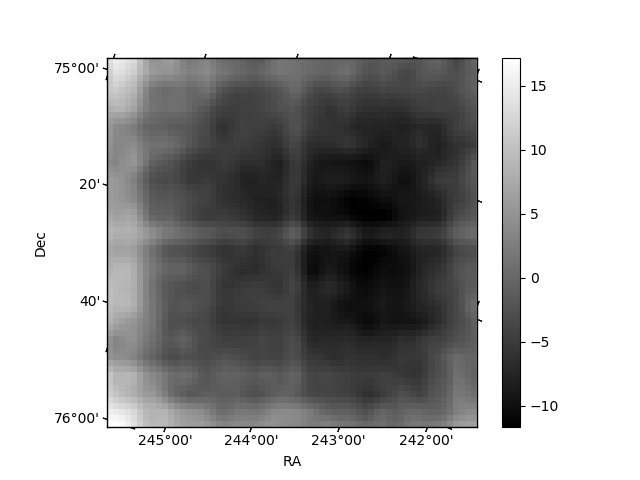
Quadrant B |
|---|---|---|---|
| Quadrant D | 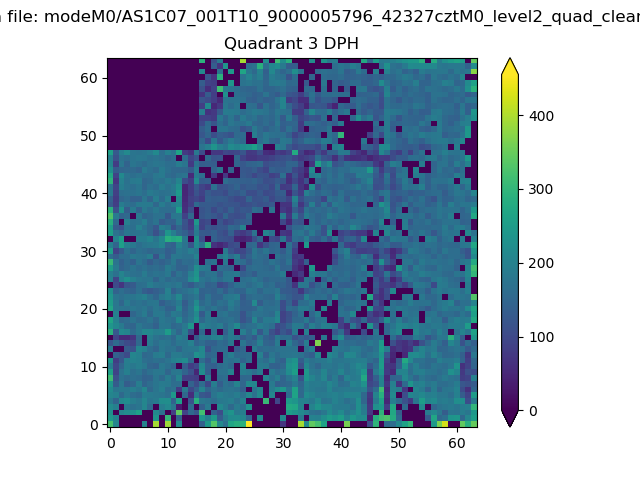 |
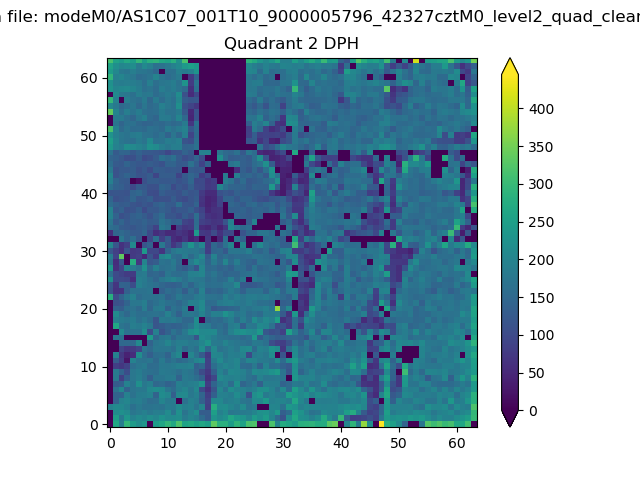 |
Quadrant C |
| Plot type | Count rate plots | Images |
|---|---|---|
| Comparison with Poisson distribution Blue bars denote a histogram of data divided into 1 sec bins. Red curve is a Poisson curve with rate = median count rate of data. |
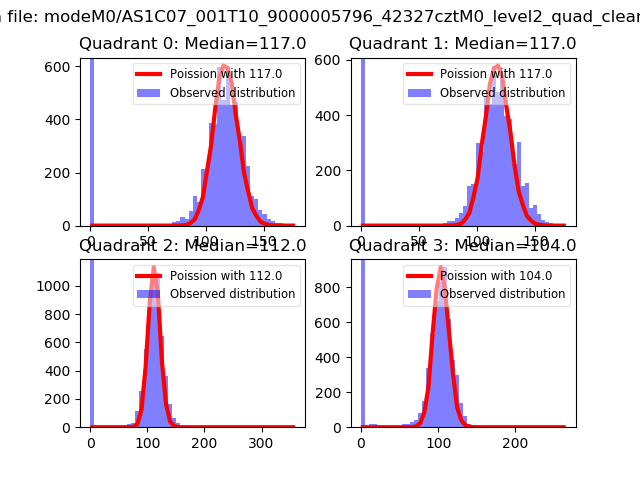 |
 |
| Quadrant-wise count rates Data is divided into 100 sec bins |
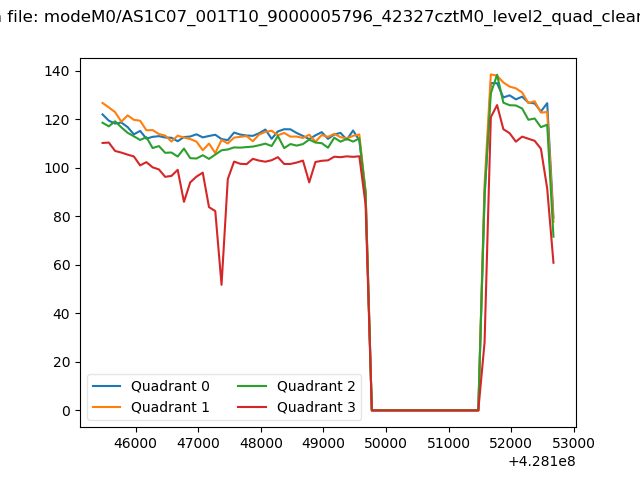 |
|
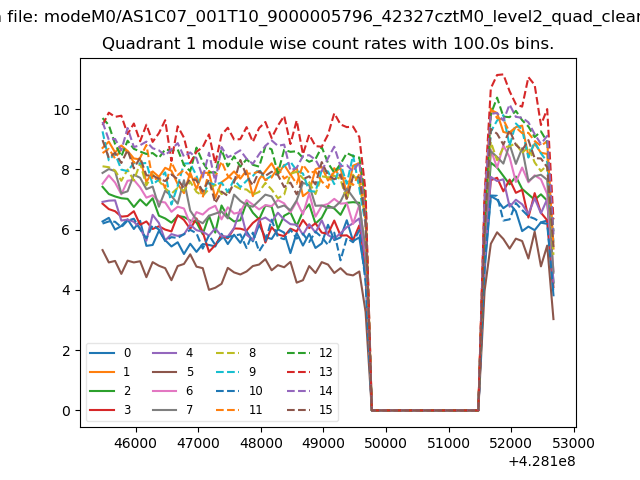
| Module-wise count rates for Quadrant A Data is divided into 100 sec bins |
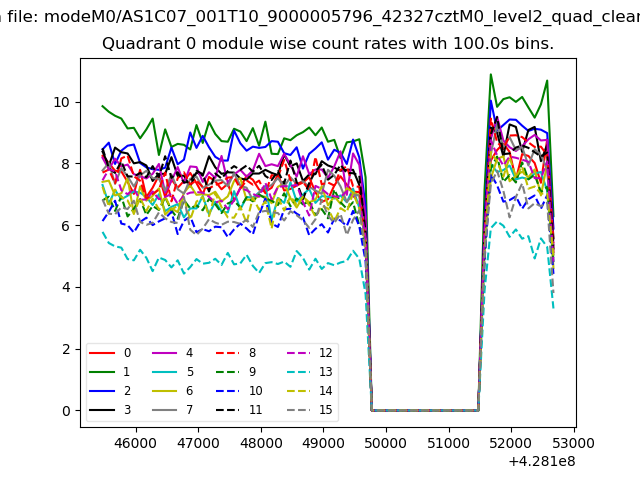 |
 |
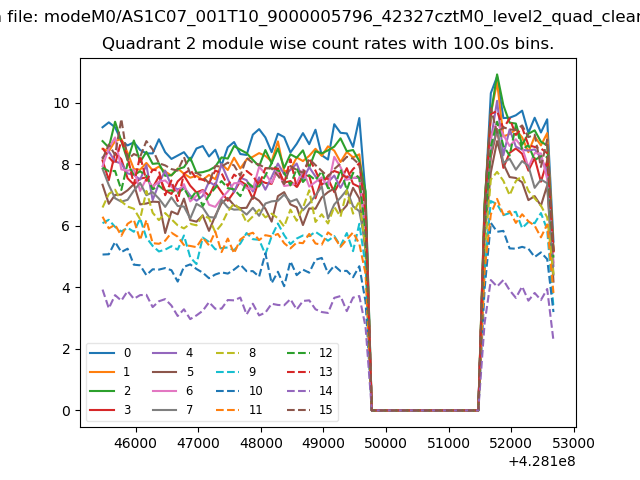
| Module-wise count rates for Quadrant B Data is divided into 100 sec bins |
 |
 |
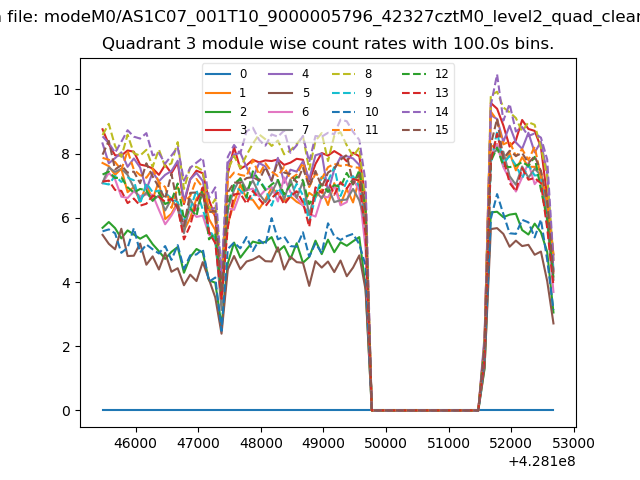
| Module-wise count rates for Quadrant C Data is divided into 100 sec bins |
 |
 |
| Module-wise count rates for Quadrant D Data is divided into 100 sec bins |
 |
 |
| Parameter | Plot |
|---|---|
| CZT HV Monitor | 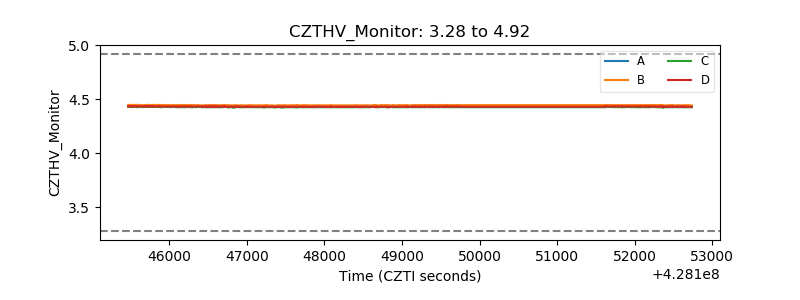 |
| D_VDD | 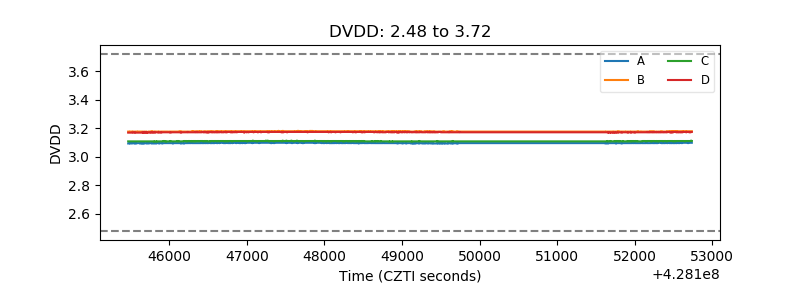 |
| Temperature 1 | 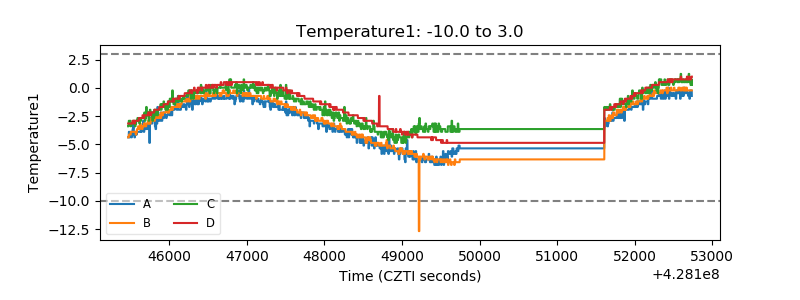 |
| Veto HV Monitor |  |
| Veto LLD | 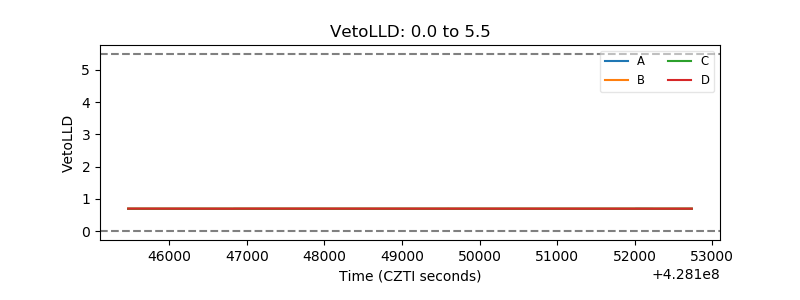 |
| Alpha Counter | 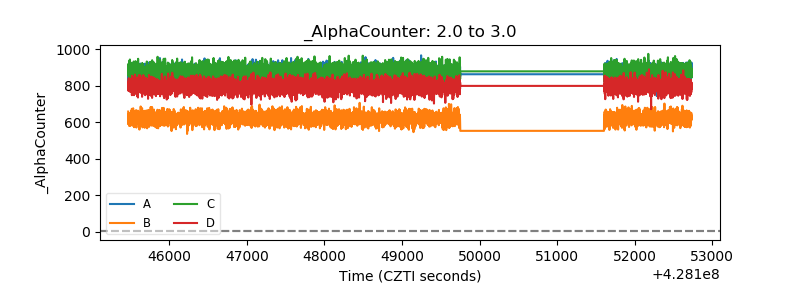 |
| _CPM_Rate | 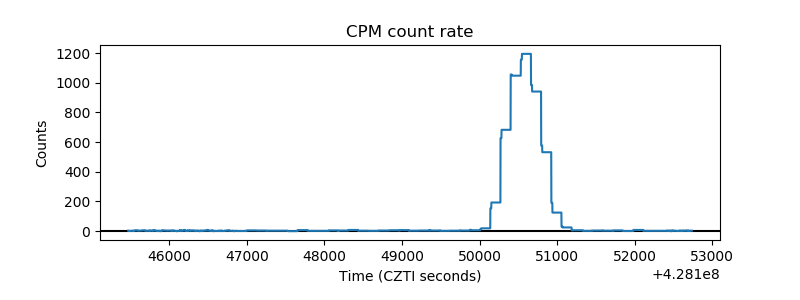 |
| CZT Counter | 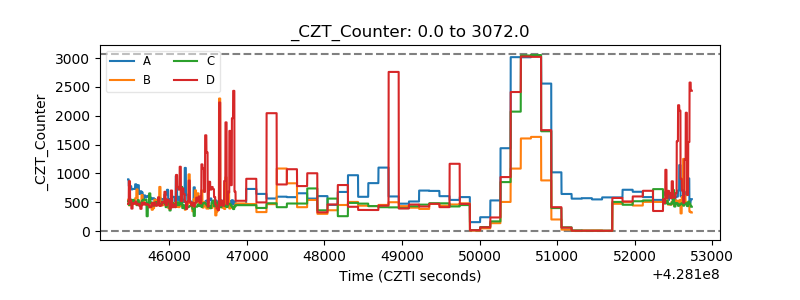 |
| +2.5 Volts monitor | 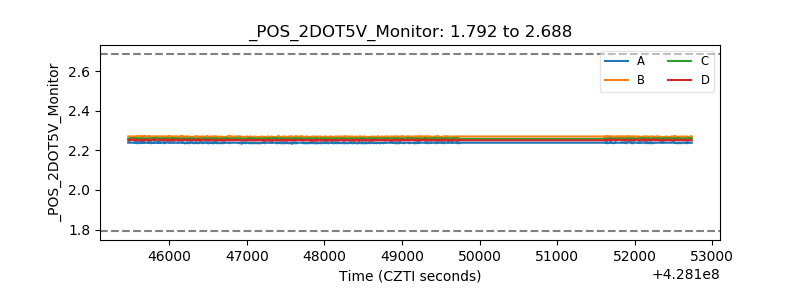 |
| +5 Volts monitor | 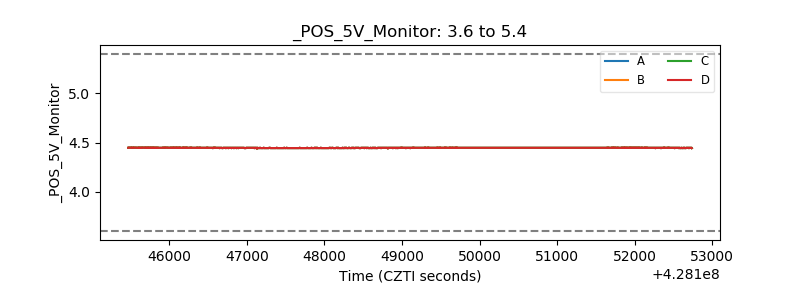 |
| _ROLL_ROT | 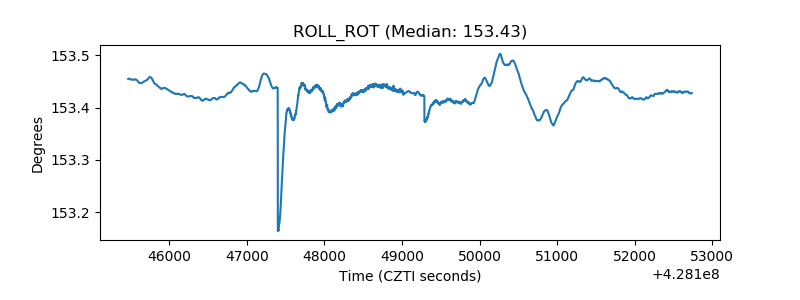 |
| _Roll_DEC | 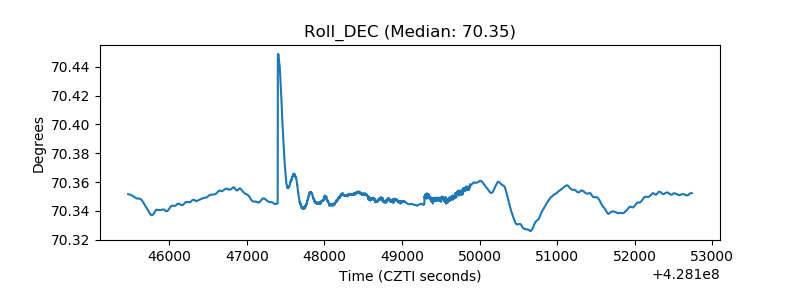 |
| _Roll_RA | 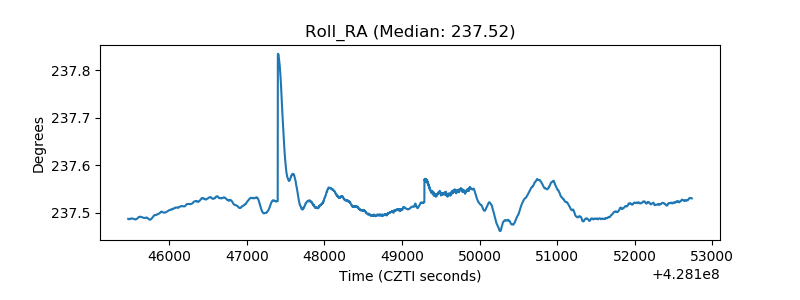 |
| Veto Counter | 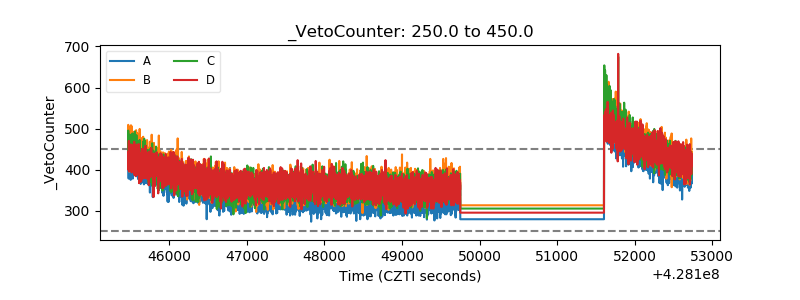 |