| Param | Original file | Final file |
|---|---|---|
| Filename | modeM0/AS1C07_001T10_9000005796_42328cztM0_level2.fits | modeM0/AS1C07_001T10_9000005796_42328cztM0_level2_quad_clean.evt |
| Size (bytes) | 391,838,400 | 86,474,880 |
| Size | 373.7 MB | 82.5 MB |
| Events in quadrant A | 5,208,828 | 556,132 |
| Events in quadrant B | 2,609,421 | 605,589 |
| Events in quadrant C | 2,386,650 | 585,540 |
| Events in quadrant D | 3,912,772 | 522,142 |
| Mode M0 | |||
|---|---|---|---|
| Quadrant | BADHDUFLAG | Total packets | Discarded packets |
| A | 0 | 19137 | 1 |
| B | 0 | 11062 | 1 |
| C | 0 | 10090 | 1 |
| D | 0 | 14932 | 1 |
| Mode SS | |||
|---|---|---|---|
| Quadrant | BADHDUFLAG | Total packets | Discarded packets |
| A | 0 | 102 | 0 |
| B | 0 | 102 | 0 |
| C | 0 | 102 | 0 |
| D | 0 | 102 | 0 |
| Mode M9 | |||
|---|---|---|---|
| Quadrant | BADHDUFLAG | Total packets | Discarded packets |
| A | 0 | 20 | 0 |
| B | 0 | 20 | 0 |
| C | 0 | 20 | 0 |
| D | 0 | 20 | 0 |
| Quadrant | Total seconds | Saturated seconds | Saturation percentage |
|---|---|---|---|
| A | 4973 | 535 | 10.758094% |
| B | 4974 | 66 | 1.326900% |
| C | 4974 | 6 | 0.120627% |
| D | 4974 | 313 | 6.292722% |
Noise dominated data is calculated using 1-second bins in cleaned event files. If a bin has >2000 counts, and if more than 50% of those come from <1% of pixels, then it is considered to be noise-dominated and hence unusable.
| Quadrant | # 1 sec bins | Bins with >0 counts | Bins with >2000 counts | High rate bins dominated by noise | Noise dominated (total time) | Noise dominated (detector-on time) | Marked lightcurve |
|---|---|---|---|---|---|---|---|
| A | 6946 | 4974 | 536 | 536 | 7.72% | 10.78% | 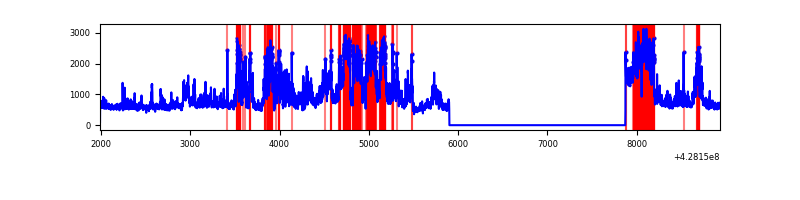 |
| B | 6947 | 4975 | 46 | 46 | 0.66% | 0.92% | 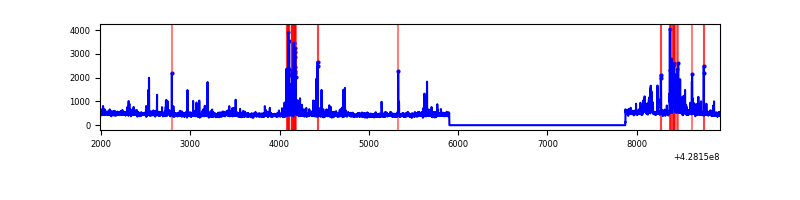 |
| C | 6947 | 4975 | 2 | 2 | 0.03% | 0.04% | 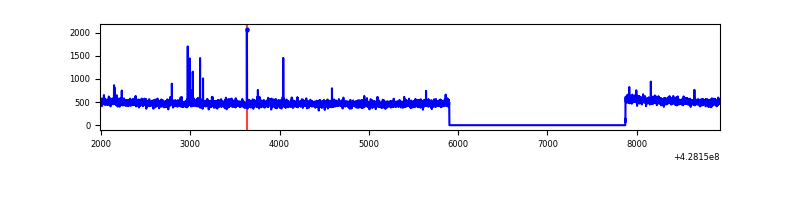 |
| D | 6947 | 4975 | 274 | 274 | 3.94% | 5.51% | 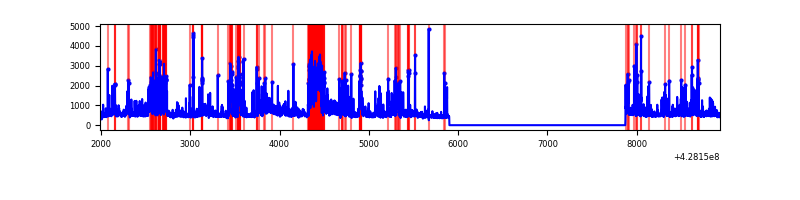 |
Top three noisy pixels from each quadrant. If the there are fewer than three noisy pixels in the level2.evt file, extra rows are filled as -1
| Pixel properties | Quadrant properties | ||||||
|---|---|---|---|---|---|---|---|
| Quadrant | DetID | PixID | Counts | Sigma | Mean | Median | Sigma |
| A | 15 | 223 | 2492565 | 22311.06 | 549 | 539 | 111.7 |
| A | 10 | 83 | 517356 | 4627.05 | 549 | 539 | 111.7 |
| A | 13 | 248 | 47519 | 420.61 | 549 | 539 | 111.7 |
| B | 5 | 172 | 105215 | 1006.52 | 553 | 541 | 104.0 |
| B | 0 | 229 | 87589 | 837.03 | 553 | 541 | 104.0 |
| B | 15 | 35 | 59545 | 567.37 | 553 | 541 | 104.0 |
| C | 15 | 214 | 211201 | 1660.3 | 549 | 551 | 126.9 |
| C | 12 | 249 | 13207 | 99.75 | 549 | 551 | 126.9 |
| C | 12 | 250 | 8807 | 65.07 | 549 | 551 | 126.9 |
| D | 2 | 249 | 590848 | 4547.73 | 539 | 523 | 129.8 |
| D | 1 | 52 | 539827 | 4154.68 | 539 | 523 | 129.8 |
| D | 10 | 118 | 151366 | 1162.06 | 539 | 523 | 129.8 |
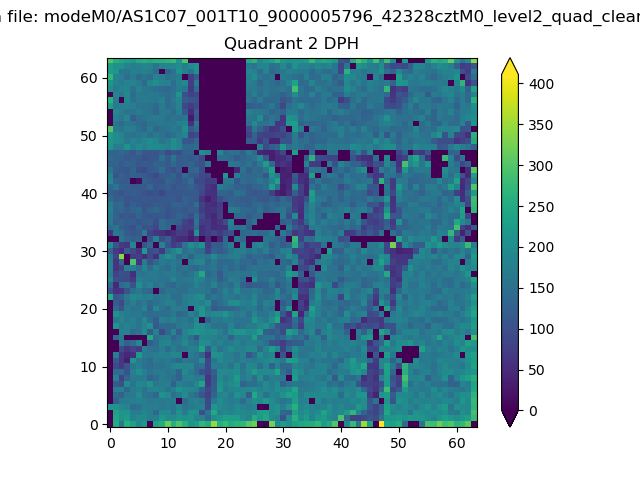
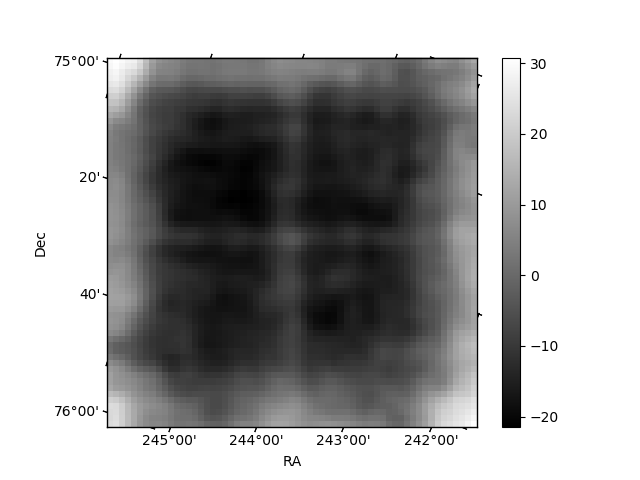
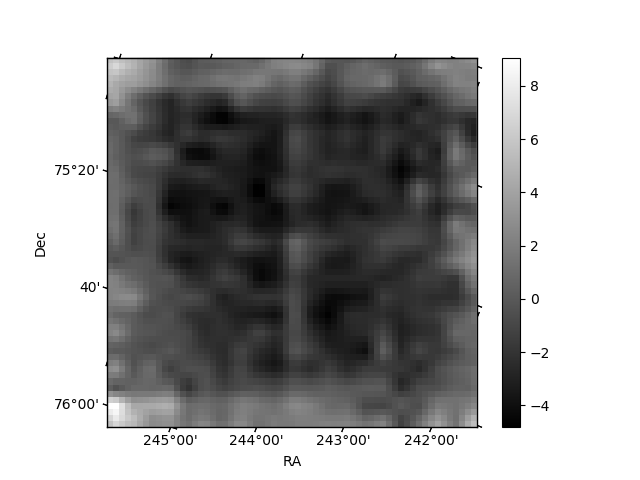
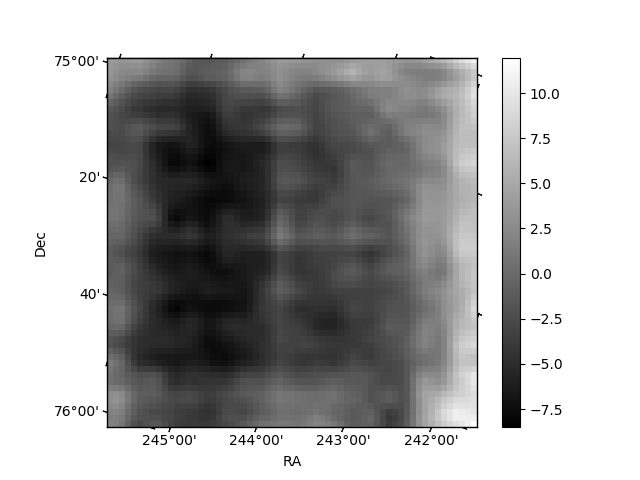
Histogram calculated using DETX and DETY for each event in the final _common_clean file
| Quadrant A | 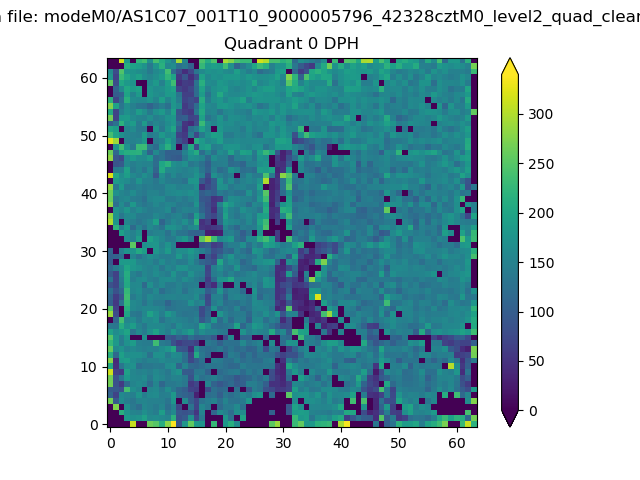 |
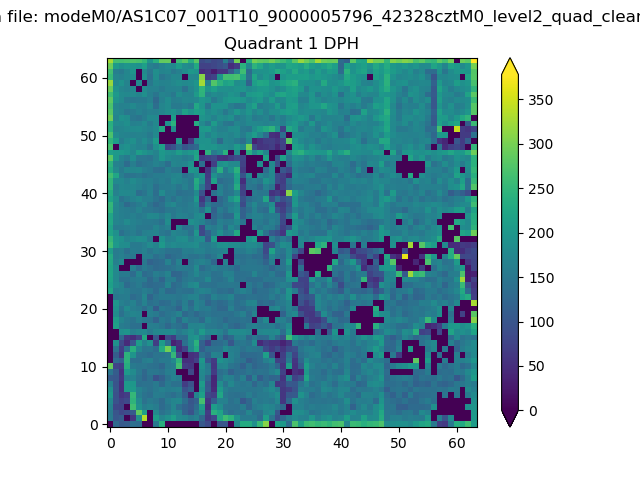 |
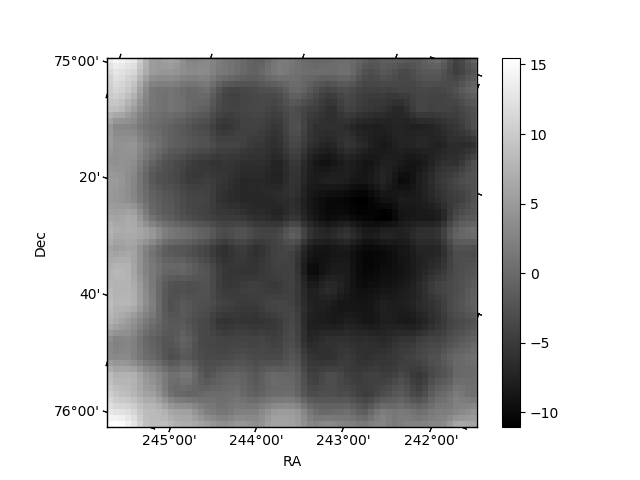
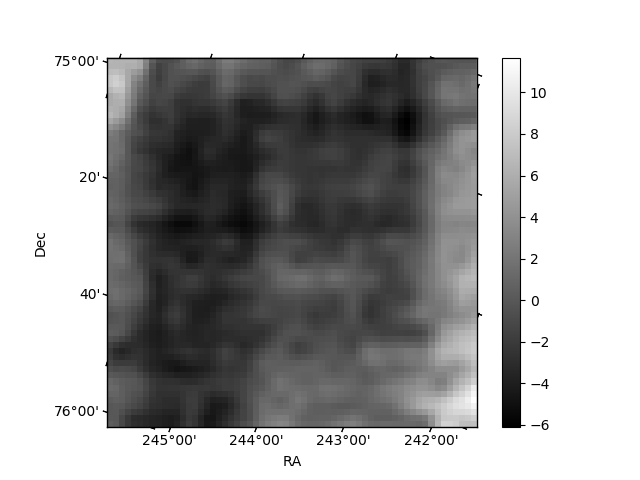
Quadrant B |
|---|---|---|---|
| Quadrant D | 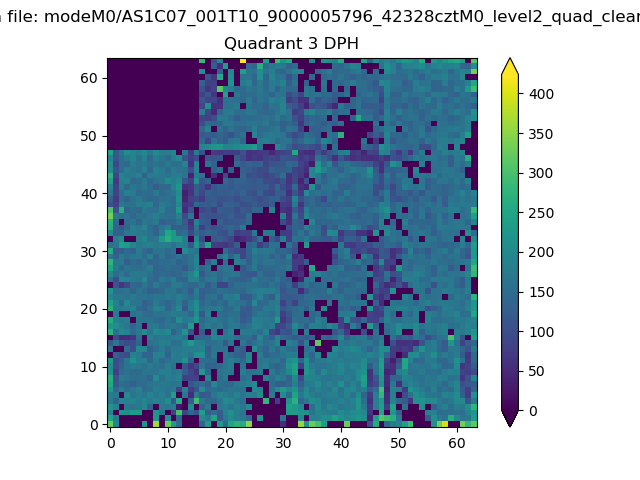 |
 |
Quadrant C |
| Plot type | Count rate plots | Images |
|---|---|---|
| Comparison with Poisson distribution Blue bars denote a histogram of data divided into 1 sec bins. Red curve is a Poisson curve with rate = median count rate of data. |
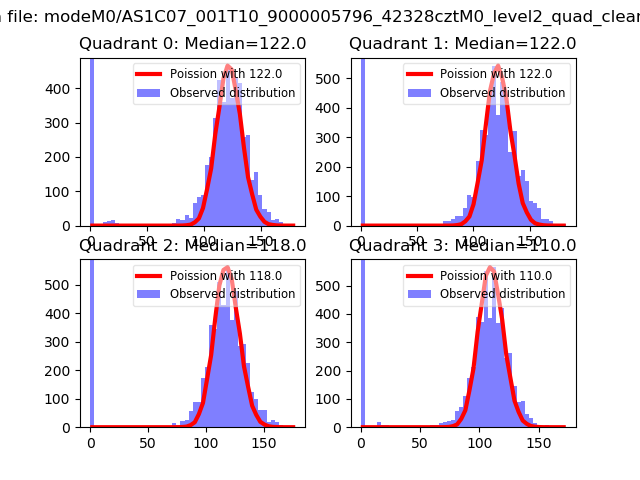 |
 |
| Quadrant-wise count rates Data is divided into 100 sec bins |
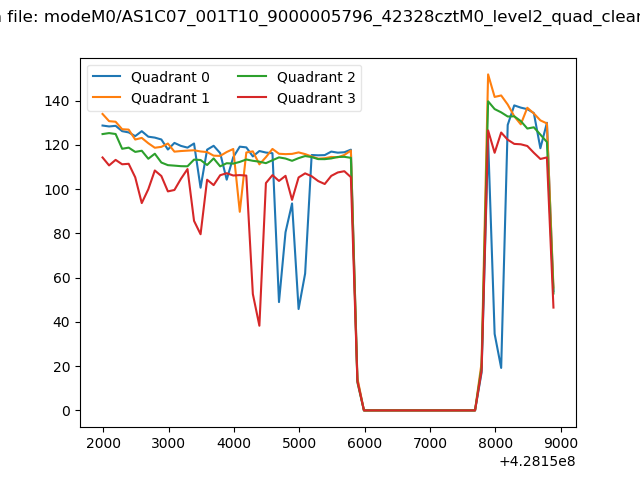 |
|
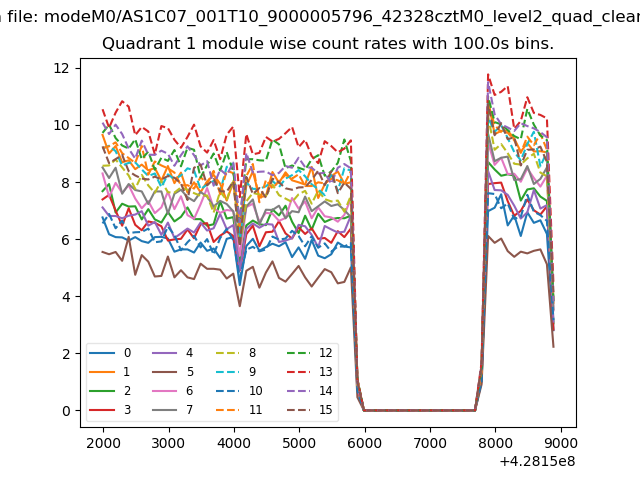
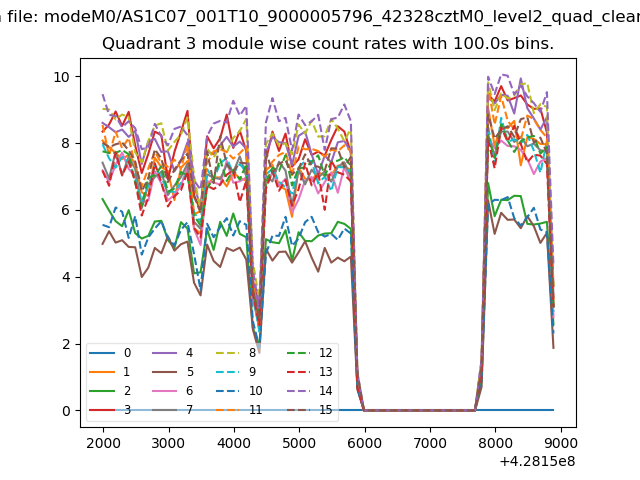
| Module-wise count rates for Quadrant A Data is divided into 100 sec bins |
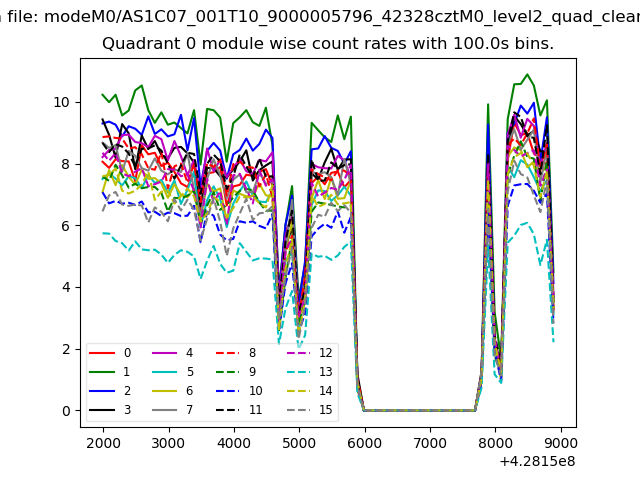 |
 |
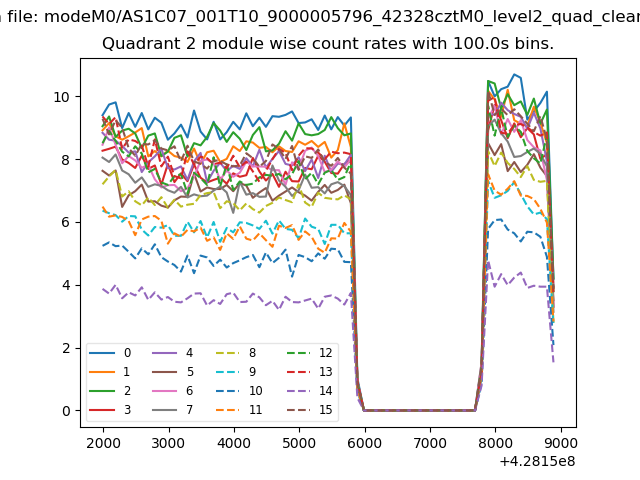
| Module-wise count rates for Quadrant B Data is divided into 100 sec bins |
 |
 |
| Module-wise count rates for Quadrant C Data is divided into 100 sec bins |
 |
 |
| Module-wise count rates for Quadrant D Data is divided into 100 sec bins |
 |
 |
| Parameter | Plot |
|---|---|
| CZT HV Monitor | 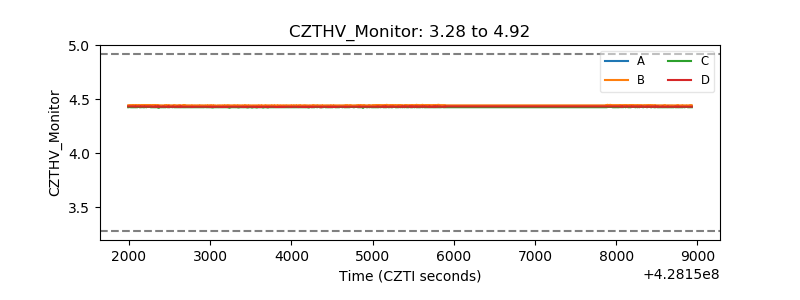 |
| D_VDD | 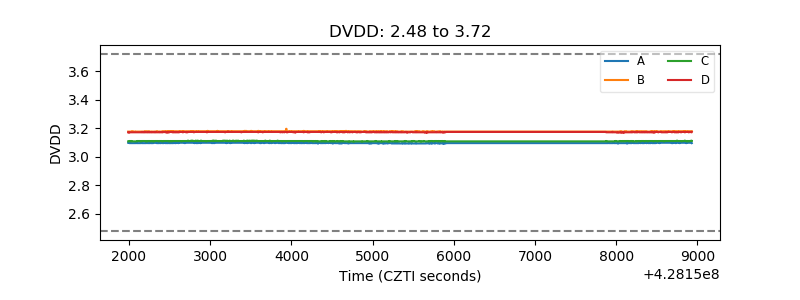 |
| Temperature 1 | 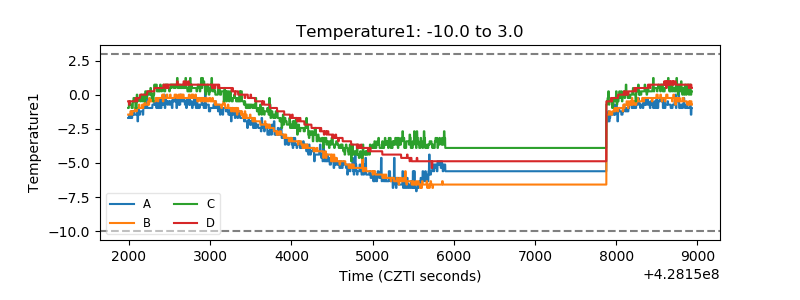 |
| Veto HV Monitor | 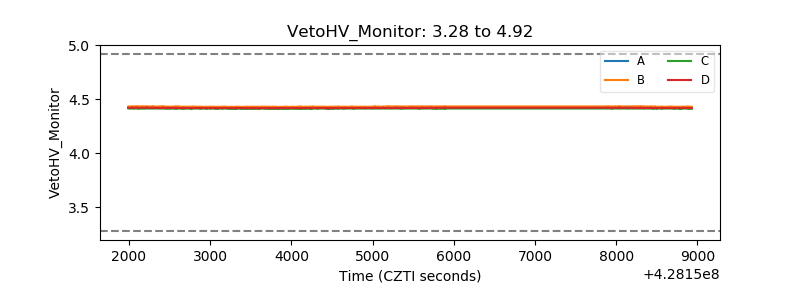 |
| Veto LLD | 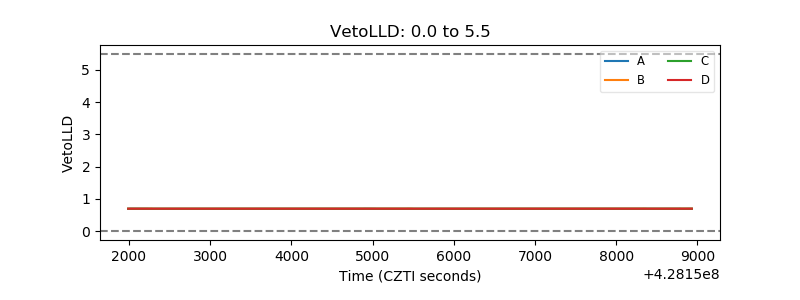 |
| Alpha Counter | 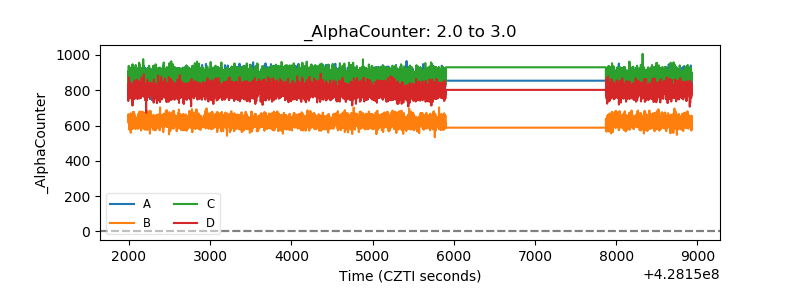 |
| _CPM_Rate | 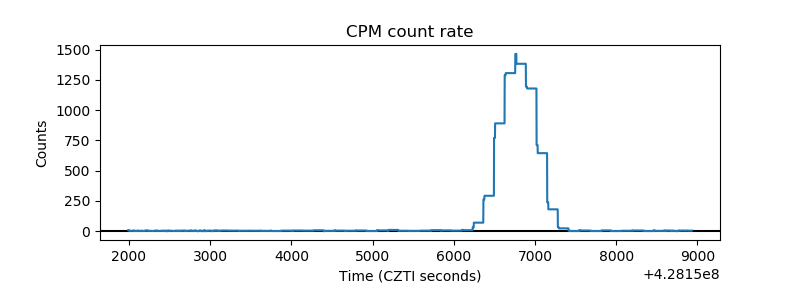 |
| CZT Counter | 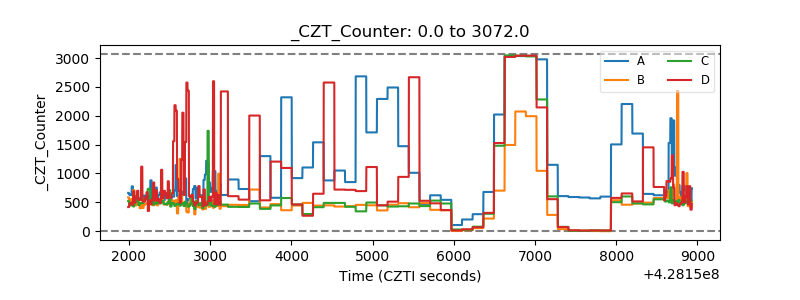 |
| +2.5 Volts monitor | 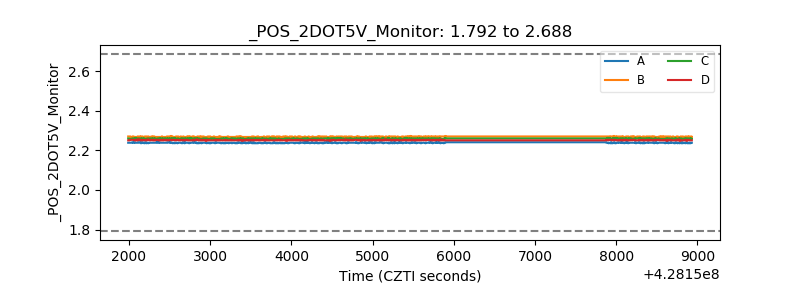 |
| +5 Volts monitor | 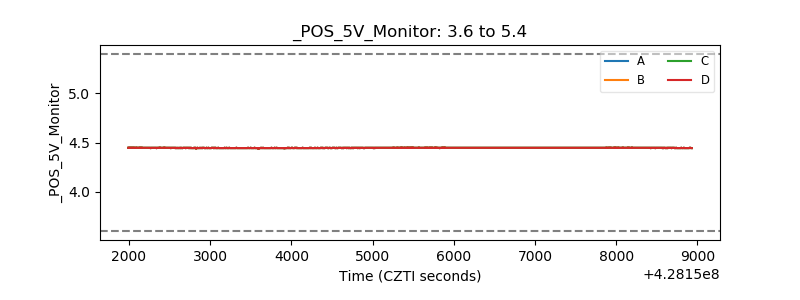 |
| _ROLL_ROT | 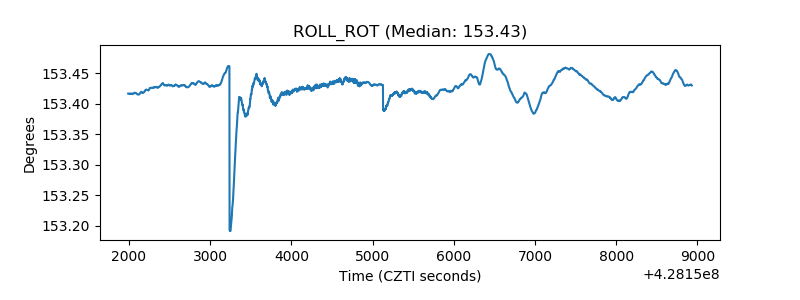 |
| _Roll_DEC | 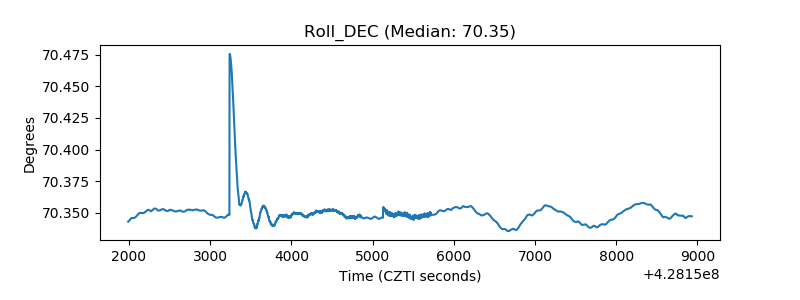 |
| _Roll_RA | 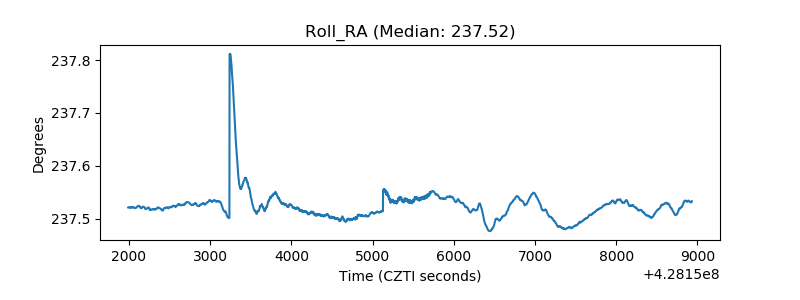 |
| Veto Counter | 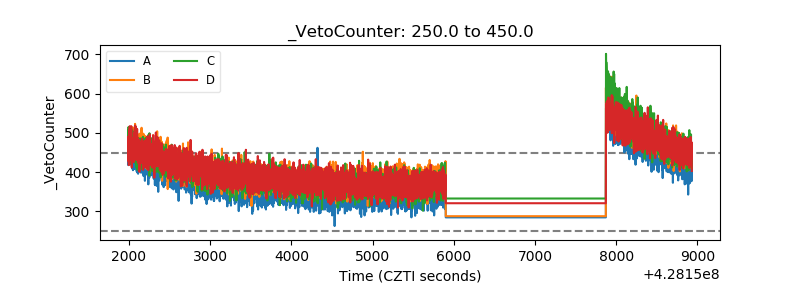 |