| Param | Original file | Final file |
|---|---|---|
| Filename | modeM0/AS1C07_001T10_9000005796_42329cztM0_level2.fits | modeM0/AS1C07_001T10_9000005796_42329cztM0_level2_quad_clean.evt |
| Size (bytes) | 425,615,040 | 92,764,800 |
| Size | 405.9 MB | 88.5 MB |
| Events in quadrant A | 5,141,183 | 624,419 |
| Events in quadrant B | 2,787,544 | 650,849 |
| Events in quadrant C | 2,548,483 | 633,398 |
| Events in quadrant D | 4,874,924 | 536,992 |
| Mode M0 | |||
|---|---|---|---|
| Quadrant | BADHDUFLAG | Total packets | Discarded packets |
| A | 0 | 19154 | 5 |
| B | 0 | 11694 | 2 |
| C | 0 | 10600 | 2 |
| D | 0 | 18026 | 2 |
| Mode SS | |||
|---|---|---|---|
| Quadrant | BADHDUFLAG | Total packets | Discarded packets |
| A | 0 | 106 | 0 |
| B | 0 | 106 | 0 |
| C | 0 | 106 | 0 |
| D | 0 | 106 | 0 |
| Mode M9 | |||
|---|---|---|---|
| Quadrant | BADHDUFLAG | Total packets | Discarded packets |
| A | 0 | 23 | 0 |
| B | 0 | 24 | 0 |
| C | 0 | 24 | 0 |
| D | 0 | 24 | 0 |
| Quadrant | Total seconds | Saturated seconds | Saturation percentage |
|---|---|---|---|
| A | 5183 | 330 | 6.366969% |
| B | 5183 | 87 | 1.678565% |
| C | 5183 | 6 | 0.115763% |
| D | 5183 | 620 | 11.962184% |
Noise dominated data is calculated using 1-second bins in cleaned event files. If a bin has >2000 counts, and if more than 50% of those come from <1% of pixels, then it is considered to be noise-dominated and hence unusable.
| Quadrant | # 1 sec bins | Bins with >0 counts | Bins with >2000 counts | High rate bins dominated by noise | Noise dominated (total time) | Noise dominated (detector-on time) | Marked lightcurve |
|---|---|---|---|---|---|---|---|
| A | 7247 | 5184 | 299 | 299 | 4.13% | 5.77% | 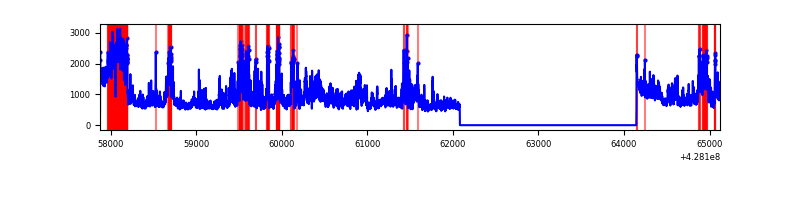 |
| B | 7247 | 5184 | 53 | 53 | 0.73% | 1.02% | 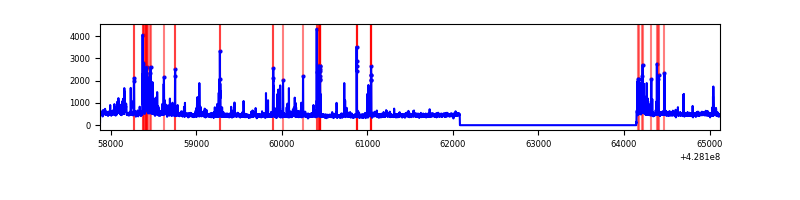 |
| C | 7247 | 5184 | 0 | 0 | 0.00% | 0.00% | 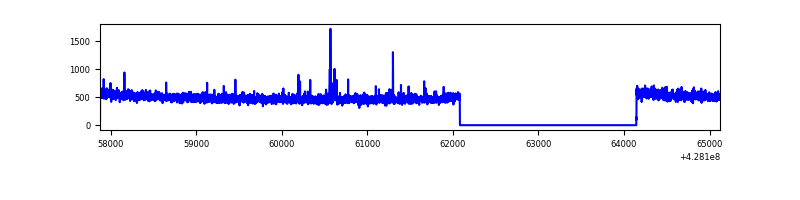 |
| D | 7247 | 5184 | 580 | 580 | 8.00% | 11.19% | 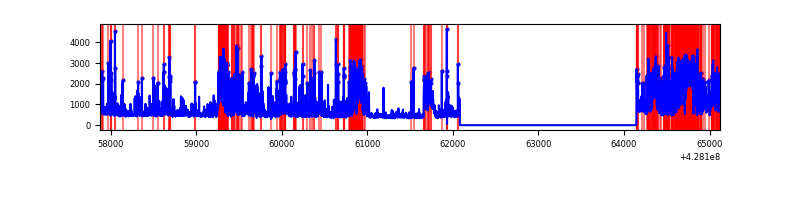 |
Top three noisy pixels from each quadrant. If the there are fewer than three noisy pixels in the level2.evt file, extra rows are filled as -1
| Pixel properties | Quadrant properties | ||||||
|---|---|---|---|---|---|---|---|
| Quadrant | DetID | PixID | Counts | Sigma | Mean | Median | Sigma |
| A | 15 | 223 | 2139038 | 18033.31 | 586 | 576 | 118.6 |
| A | 10 | 83 | 625387 | 5268.93 | 586 | 576 | 118.6 |
| A | 13 | 248 | 72148 | 603.56 | 586 | 576 | 118.6 |
| B | 0 | 229 | 226707 | 2074.49 | 587 | 573 | 109.0 |
| B | 5 | 172 | 61406 | 558.07 | 587 | 573 | 109.0 |
| B | 15 | 35 | 48602 | 440.6 | 587 | 573 | 109.0 |
| C | 15 | 214 | 222445 | 1649.23 | 586 | 588 | 134.5 |
| C | 15 | 159 | 13117 | 93.14 | 586 | 588 | 134.5 |
| C | 7 | 220 | 12941 | 91.83 | 586 | 588 | 134.5 |
| D | 5 | 222 | 806004 | 5900.59 | 565 | 551 | 136.5 |
| D | 1 | 52 | 531015 | 3886.07 | 565 | 551 | 136.5 |
| D | 12 | 233 | 390314 | 2855.33 | 565 | 551 | 136.5 |
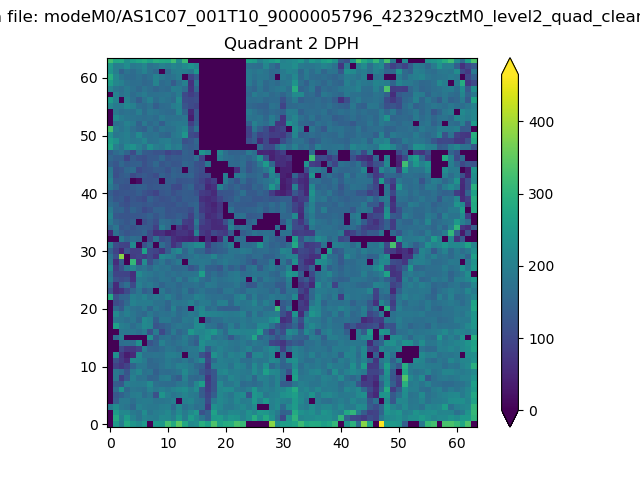
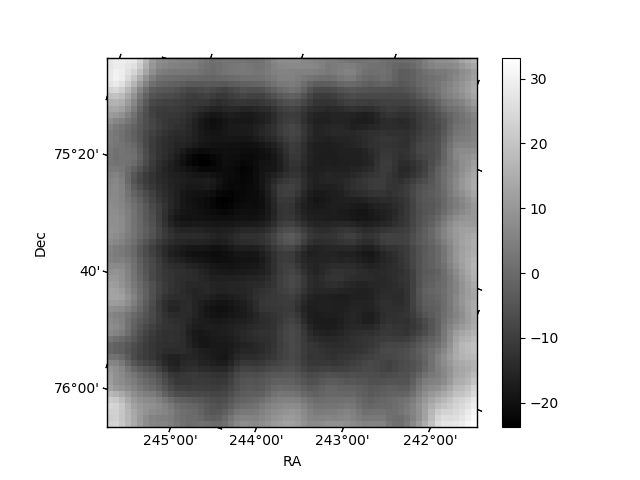
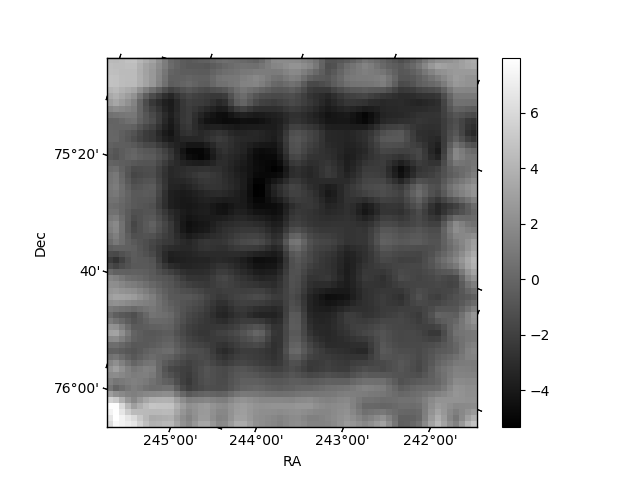
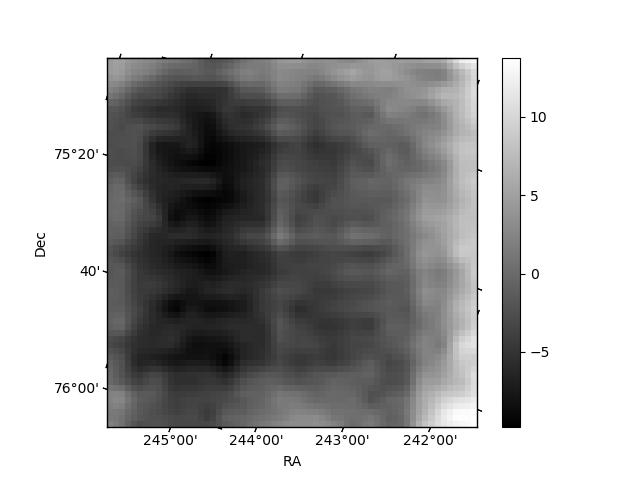
Histogram calculated using DETX and DETY for each event in the final _common_clean file
| Quadrant A | 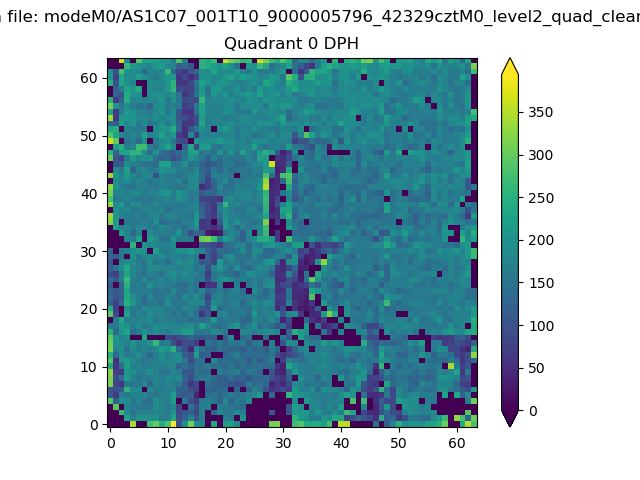 |
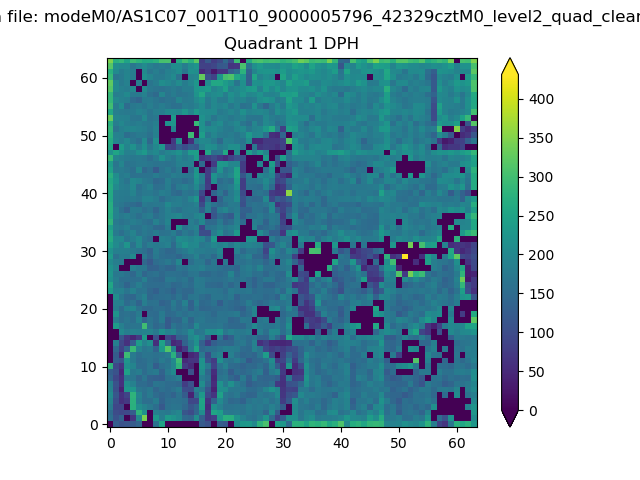 |
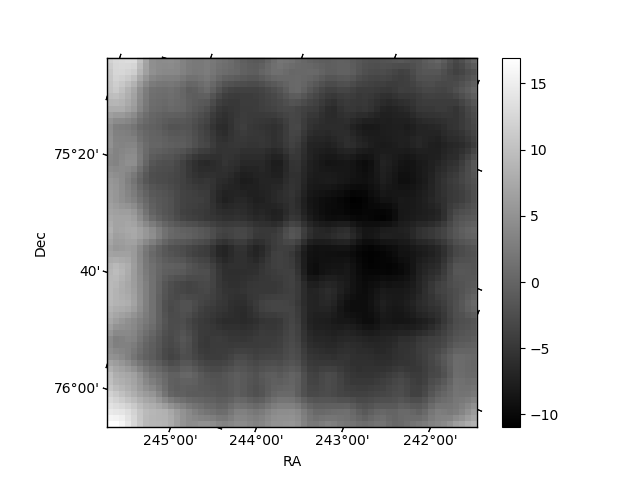
Quadrant B |
|---|---|---|---|
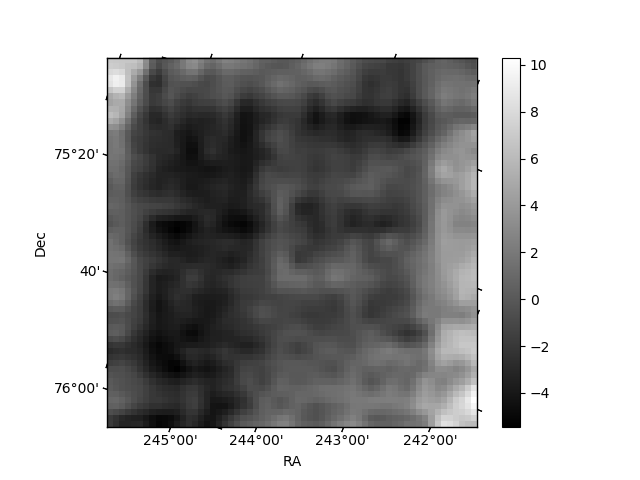
| Quadrant D | 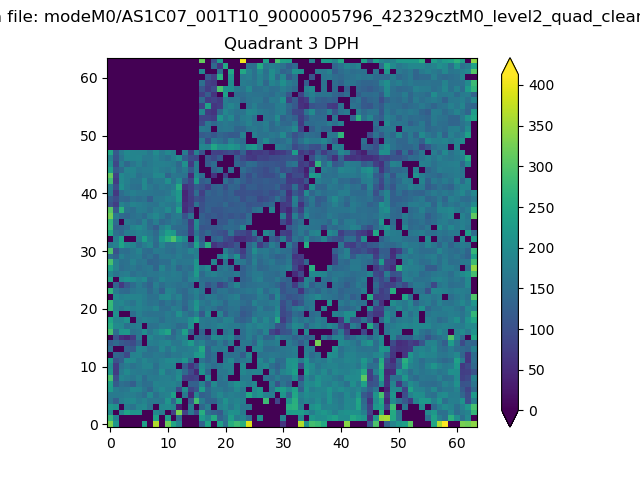 |
 |
Quadrant C |
| Plot type | Count rate plots | Images |
|---|---|---|
| Comparison with Poisson distribution Blue bars denote a histogram of data divided into 1 sec bins. Red curve is a Poisson curve with rate = median count rate of data. |
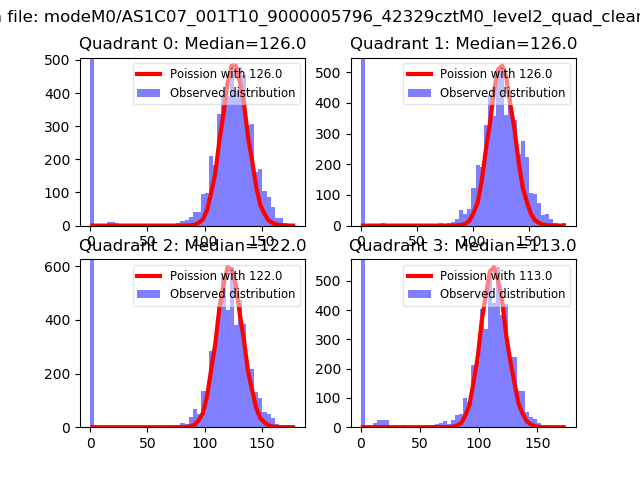 |
 |
| Quadrant-wise count rates Data is divided into 100 sec bins |
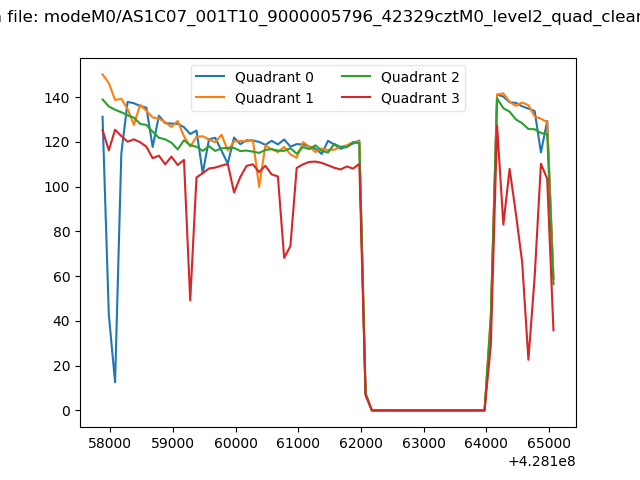 |
|
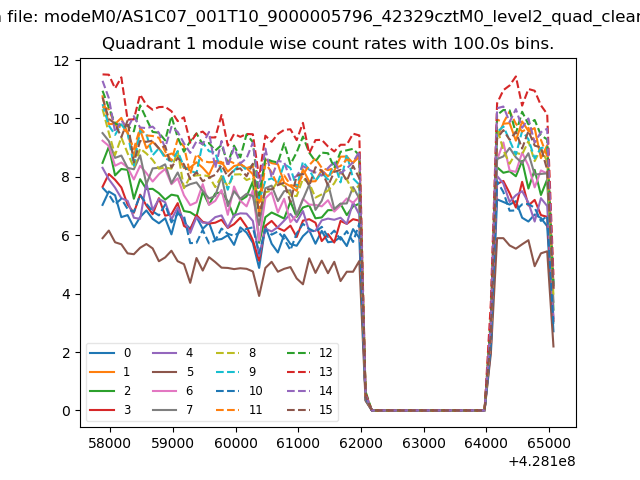
| Module-wise count rates for Quadrant A Data is divided into 100 sec bins |
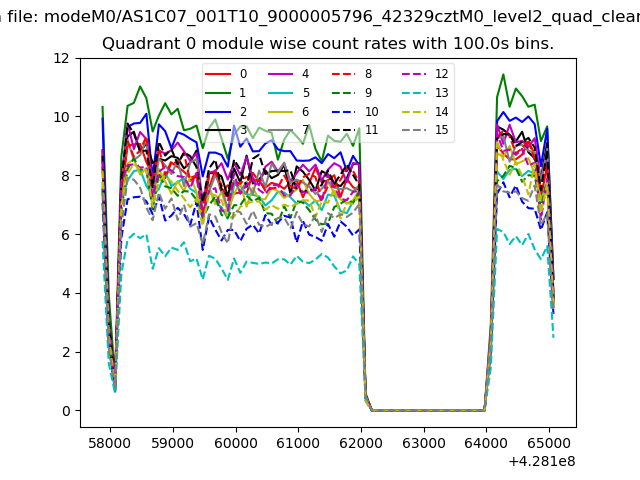 |
 |
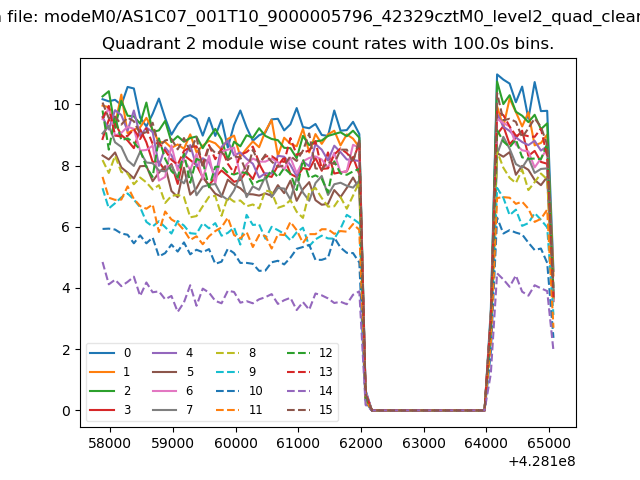
| Module-wise count rates for Quadrant B Data is divided into 100 sec bins |
 |
 |
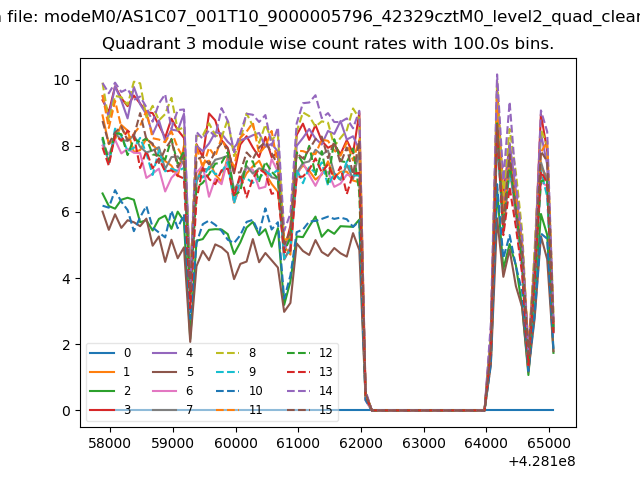
| Module-wise count rates for Quadrant C Data is divided into 100 sec bins |
 |
 |
| Module-wise count rates for Quadrant D Data is divided into 100 sec bins |
 |
 |
| Parameter | Plot |
|---|---|
| CZT HV Monitor | 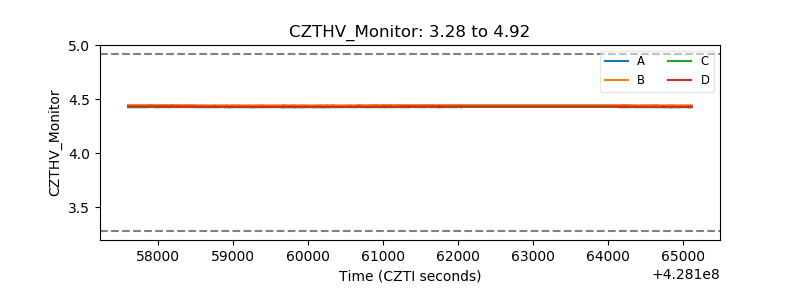 |
| D_VDD | 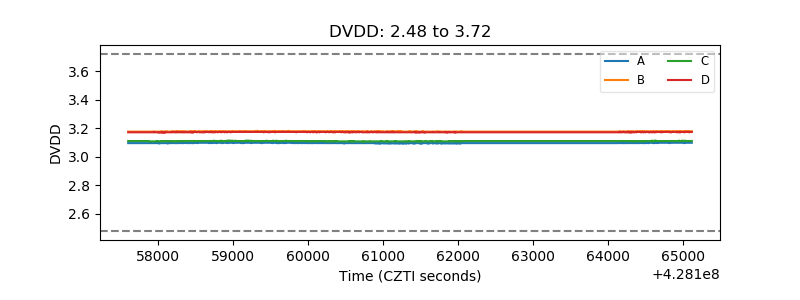 |
| Temperature 1 | 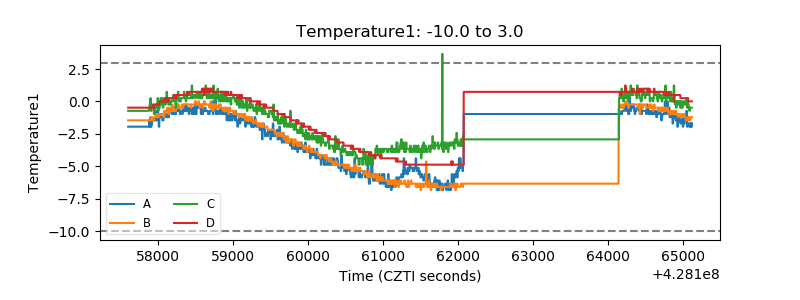 |
| Veto HV Monitor | 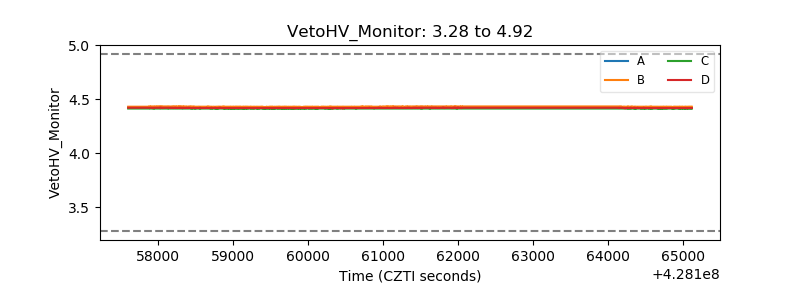 |
| Veto LLD | 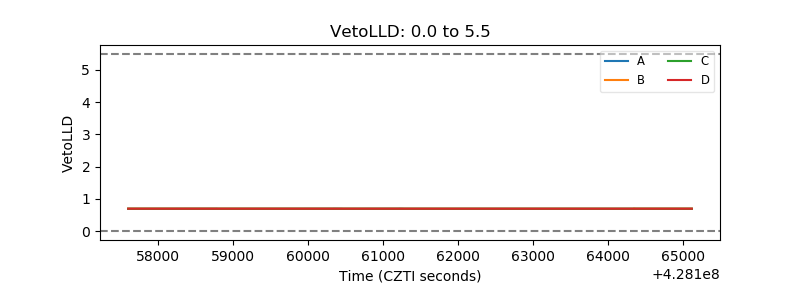 |
| Alpha Counter | 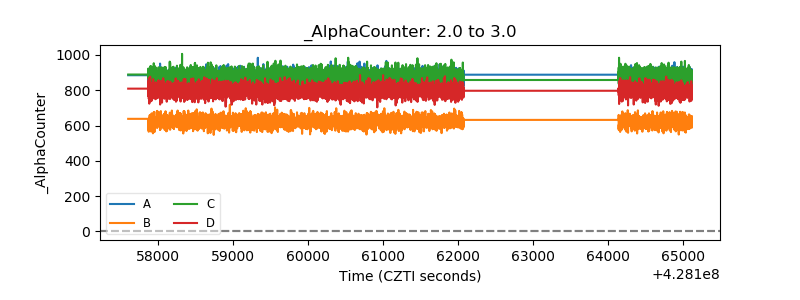 |
| _CPM_Rate | 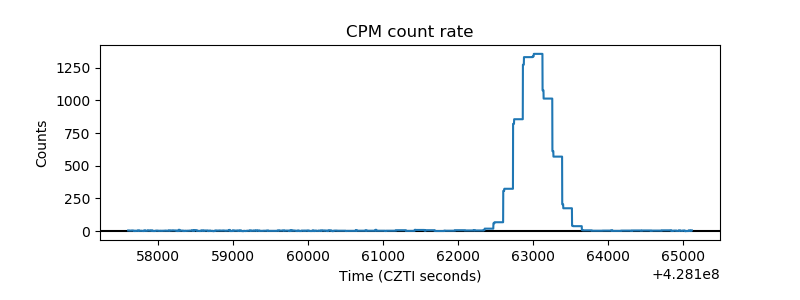 |
| CZT Counter | 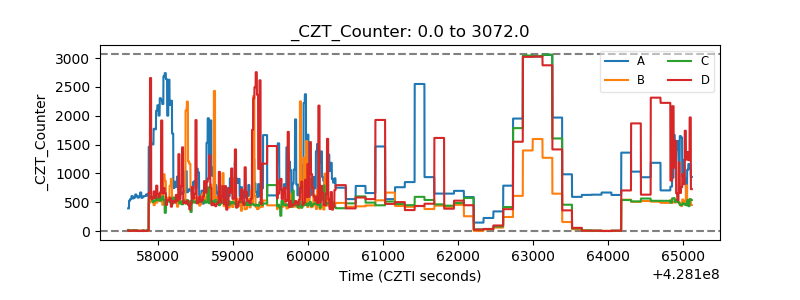 |
| +2.5 Volts monitor | 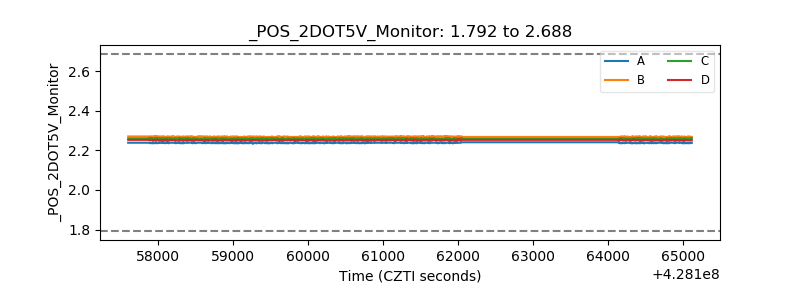 |
| +5 Volts monitor | 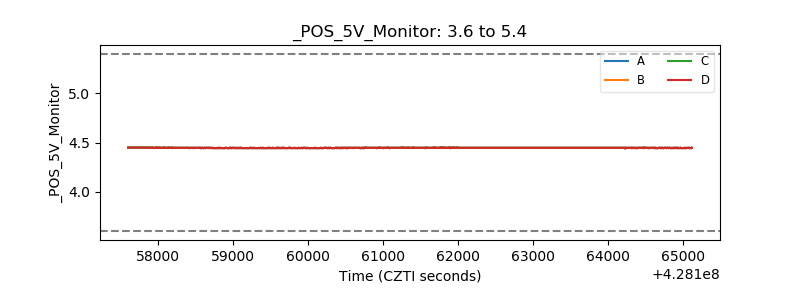 |
| _ROLL_ROT | 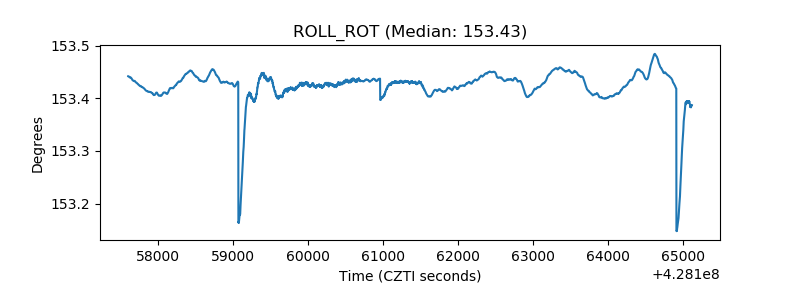 |
| _Roll_DEC | 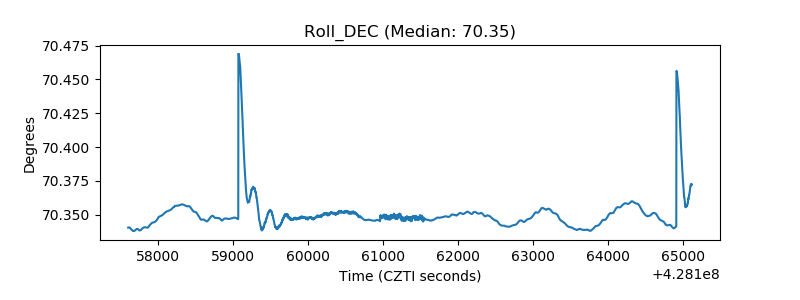 |
| _Roll_RA | 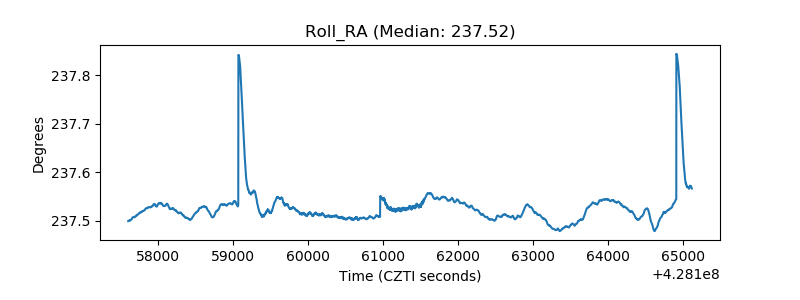 |
| Veto Counter | 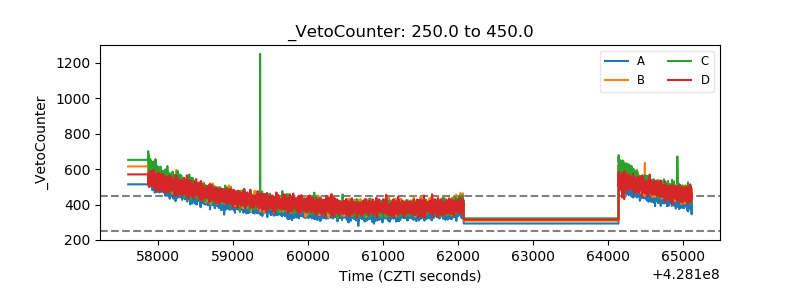 |