| Param | Original file | Final file |
|---|---|---|
| Filename | modeM0/AS1C07_001T10_9000005796_42330cztM0_level2.fits | modeM0/AS1C07_001T10_9000005796_42330cztM0_level2_quad_clean.evt |
| Size (bytes) | 488,692,800 | 84,813,120 |
| Size | 466.1 MB | 80.9 MB |
| Events in quadrant A | 4,287,617 | 613,884 |
| Events in quadrant B | 2,644,988 | 621,486 |
| Events in quadrant C | 2,492,317 | 606,165 |
| Events in quadrant D | 8,274,852 | 374,663 |
| Mode M0 | |||
|---|---|---|---|
| Quadrant | BADHDUFLAG | Total packets | Discarded packets |
| A | 0 | 16200 | 5 |
| B | 0 | 11202 | 2 |
| C | 0 | 10377 | 2 |
| D | 0 | 28044 | 2 |
| Mode SS | |||
|---|---|---|---|
| Quadrant | BADHDUFLAG | Total packets | Discarded packets |
| A | 0 | 100 | 0 |
| B | 0 | 100 | 0 |
| C | 0 | 100 | 0 |
| D | 0 | 100 | 0 |
| Mode M9 | |||
|---|---|---|---|
| Quadrant | BADHDUFLAG | Total packets | Discarded packets |
| A | 0 | 22 | 0 |
| B | 0 | 23 | 0 |
| C | 0 | 23 | 0 |
| D | 0 | 23 | 0 |
| Quadrant | Total seconds | Saturated seconds | Saturation percentage |
|---|---|---|---|
| A | 5023 | 108 | 2.150109% |
| B | 5023 | 49 | 0.975513% |
| C | 5023 | 9 | 0.179176% |
| D | 5023 | 1990 | 39.617758% |
Noise dominated data is calculated using 1-second bins in cleaned event files. If a bin has >2000 counts, and if more than 50% of those come from <1% of pixels, then it is considered to be noise-dominated and hence unusable.
| Quadrant | # 1 sec bins | Bins with >0 counts | Bins with >2000 counts | High rate bins dominated by noise | Noise dominated (total time) | Noise dominated (detector-on time) | Marked lightcurve |
|---|---|---|---|---|---|---|---|
| A | 7147 | 5024 | 85 | 85 | 1.19% | 1.69% | 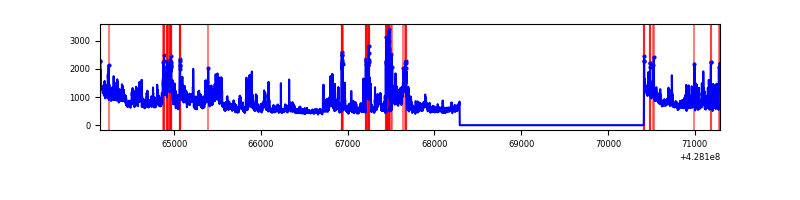 |
| B | 7147 | 5024 | 30 | 30 | 0.42% | 0.60% | 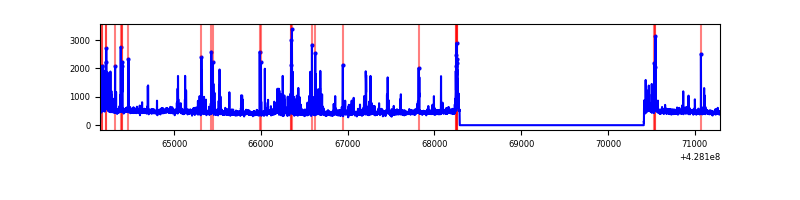 |
| C | 7147 | 5024 | 7 | 7 | 0.10% | 0.14% | 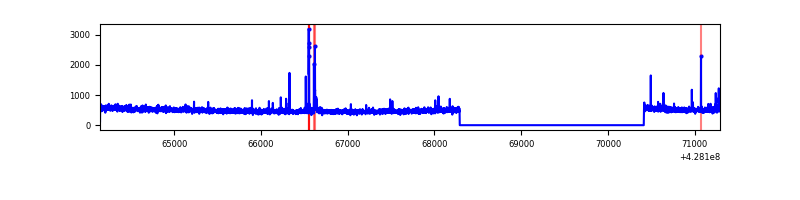 |
| D | 7147 | 5024 | 1819 | 1819 | 25.45% | 36.21% | 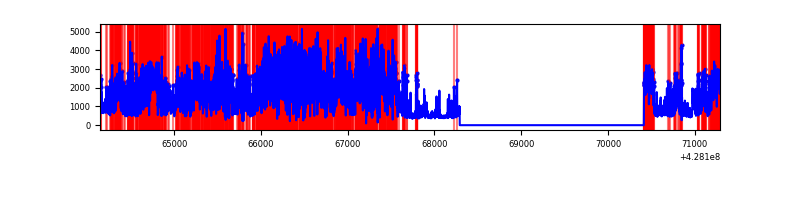 |
Top three noisy pixels from each quadrant. If the there are fewer than three noisy pixels in the level2.evt file, extra rows are filled as -1
| Pixel properties | Quadrant properties | ||||||
|---|---|---|---|---|---|---|---|
| Quadrant | DetID | PixID | Counts | Sigma | Mean | Median | Sigma |
| A | 15 | 223 | 1369458 | 12060.92 | 562 | 551 | 113.5 |
| A | 10 | 83 | 623477 | 5488.36 | 562 | 551 | 113.5 |
| A | 13 | 248 | 82843 | 725.04 | 562 | 551 | 113.5 |
| B | 0 | 229 | 147020 | 1392.91 | 560 | 546 | 105.2 |
| B | 3 | 112 | 101342 | 958.53 | 560 | 546 | 105.2 |
| B | 5 | 172 | 58021 | 546.56 | 560 | 546 | 105.2 |
| C | 15 | 214 | 215776 | 1669.27 | 561 | 565 | 128.9 |
| C | 15 | 159 | 53970 | 414.23 | 561 | 565 | 128.9 |
| C | 15 | 111 | 25121 | 190.47 | 561 | 565 | 128.9 |
| D | 5 | 222 | 4528641 | 40413.63 | 457 | 443 | 112.0 |
| D | 1 | 52 | 680947 | 6073.42 | 457 | 443 | 112.0 |
| D | 5 | 32 | 329664 | 2938.26 | 457 | 443 | 112.0 |
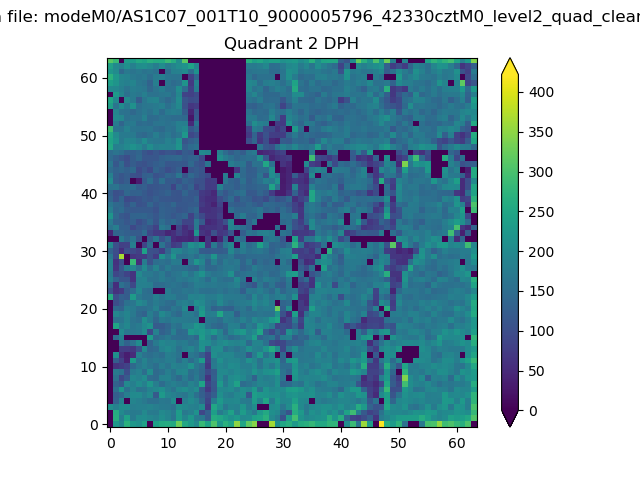
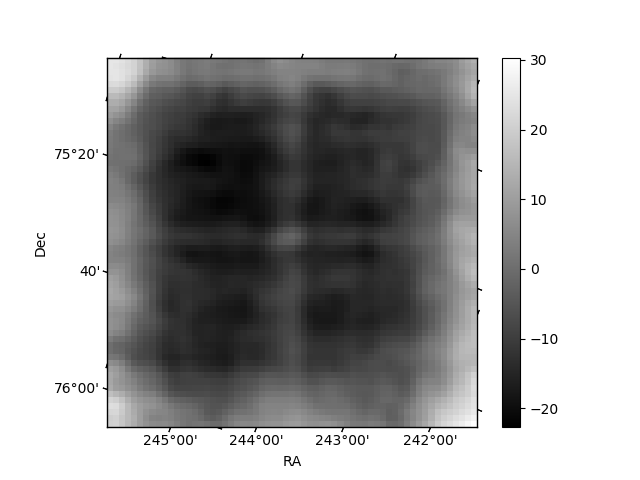
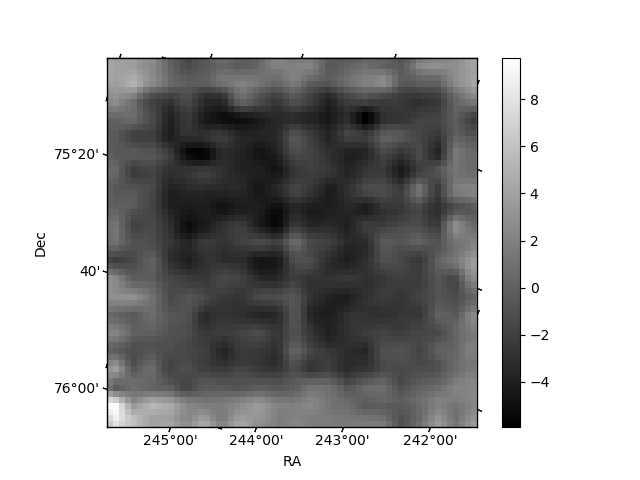
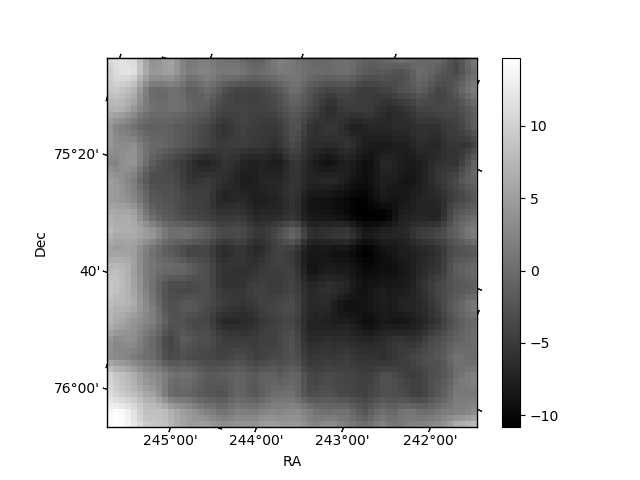
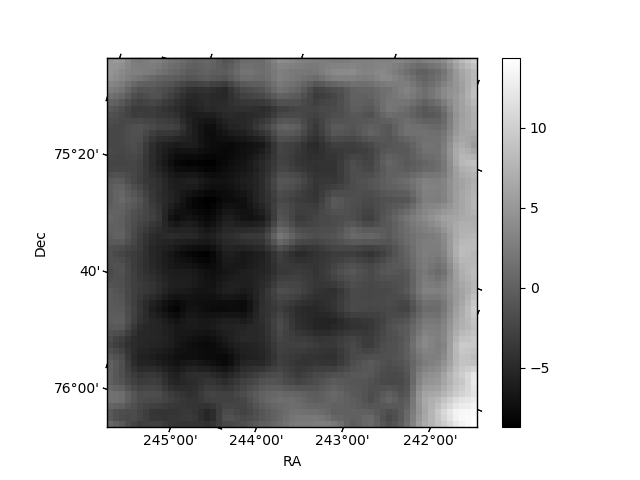
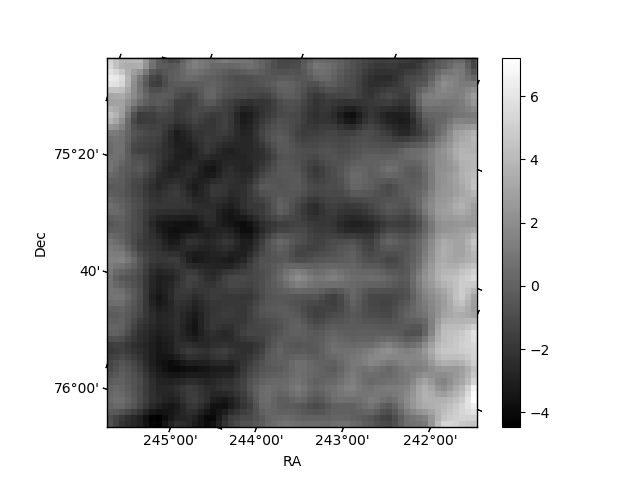
Histogram calculated using DETX and DETY for each event in the final _common_clean file
| Quadrant A | 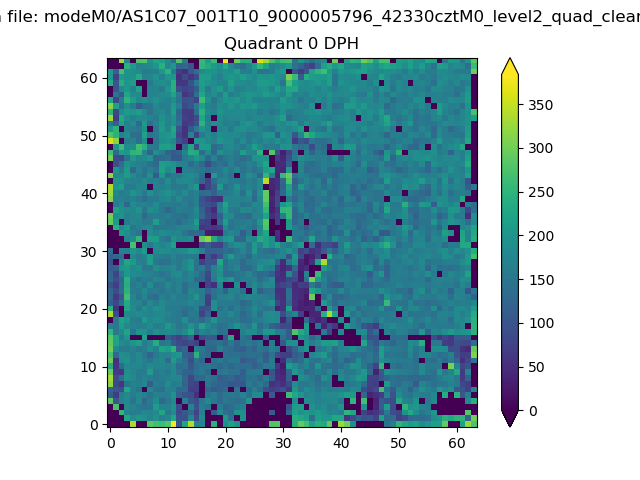 |
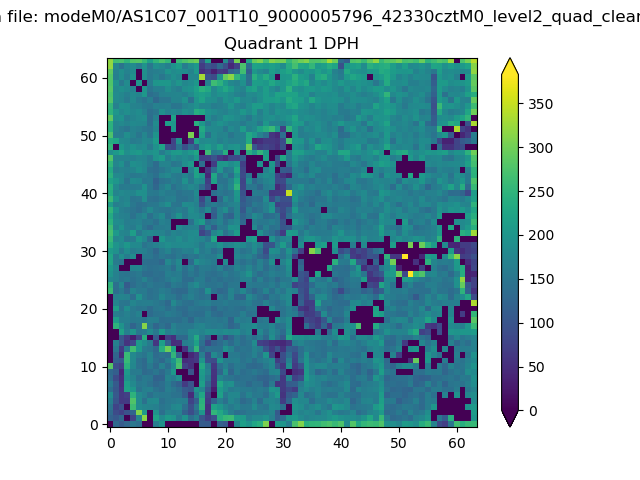 |
Quadrant B |
|---|---|---|---|
| Quadrant D | 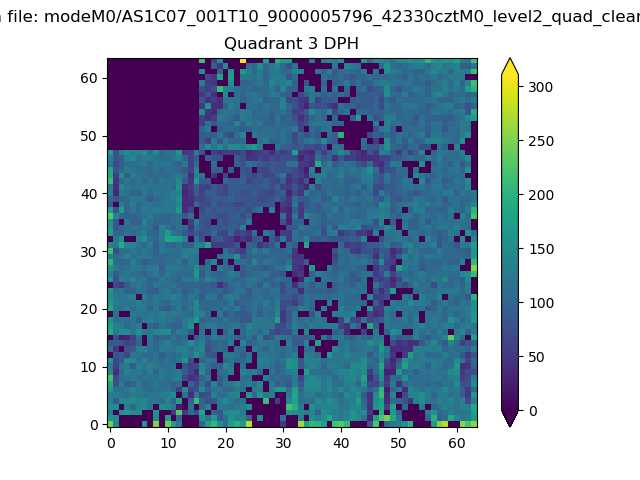 |
 |
Quadrant C |
| Plot type | Count rate plots | Images |
|---|---|---|
| Comparison with Poisson distribution Blue bars denote a histogram of data divided into 1 sec bins. Red curve is a Poisson curve with rate = median count rate of data. |
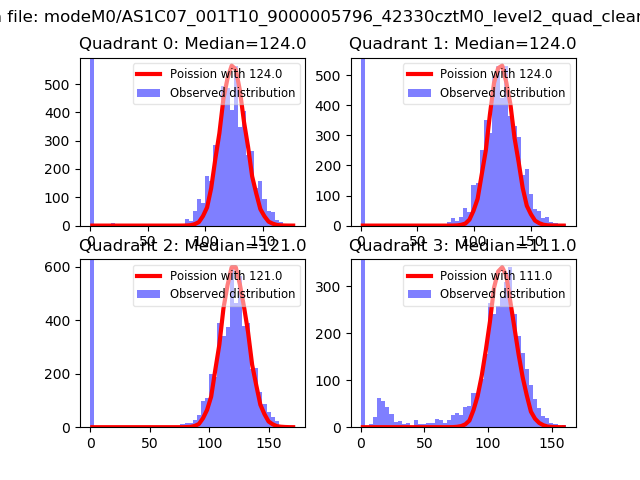 |
 |
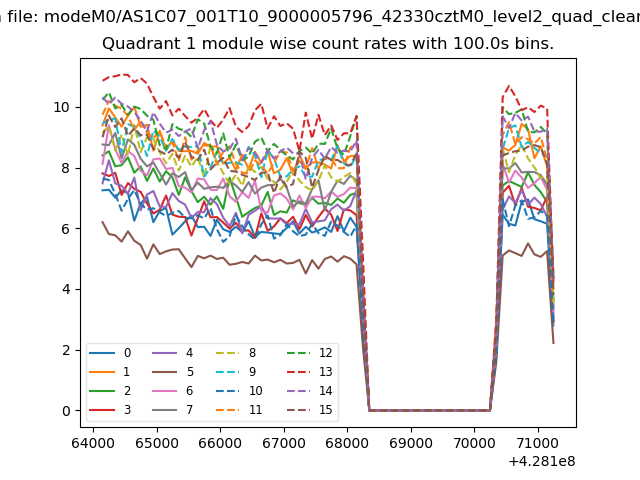
| Quadrant-wise count rates Data is divided into 100 sec bins |
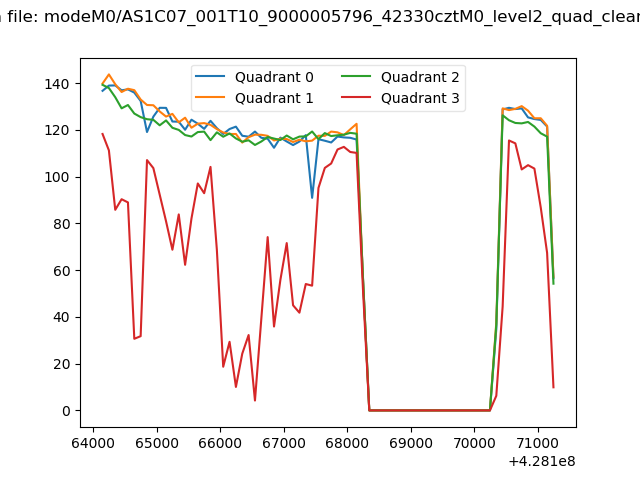 |
|
| Module-wise count rates for Quadrant A Data is divided into 100 sec bins |
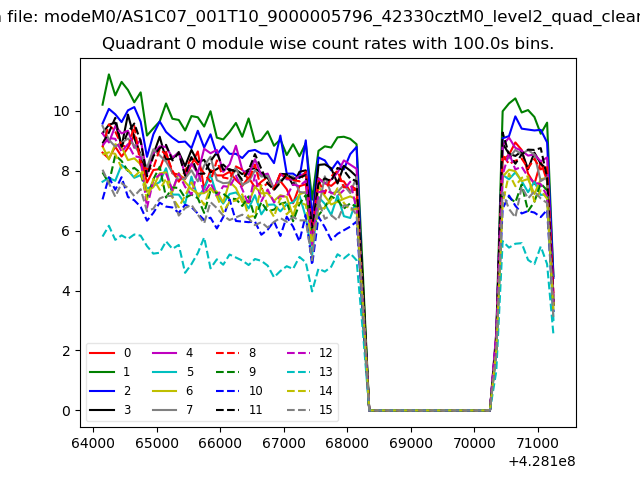 |
 |
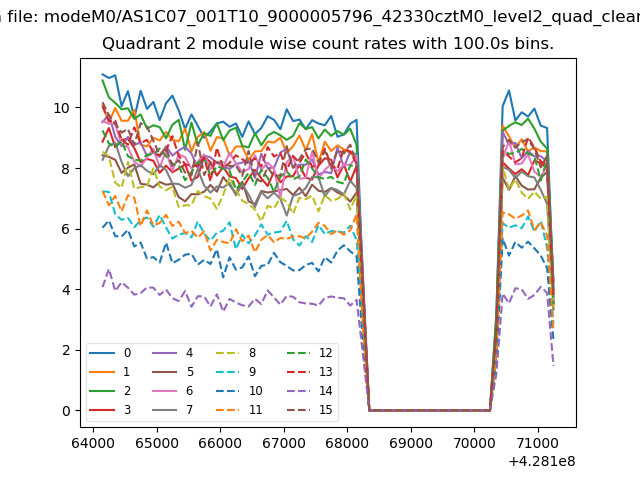
| Module-wise count rates for Quadrant B Data is divided into 100 sec bins |
 |
 |
| Module-wise count rates for Quadrant C Data is divided into 100 sec bins |
 |
 |
| Module-wise count rates for Quadrant D Data is divided into 100 sec bins |
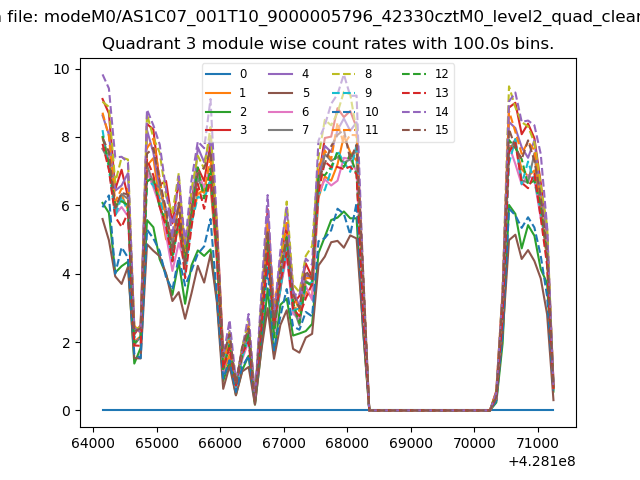 |
 |
| Parameter | Plot |
|---|---|
| CZT HV Monitor | 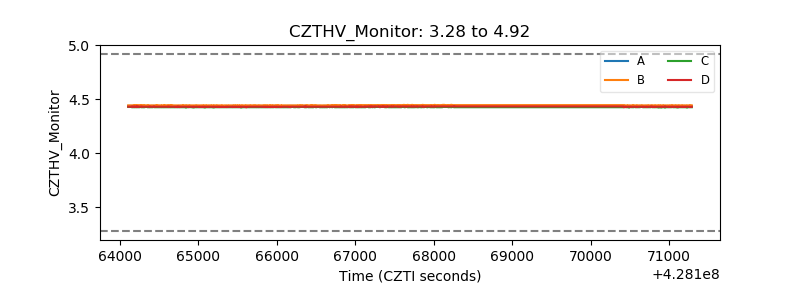 |
| D_VDD | 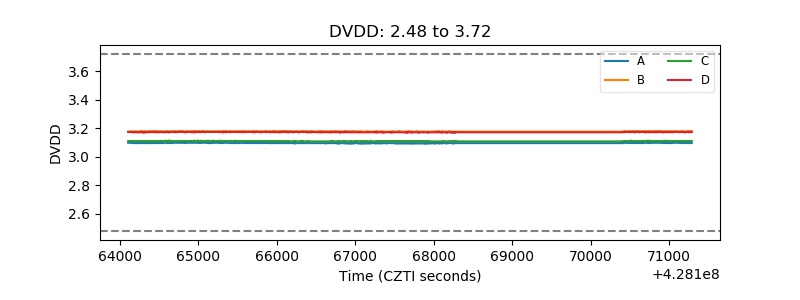 |
| Temperature 1 | 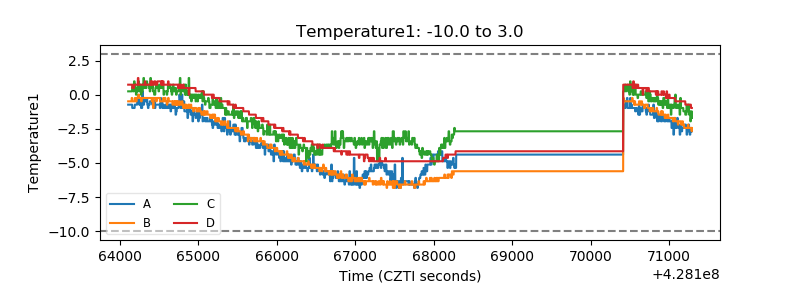 |
| Veto HV Monitor | 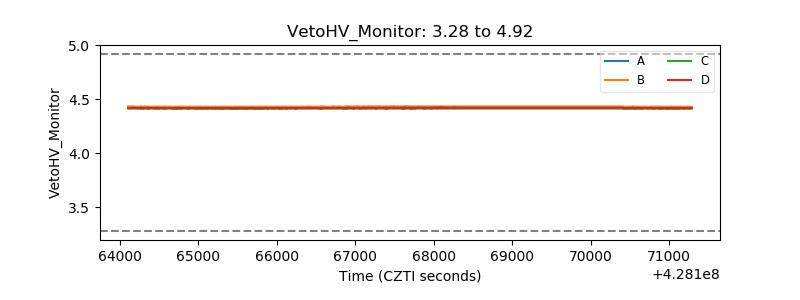 |
| Veto LLD | 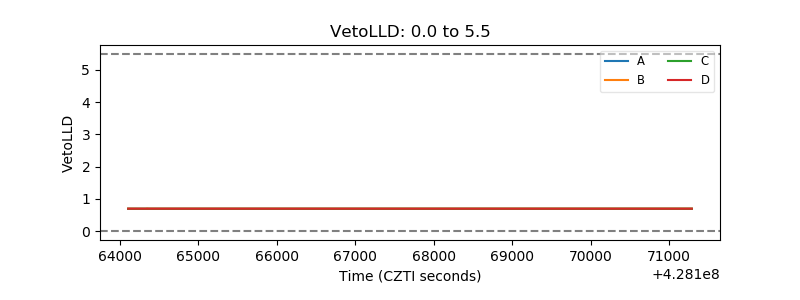 |
| Alpha Counter | 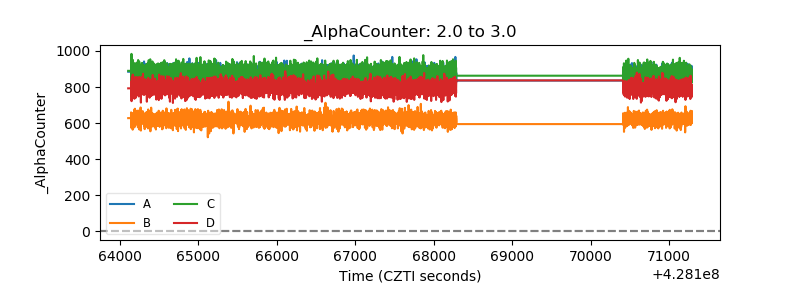 |
| _CPM_Rate | 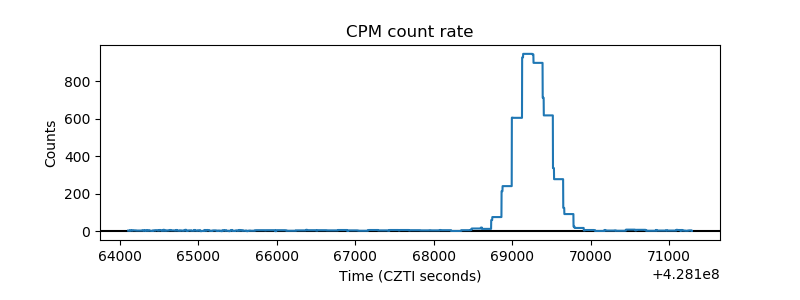 |
| CZT Counter | 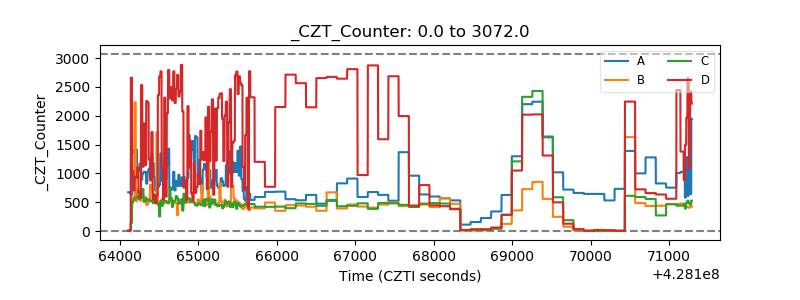 |
| +2.5 Volts monitor | 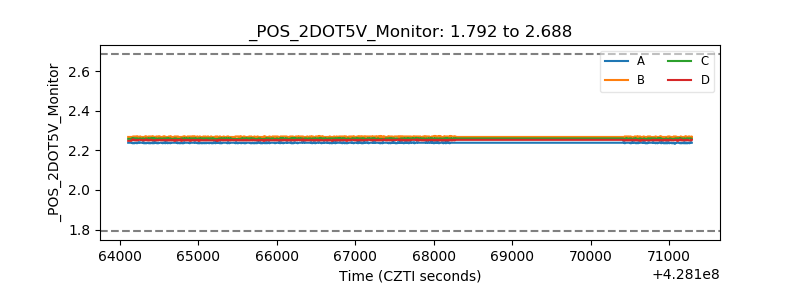 |
| +5 Volts monitor | 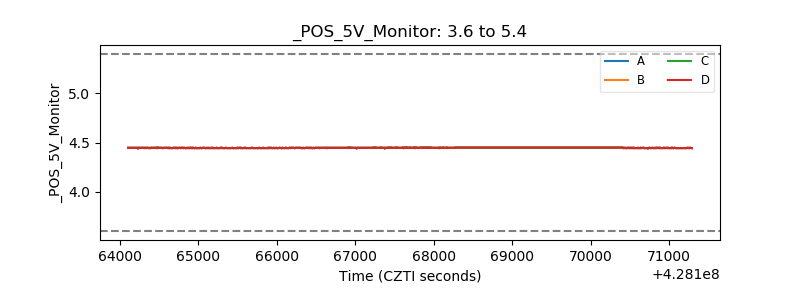 |
| _ROLL_ROT | 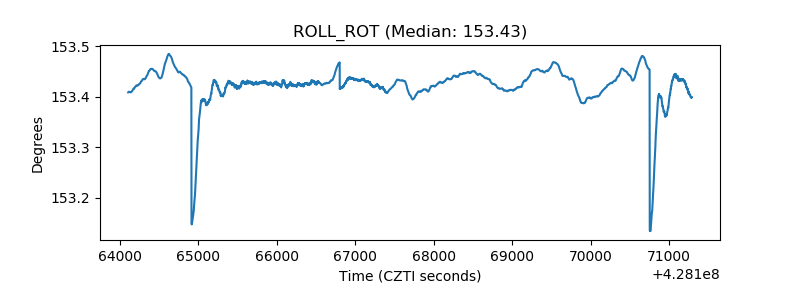 |
| _Roll_DEC | 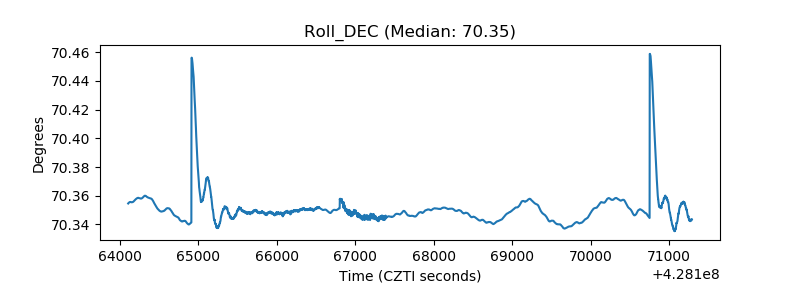 |
| _Roll_RA | 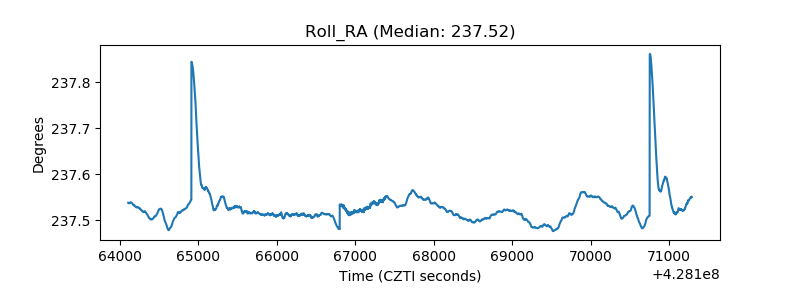 |
| Veto Counter | 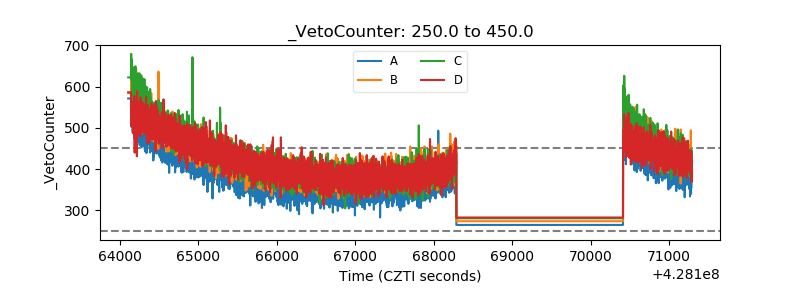 |