| Param | Original file | Final file |
|---|---|---|
| Filename | modeM0/AS1C07_001T10_9000005796_42331cztM0_level2.fits | modeM0/AS1C07_001T10_9000005796_42331cztM0_level2_quad_clean.evt |
| Size (bytes) | 348,773,760 | 84,507,840 |
| Size | 332.6 MB | 80.6 MB |
| Events in quadrant A | 3,598,796 | 573,698 |
| Events in quadrant B | 2,470,007 | 578,349 |
| Events in quadrant C | 2,351,531 | 568,057 |
| Events in quadrant D | 4,107,119 | 493,754 |
| Mode M0 | |||
|---|---|---|---|
| Quadrant | BADHDUFLAG | Total packets | Discarded packets |
| A | 0 | 14034 | 2 |
| B | 0 | 10813 | 2 |
| C | 0 | 10081 | 2 |
| D | 0 | 15636 | 2 |
| Mode SS | |||
|---|---|---|---|
| Quadrant | BADHDUFLAG | Total packets | Discarded packets |
| A | 0 | 100 | 0 |
| B | 0 | 100 | 0 |
| C | 0 | 100 | 0 |
| D | 0 | 100 | 0 |
| Mode M9 | |||
|---|---|---|---|
| Quadrant | BADHDUFLAG | Total packets | Discarded packets |
| A | 0 | 22 | 0 |
| B | 0 | 23 | 0 |
| C | 0 | 23 | 0 |
| D | 0 | 23 | 0 |
| Quadrant | Total seconds | Saturated seconds | Saturation percentage |
|---|---|---|---|
| A | 4921 | 39 | 0.792522% |
| B | 4921 | 42 | 0.853485% |
| C | 4921 | 6 | 0.121926% |
| D | 4921 | 415 | 8.433245% |
Noise dominated data is calculated using 1-second bins in cleaned event files. If a bin has >2000 counts, and if more than 50% of those come from <1% of pixels, then it is considered to be noise-dominated and hence unusable.
| Quadrant | # 1 sec bins | Bins with >0 counts | Bins with >2000 counts | High rate bins dominated by noise | Noise dominated (total time) | Noise dominated (detector-on time) | Marked lightcurve |
|---|---|---|---|---|---|---|---|
| A | 7044 | 4922 | 31 | 31 | 0.44% | 0.63% | 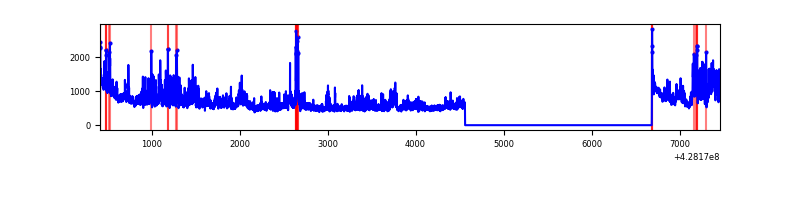 |
| B | 7044 | 4922 | 25 | 25 | 0.35% | 0.51% | 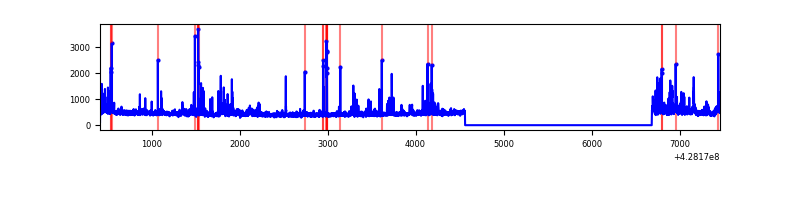 |
| C | 7044 | 4922 | 2 | 2 | 0.03% | 0.04% | 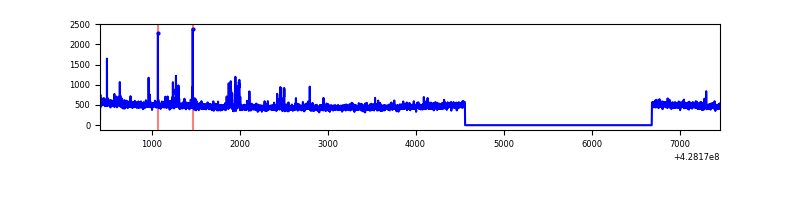 |
| D | 7044 | 4922 | 365 | 365 | 5.18% | 7.42% | 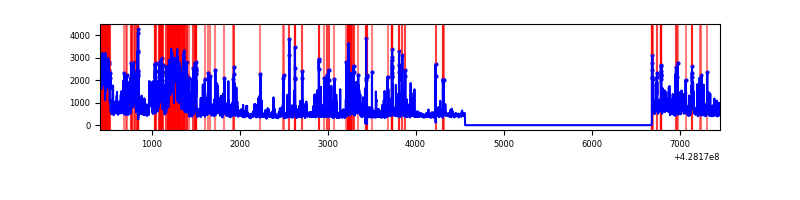 |
Top three noisy pixels from each quadrant. If the there are fewer than three noisy pixels in the level2.evt file, extra rows are filled as -1
| Pixel properties | Quadrant properties | ||||||
|---|---|---|---|---|---|---|---|
| Quadrant | DetID | PixID | Counts | Sigma | Mean | Median | Sigma |
| A | 15 | 223 | 902346 | 8373.87 | 531 | 521 | 107.7 |
| A | 10 | 83 | 596210 | 5531.25 | 531 | 521 | 107.7 |
| A | 7 | 3 | 33797 | 308.98 | 531 | 521 | 107.7 |
| B | 0 | 229 | 131797 | 1291.85 | 531 | 517 | 101.6 |
| B | 5 | 255 | 57361 | 559.37 | 531 | 517 | 101.6 |
| B | 0 | 230 | 53568 | 522.04 | 531 | 517 | 101.6 |
| C | 15 | 214 | 207234 | 1674.97 | 531 | 534 | 123.4 |
| C | 15 | 159 | 44058 | 352.69 | 531 | 534 | 123.4 |
| C | 15 | 111 | 22415 | 177.31 | 531 | 534 | 123.4 |
| D | 1 | 52 | 712040 | 5711.69 | 512 | 497 | 124.6 |
| D | 5 | 32 | 502582 | 4030.33 | 512 | 497 | 124.6 |
| D | 2 | 249 | 278622 | 2232.56 | 512 | 497 | 124.6 |
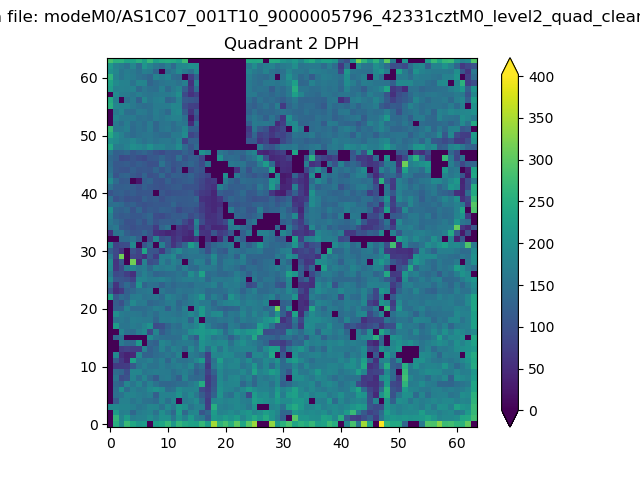
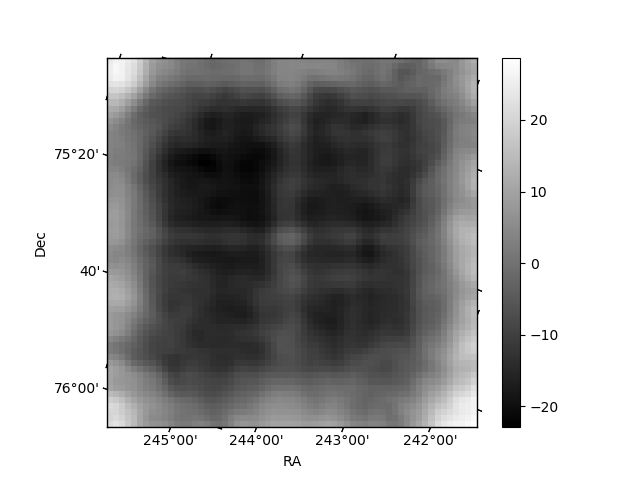
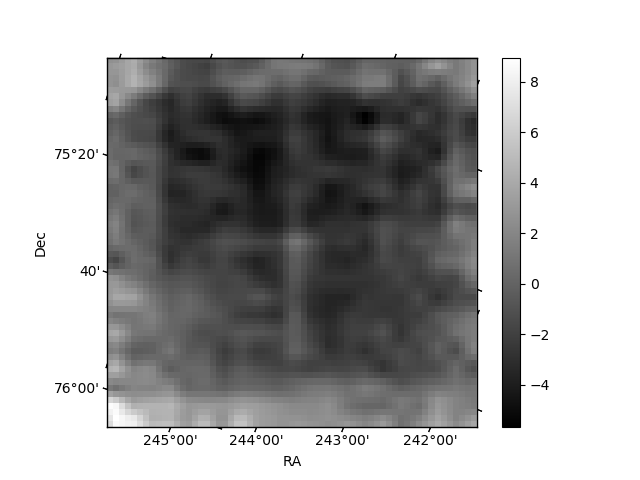
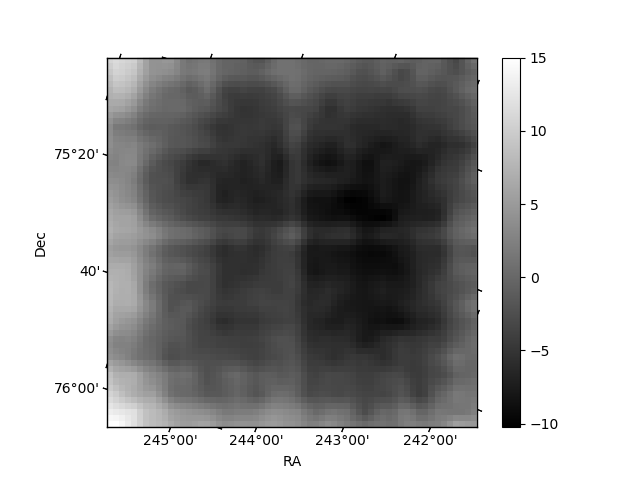
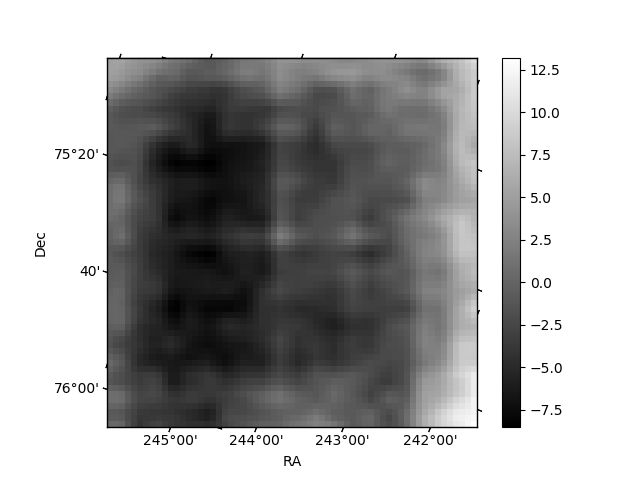
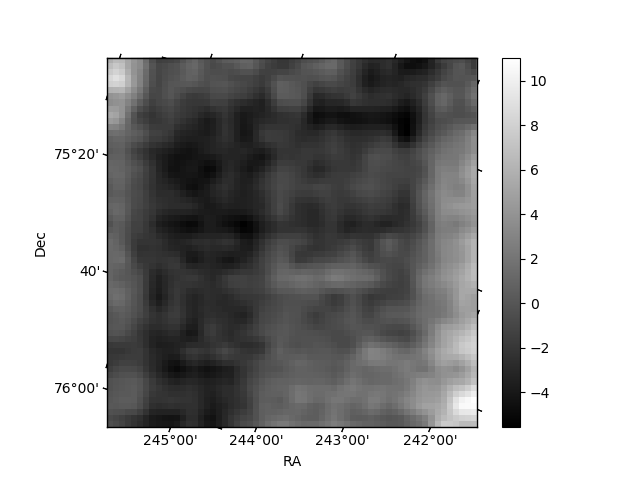
Histogram calculated using DETX and DETY for each event in the final _common_clean file
| Quadrant A | 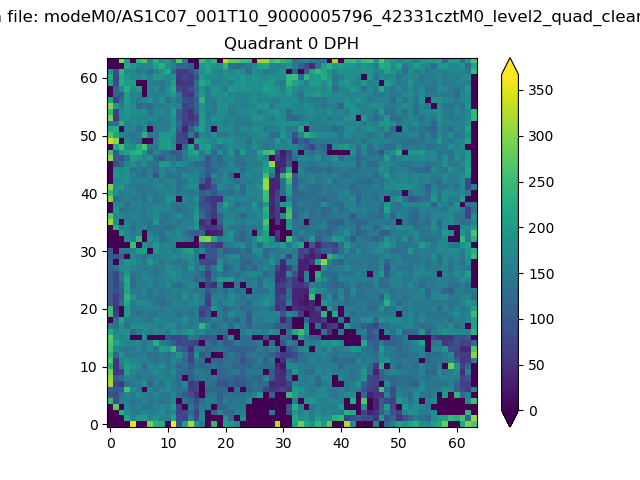 |
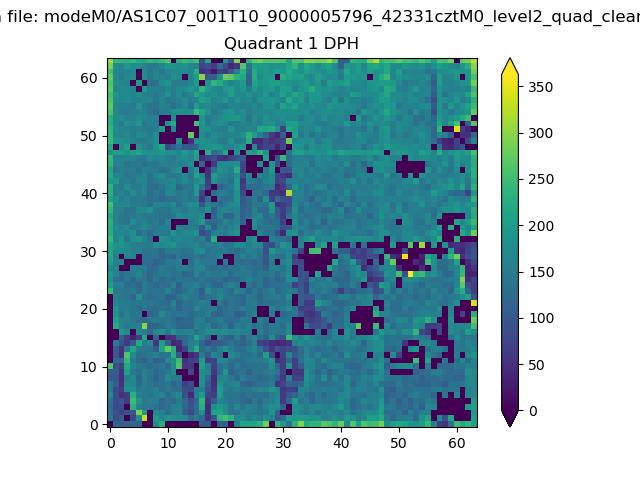 |
Quadrant B |
|---|---|---|---|
| Quadrant D | 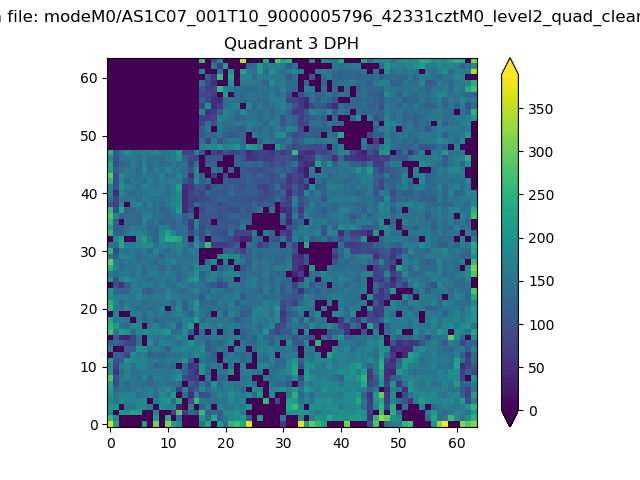 |
 |
Quadrant C |
| Plot type | Count rate plots | Images |
|---|---|---|
| Comparison with Poisson distribution Blue bars denote a histogram of data divided into 1 sec bins. Red curve is a Poisson curve with rate = median count rate of data. |
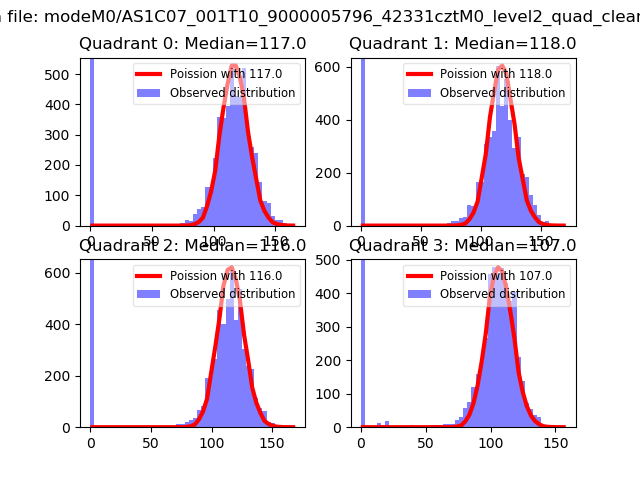 |
 |
| Quadrant-wise count rates Data is divided into 100 sec bins |
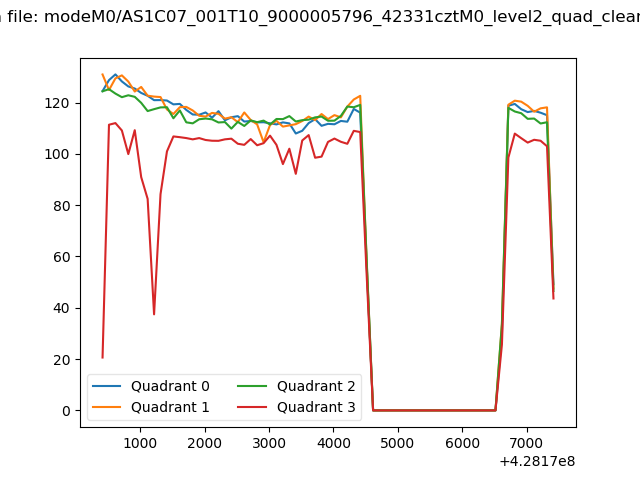 |
|
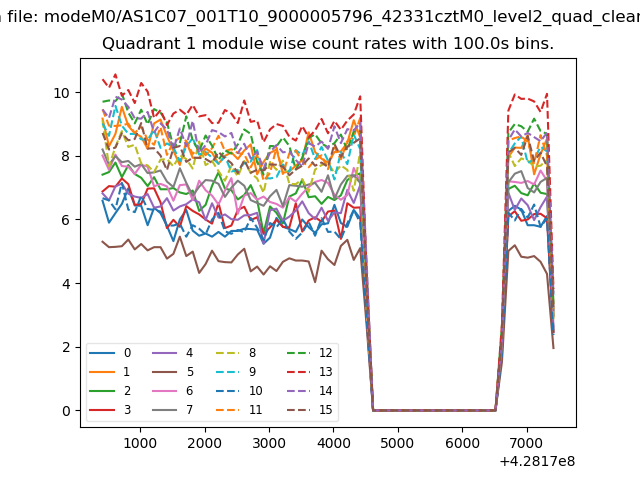
| Module-wise count rates for Quadrant A Data is divided into 100 sec bins |
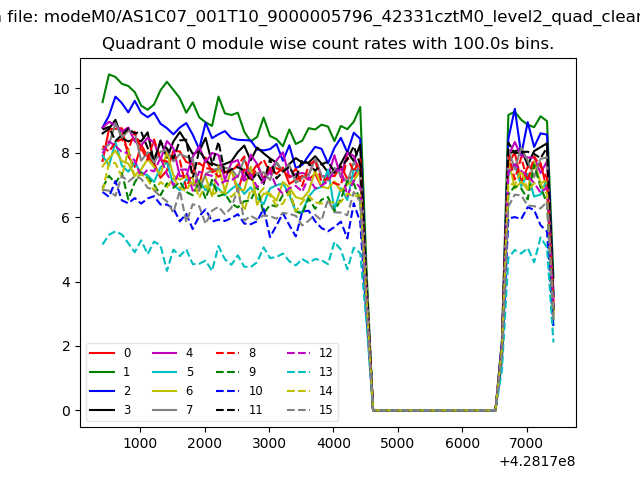 |
 |
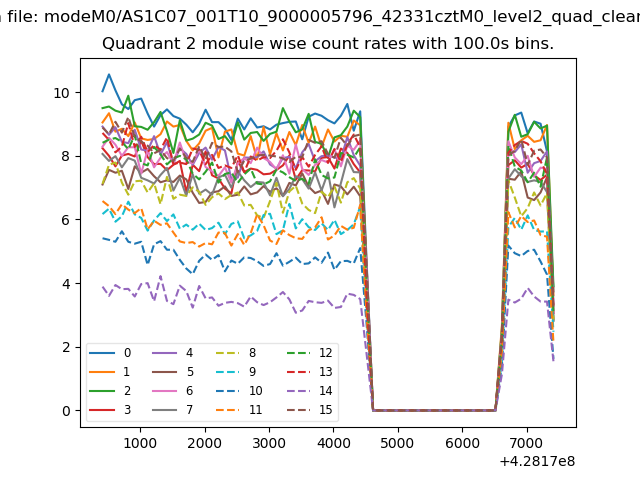
| Module-wise count rates for Quadrant B Data is divided into 100 sec bins |
 |
 |
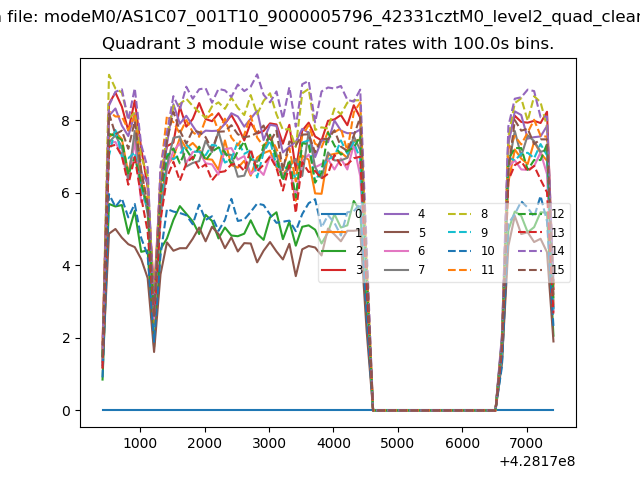
| Module-wise count rates for Quadrant C Data is divided into 100 sec bins |
 |
 |
| Module-wise count rates for Quadrant D Data is divided into 100 sec bins |
 |
 |
| Parameter | Plot |
|---|---|
| CZT HV Monitor | 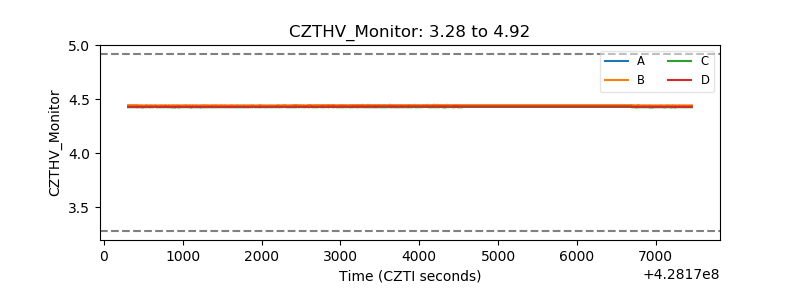 |
| D_VDD | 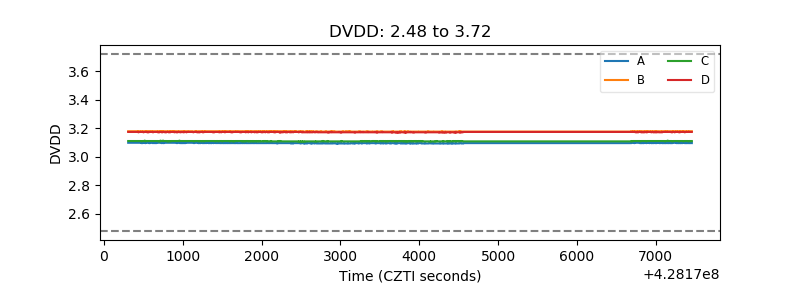 |
| Temperature 1 | 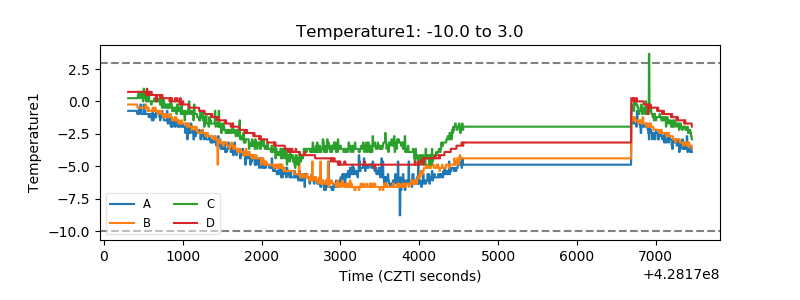 |
| Veto HV Monitor | 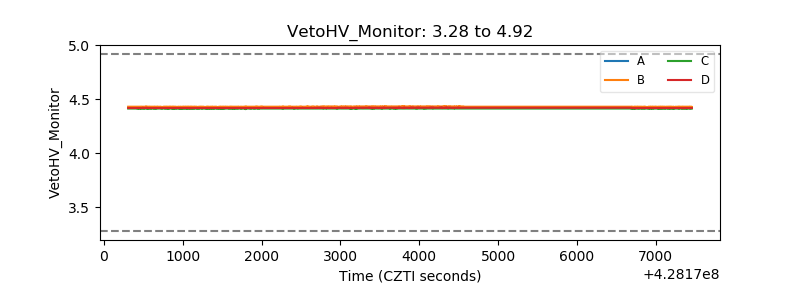 |
| Veto LLD | 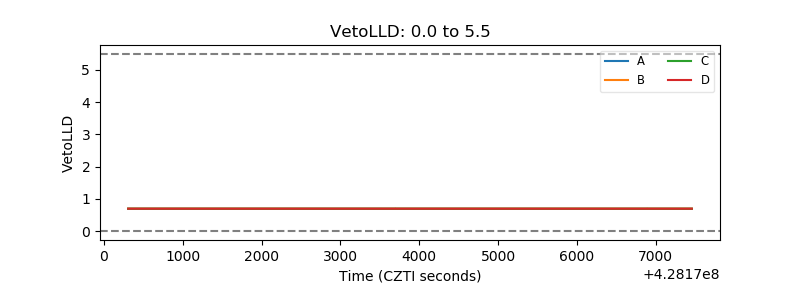 |
| Alpha Counter | 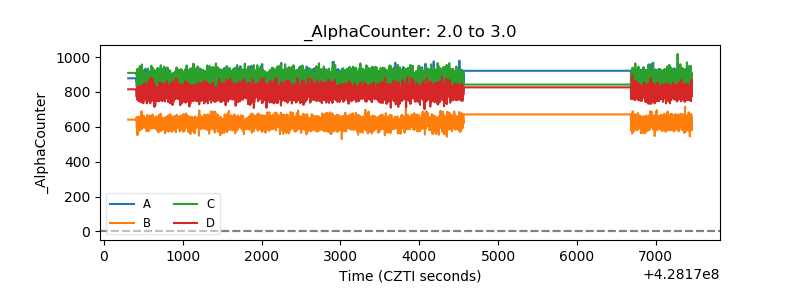 |
| _CPM_Rate | 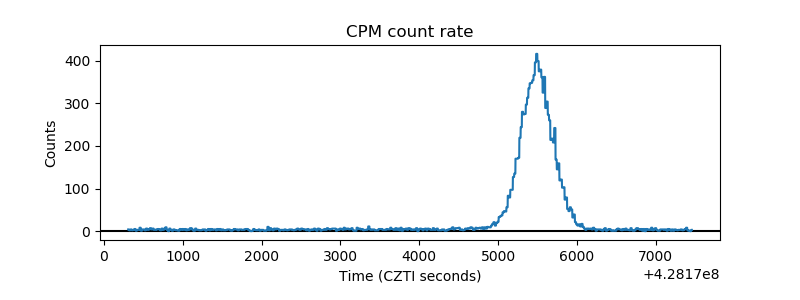 |
| CZT Counter | 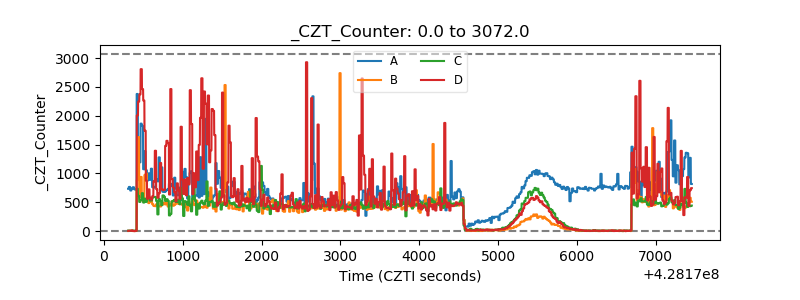 |
| +2.5 Volts monitor | 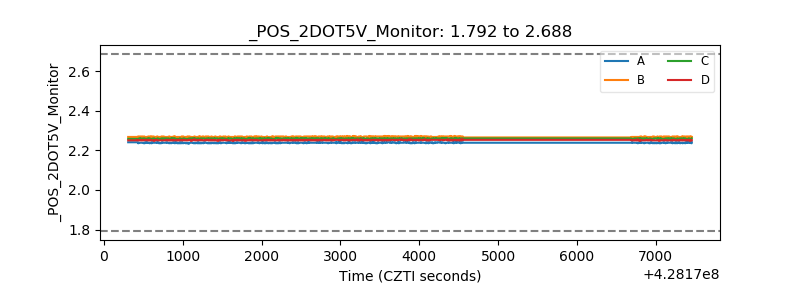 |
| +5 Volts monitor | 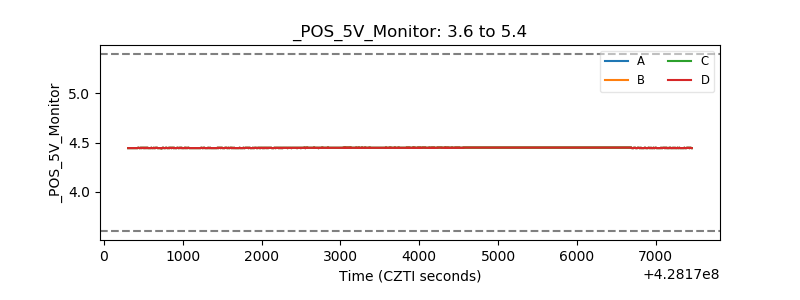 |
| _ROLL_ROT | 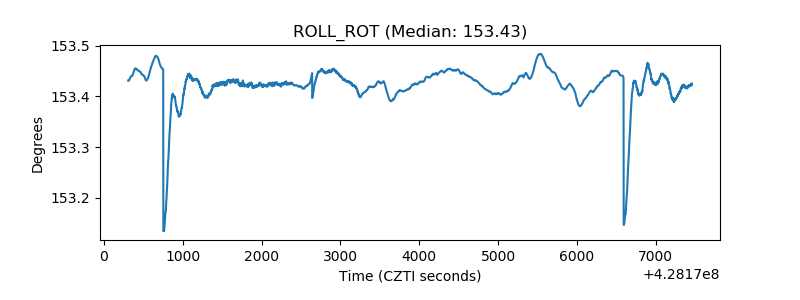 |
| _Roll_DEC | 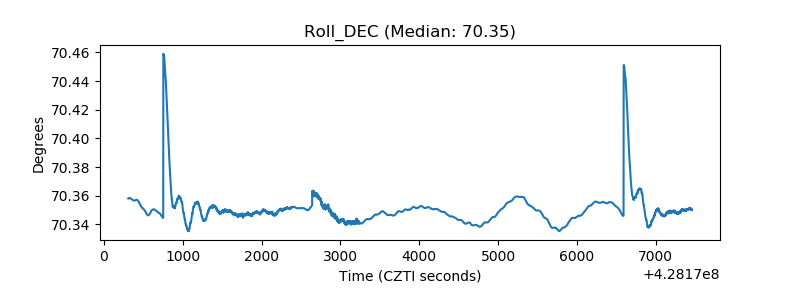 |
| _Roll_RA | 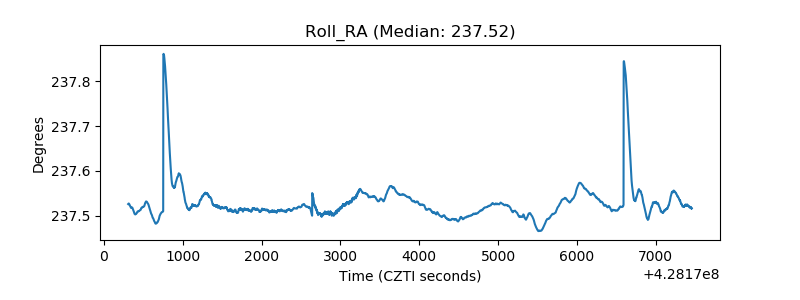 |
| Veto Counter | 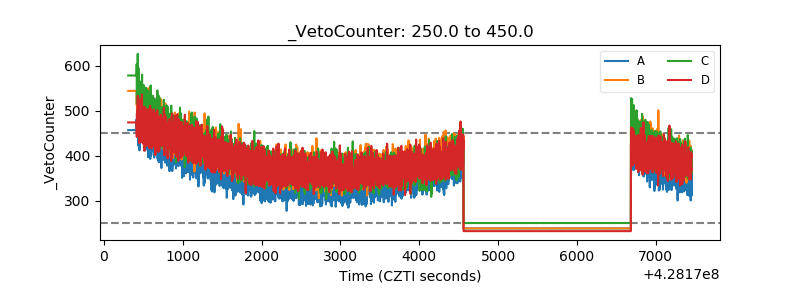 |