| Param | Original file | Final file |
|---|---|---|
| Filename | modeM0/AS1C07_001T10_9000005796_42332cztM0_level2.fits | modeM0/AS1C07_001T10_9000005796_42332cztM0_level2_quad_clean.evt |
| Size (bytes) | 331,951,680 | 85,345,920 |
| Size | 316.6 MB | 81.4 MB |
| Events in quadrant A | 3,554,085 | 569,175 |
| Events in quadrant B | 2,499,792 | 573,360 |
| Events in quadrant C | 2,320,996 | 565,098 |
| Events in quadrant D | 3,514,224 | 517,841 |
| Mode M0 | |||
|---|---|---|---|
| Quadrant | BADHDUFLAG | Total packets | Discarded packets |
| A | 0 | 13981 | 3 |
| B | 0 | 11101 | 2 |
| C | 0 | 10302 | 2 |
| D | 0 | 13994 | 2 |
| Mode SS | |||
|---|---|---|---|
| Quadrant | BADHDUFLAG | Total packets | Discarded packets |
| A | 0 | 104 | 0 |
| B | 0 | 104 | 0 |
| C | 0 | 104 | 0 |
| D | 0 | 104 | 0 |
| Mode M9 | |||
|---|---|---|---|
| Quadrant | BADHDUFLAG | Total packets | Discarded packets |
| A | 0 | 27 | 0 |
| B | 0 | 28 | 0 |
| C | 0 | 28 | 0 |
| D | 0 | 28 | 0 |
| Quadrant | Total seconds | Saturated seconds | Saturation percentage |
|---|---|---|---|
| A | 5119 | 26 | 0.507912% |
| B | 5119 | 41 | 0.800938% |
| C | 5119 | 3 | 0.058605% |
| D | 5119 | 170 | 3.320961% |
Noise dominated data is calculated using 1-second bins in cleaned event files. If a bin has >2000 counts, and if more than 50% of those come from <1% of pixels, then it is considered to be noise-dominated and hence unusable.
| Quadrant | # 1 sec bins | Bins with >0 counts | Bins with >2000 counts | High rate bins dominated by noise | Noise dominated (total time) | Noise dominated (detector-on time) | Marked lightcurve |
|---|---|---|---|---|---|---|---|
| A | 7092 | 5120 | 13 | 13 | 0.18% | 0.25% | 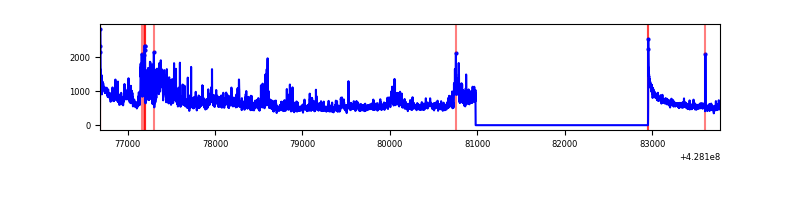 |
| B | 7092 | 5120 | 23 | 23 | 0.32% | 0.45% | 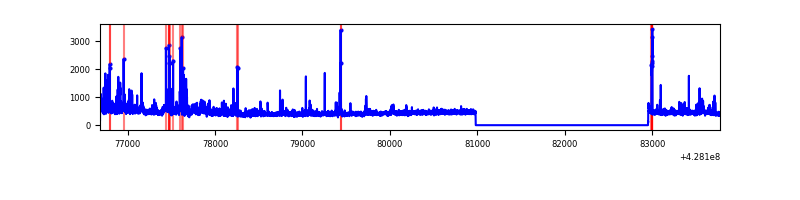 |
| C | 7092 | 5120 | 0 | 0 | 0.00% | 0.00% | 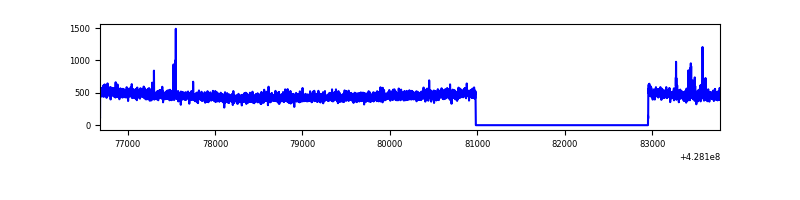 |
| D | 7092 | 5120 | 180 | 180 | 2.54% | 3.52% | 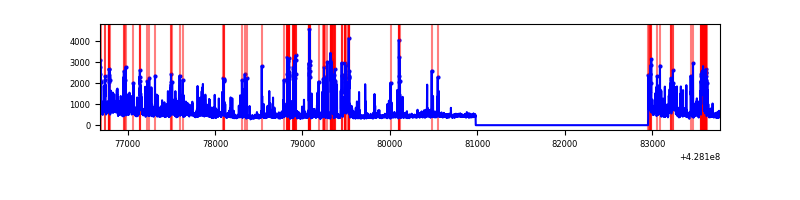 |
Top three noisy pixels from each quadrant. If the there are fewer than three noisy pixels in the level2.evt file, extra rows are filled as -1
| Pixel properties | Quadrant properties | ||||||
|---|---|---|---|---|---|---|---|
| Quadrant | DetID | PixID | Counts | Sigma | Mean | Median | Sigma |
| A | 15 | 223 | 825755 | 7485.54 | 536 | 525 | 110.2 |
| A | 10 | 83 | 587308 | 5322.62 | 536 | 525 | 110.2 |
| A | 13 | 248 | 44925 | 402.75 | 536 | 525 | 110.2 |
| B | 0 | 230 | 107868 | 1043.79 | 537 | 522 | 102.8 |
| B | 5 | 255 | 65306 | 629.93 | 537 | 522 | 102.8 |
| B | 5 | 252 | 57242 | 551.52 | 537 | 522 | 102.8 |
| C | 15 | 214 | 212750 | 1692.75 | 534 | 536 | 125.4 |
| C | 15 | 111 | 10141 | 76.62 | 534 | 536 | 125.4 |
| C | 7 | 247 | 7368 | 54.5 | 534 | 536 | 125.4 |
| D | 1 | 52 | 563692 | 4334.46 | 527 | 513 | 129.9 |
| D | 12 | 6 | 188443 | 1446.39 | 527 | 513 | 129.9 |
| D | 12 | 218 | 165468 | 1269.56 | 527 | 513 | 129.9 |
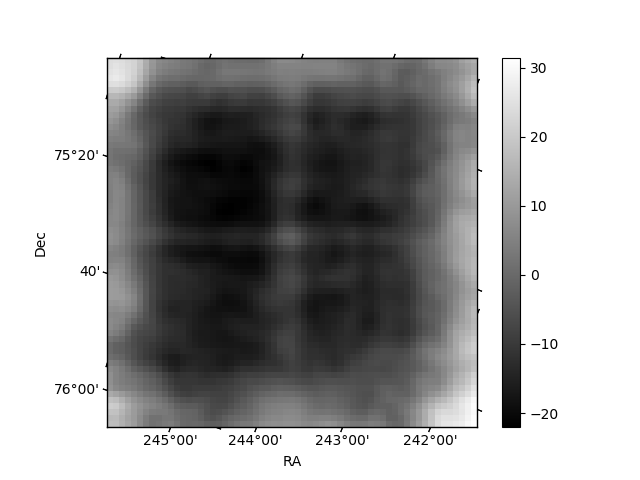
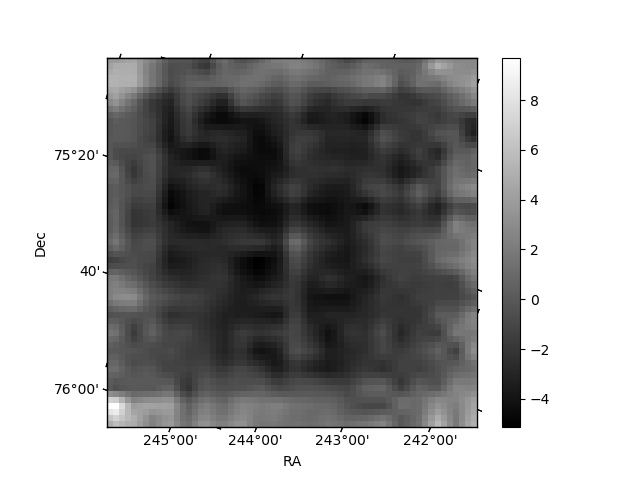
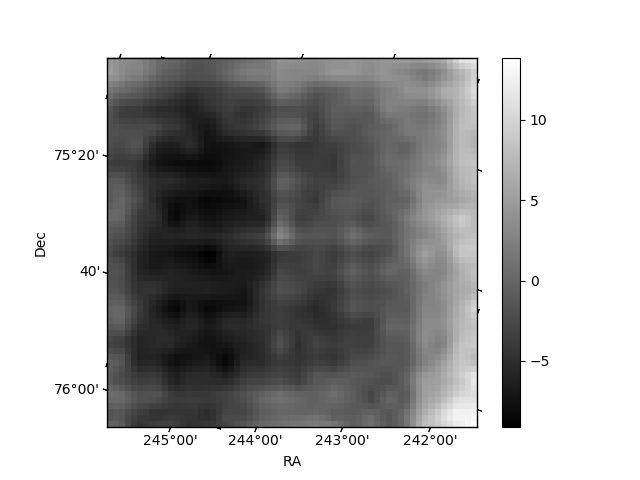
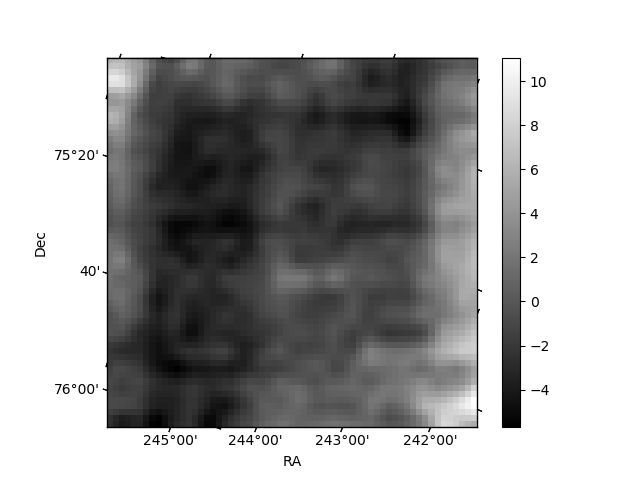
Histogram calculated using DETX and DETY for each event in the final _common_clean file
| Quadrant A | 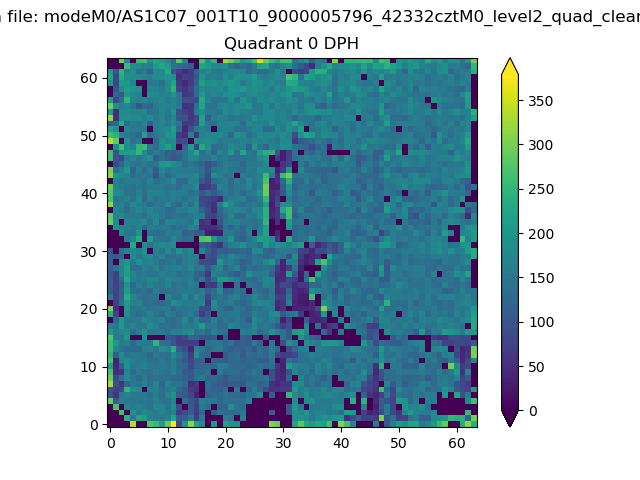 |
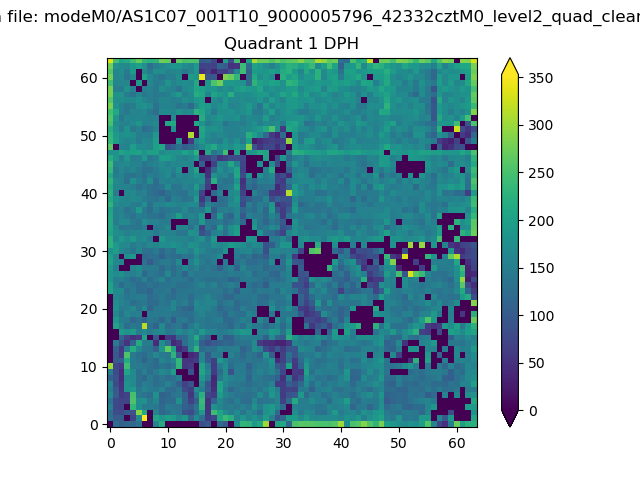 |
Quadrant B |
|---|---|---|---|
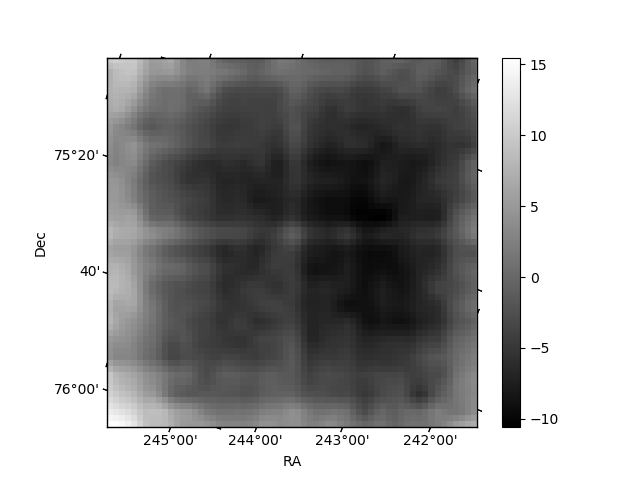
| Quadrant D | 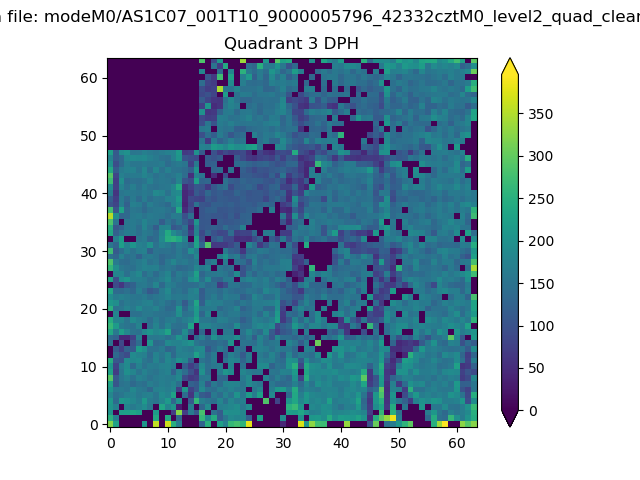 |
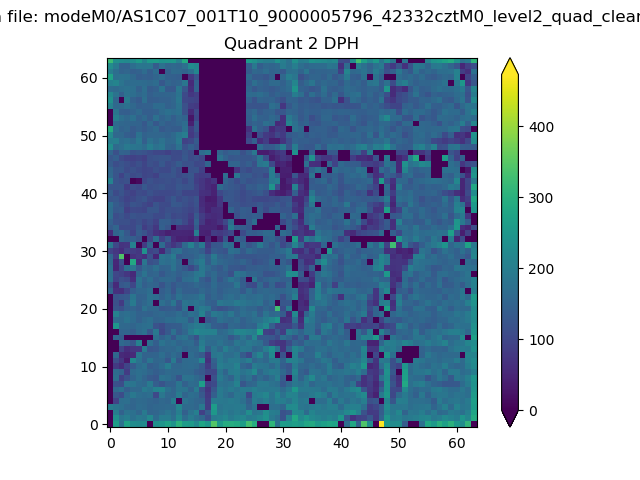 |
Quadrant C |
| Plot type | Count rate plots | Images |
|---|---|---|
| Comparison with Poisson distribution Blue bars denote a histogram of data divided into 1 sec bins. Red curve is a Poisson curve with rate = median count rate of data. |
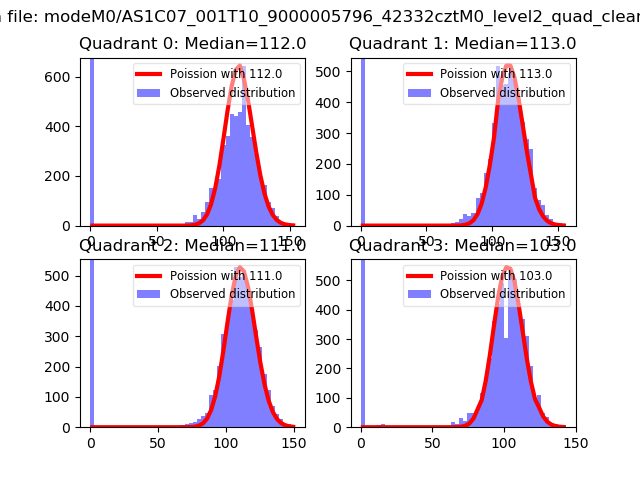 |
 |
| Quadrant-wise count rates Data is divided into 100 sec bins |
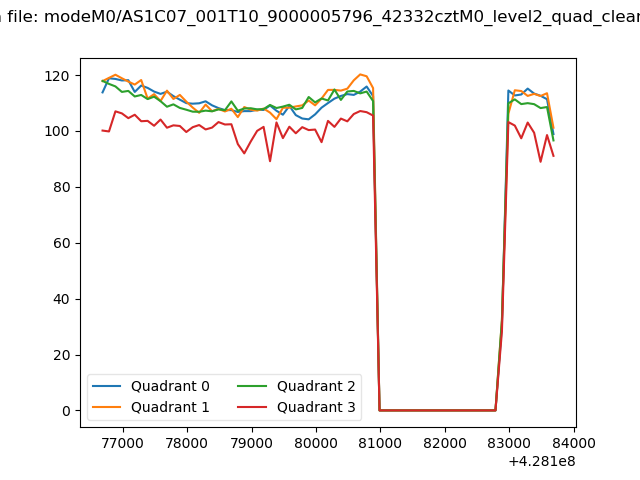 |
|
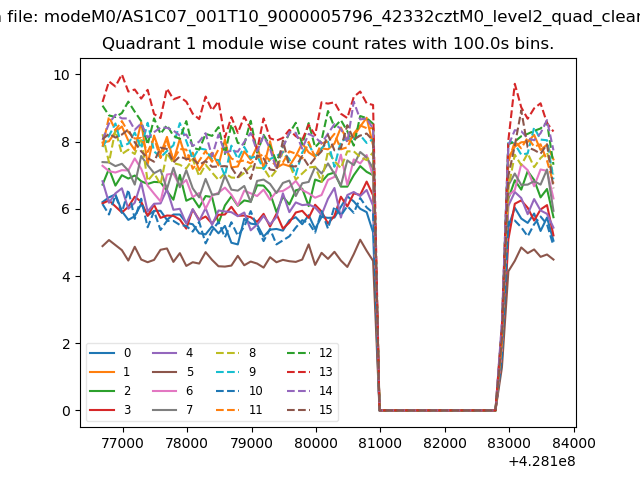
| Module-wise count rates for Quadrant A Data is divided into 100 sec bins |
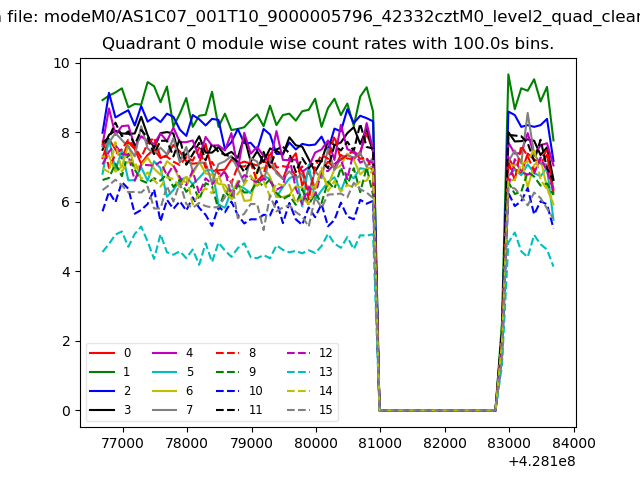 |
 |
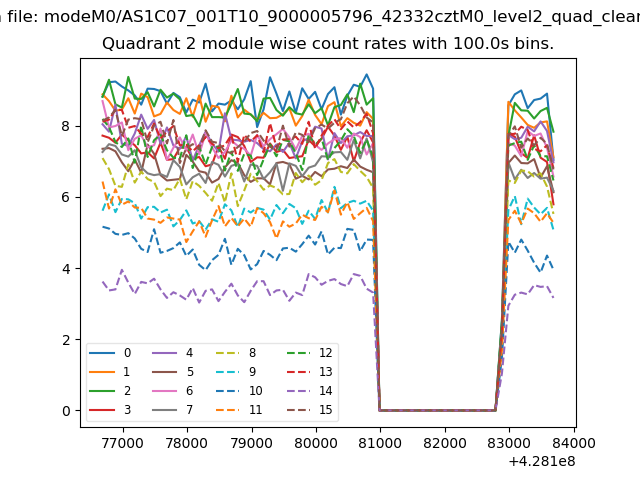
| Module-wise count rates for Quadrant B Data is divided into 100 sec bins |
 |
 |
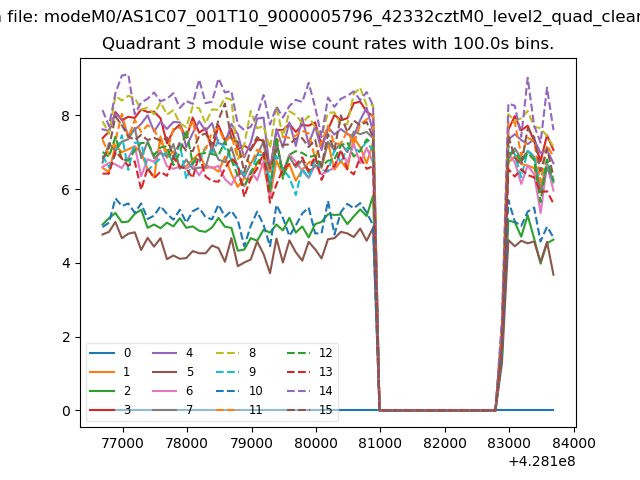
| Module-wise count rates for Quadrant C Data is divided into 100 sec bins |
 |
 |
| Module-wise count rates for Quadrant D Data is divided into 100 sec bins |
 |
 |
| Parameter | Plot |
|---|---|
| CZT HV Monitor | 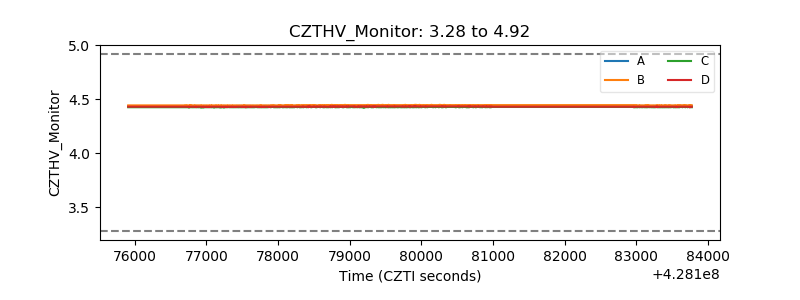 |
| D_VDD | 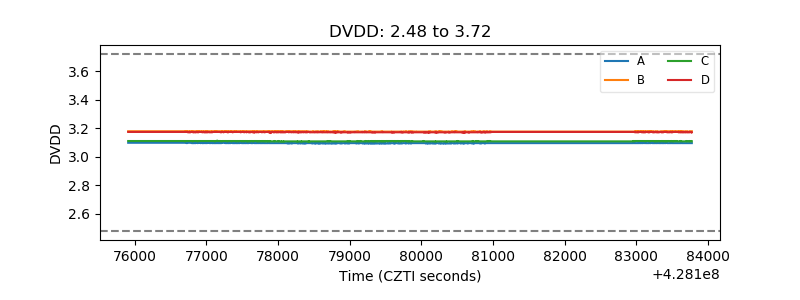 |
| Temperature 1 | 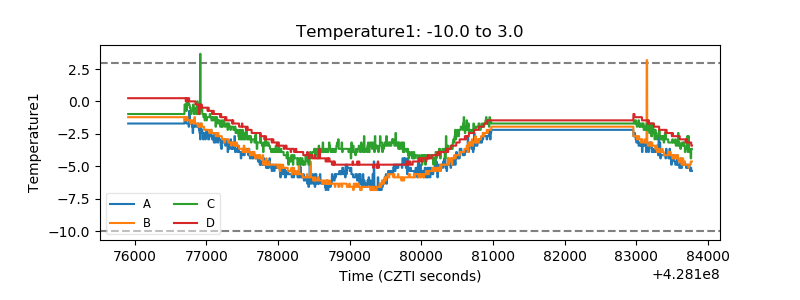 |
| Veto HV Monitor |  |
| Veto LLD | 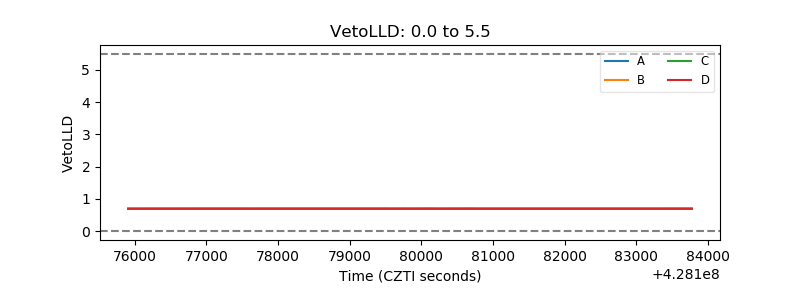 |
| Alpha Counter | 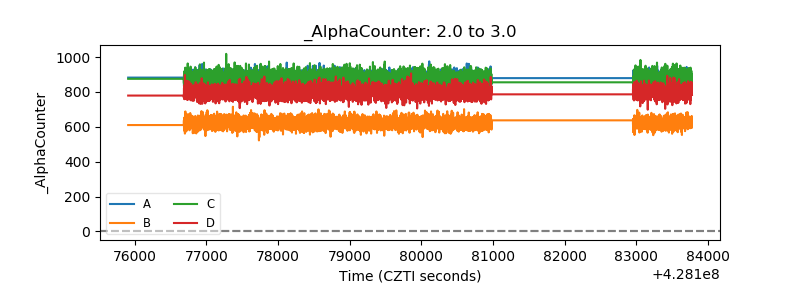 |
| _CPM_Rate | 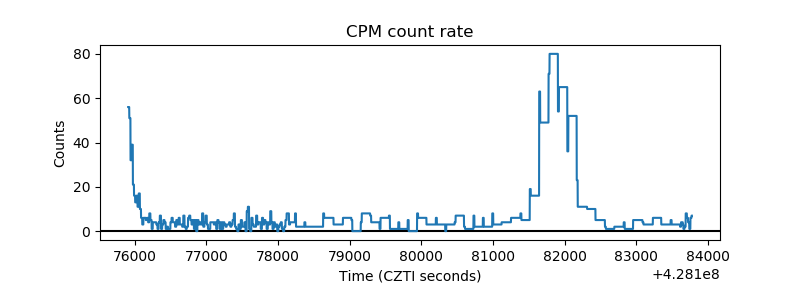 |
| CZT Counter | 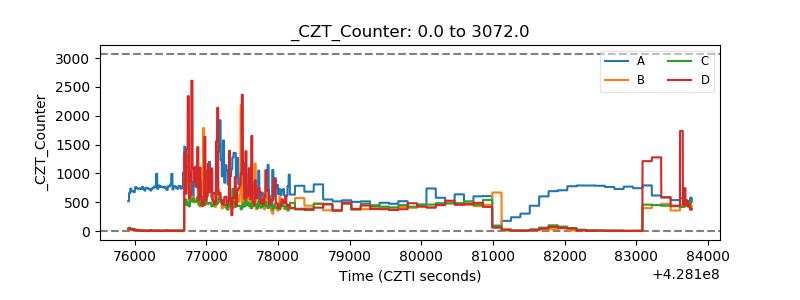 |
| +2.5 Volts monitor | 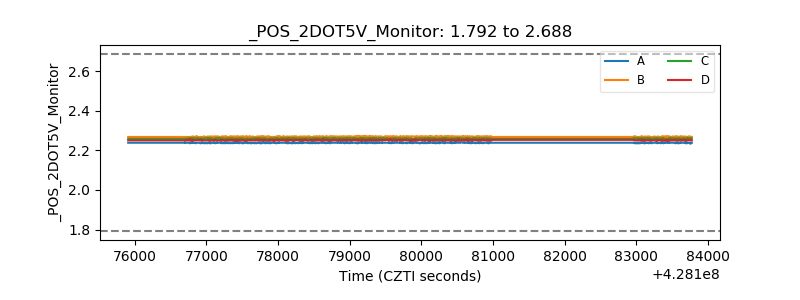 |
| +5 Volts monitor | 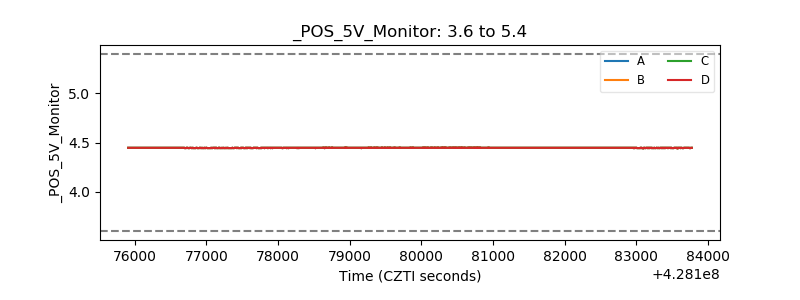 |
| _ROLL_ROT | 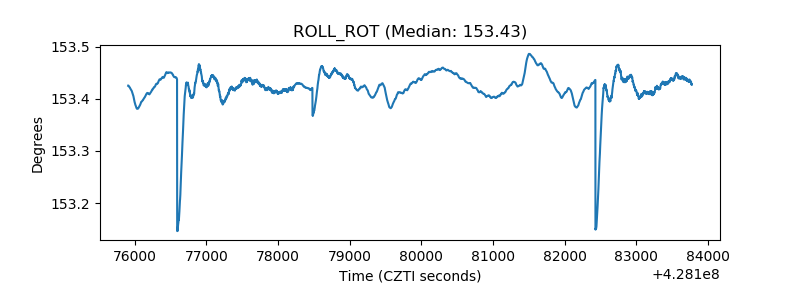 |
| _Roll_DEC | 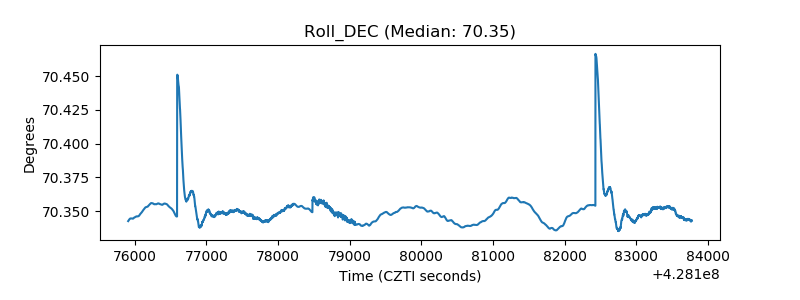 |
| _Roll_RA | 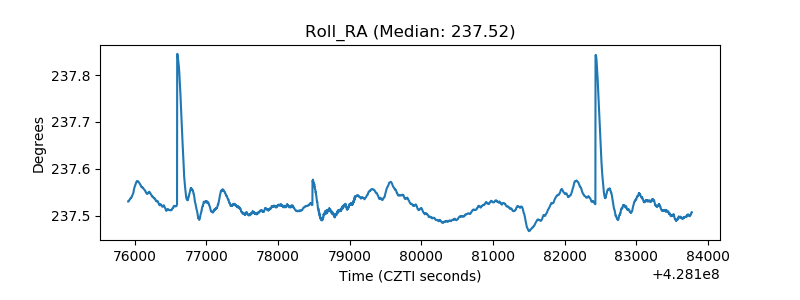 |
| Veto Counter | 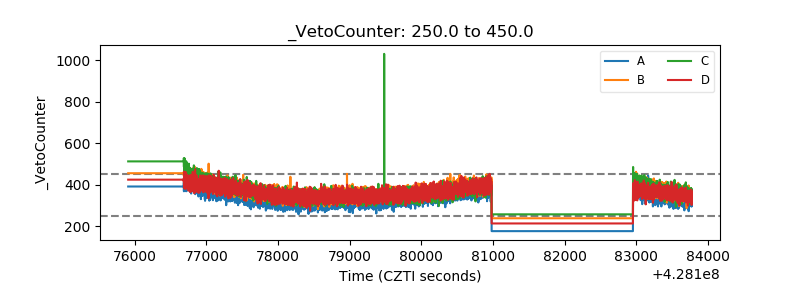 |