| Param | Original file | Final file |
|---|---|---|
| Filename | modeM0/AS1C07_001T10_9000005796_42333cztM0_level2.fits | modeM0/AS1C07_001T10_9000005796_42333cztM0_level2_quad_clean.evt |
| Size (bytes) | 329,417,280 | 88,021,440 |
| Size | 314.2 MB | 83.9 MB |
| Events in quadrant A | 2,994,335 | 584,373 |
| Events in quadrant B | 2,553,491 | 589,132 |
| Events in quadrant C | 2,424,633 | 581,588 |
| Events in quadrant D | 3,800,813 | 531,854 |
| Mode M0 | |||
|---|---|---|---|
| Quadrant | BADHDUFLAG | Total packets | Discarded packets |
| A | 0 | 12276 | 3 |
| B | 0 | 11554 | 2 |
| C | 0 | 10890 | 2 |
| D | 0 | 15150 | 2 |
| Mode SS | |||
|---|---|---|---|
| Quadrant | BADHDUFLAG | Total packets | Discarded packets |
| A | 0 | 110 | 0 |
| B | 0 | 110 | 0 |
| C | 0 | 110 | 0 |
| D | 0 | 110 | 0 |
| Mode M9 | |||
|---|---|---|---|
| Quadrant | BADHDUFLAG | Total packets | Discarded packets |
| A | 0 | 30 | 0 |
| B | 0 | 31 | 0 |
| C | 0 | 31 | 0 |
| D | 0 | 31 | 0 |
| Quadrant | Total seconds | Saturated seconds | Saturation percentage |
|---|---|---|---|
| A | 5402 | 25 | 0.462792% |
| B | 5402 | 53 | 0.981118% |
| C | 5402 | 5 | 0.092558% |
| D | 5402 | 159 | 2.943354% |
Noise dominated data is calculated using 1-second bins in cleaned event files. If a bin has >2000 counts, and if more than 50% of those come from <1% of pixels, then it is considered to be noise-dominated and hence unusable.
| Quadrant | # 1 sec bins | Bins with >0 counts | Bins with >2000 counts | High rate bins dominated by noise | Noise dominated (total time) | Noise dominated (detector-on time) | Marked lightcurve |
|---|---|---|---|---|---|---|---|
| A | 7016 | 5403 | 14 | 14 | 0.20% | 0.26% | 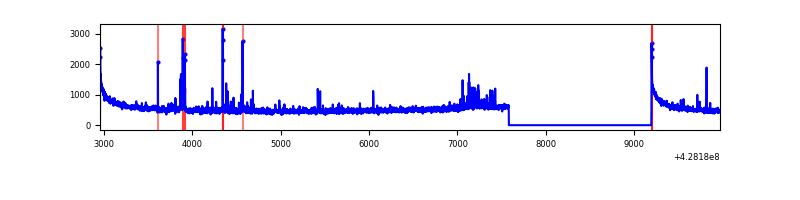 |
| B | 7016 | 5403 | 30 | 30 | 0.43% | 0.56% | 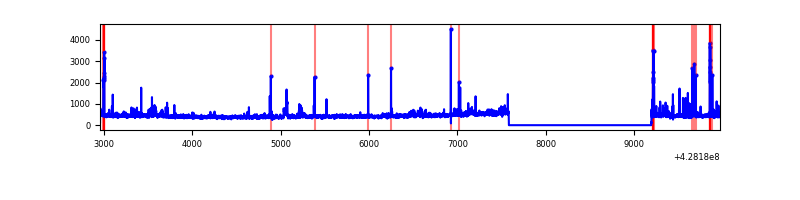 |
| C | 7016 | 5403 | 1 | 1 | 0.01% | 0.02% | 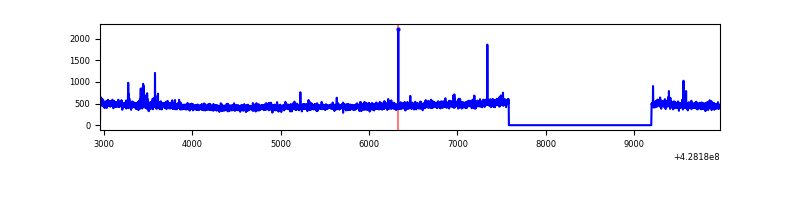 |
| D | 7016 | 5403 | 164 | 164 | 2.34% | 3.04% | 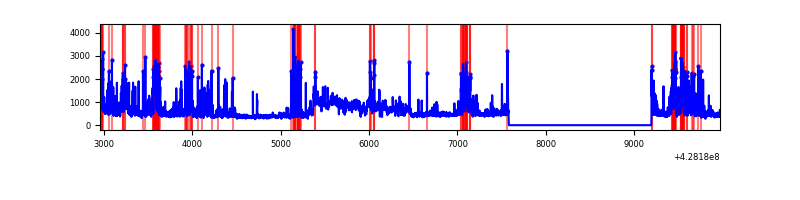 |
Top three noisy pixels from each quadrant. If the there are fewer than three noisy pixels in the level2.evt file, extra rows are filled as -1
| Pixel properties | Quadrant properties | ||||||
|---|---|---|---|---|---|---|---|
| Quadrant | DetID | PixID | Counts | Sigma | Mean | Median | Sigma |
| A | 10 | 83 | 592095 | 5076.89 | 564 | 553 | 116.5 |
| A | 15 | 223 | 122709 | 1048.4 | 564 | 553 | 116.5 |
| A | 13 | 248 | 41529 | 351.68 | 564 | 553 | 116.5 |
| B | 3 | 112 | 90321 | 830.4 | 561 | 547 | 108.1 |
| B | 5 | 172 | 85485 | 785.67 | 561 | 547 | 108.1 |
| B | 0 | 245 | 62207 | 570.35 | 561 | 547 | 108.1 |
| C | 15 | 214 | 223073 | 1701.55 | 557 | 559 | 130.8 |
| C | 15 | 111 | 12290 | 89.71 | 557 | 559 | 130.8 |
| C | 7 | 247 | 8903 | 63.81 | 557 | 559 | 130.8 |
| D | 10 | 204 | 482238 | 3589.6 | 551 | 536 | 134.2 |
| D | 12 | 233 | 359503 | 2674.99 | 551 | 536 | 134.2 |
| D | 12 | 218 | 276078 | 2053.31 | 551 | 536 | 134.2 |
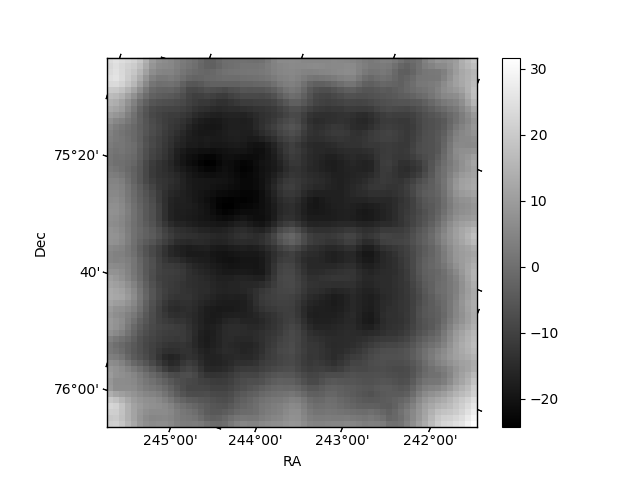
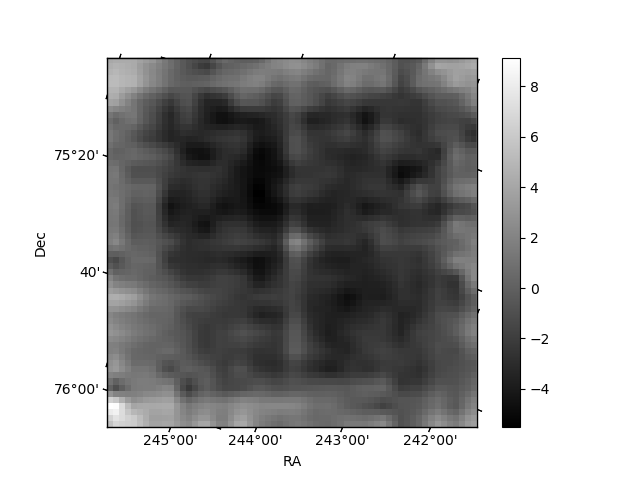
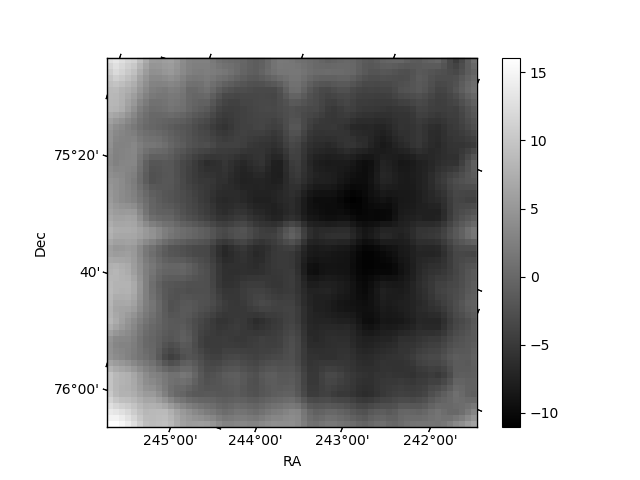
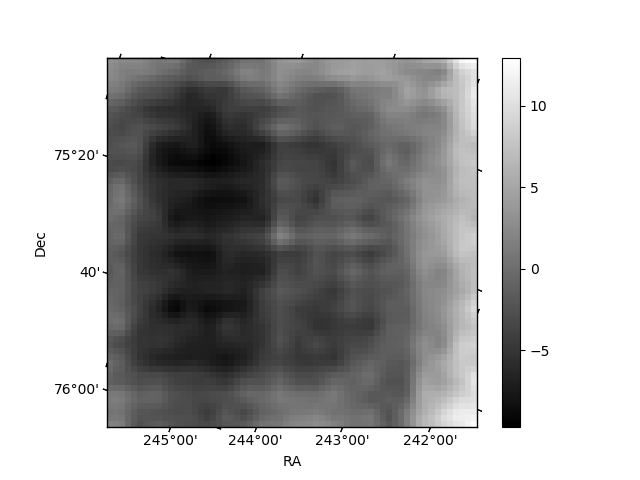
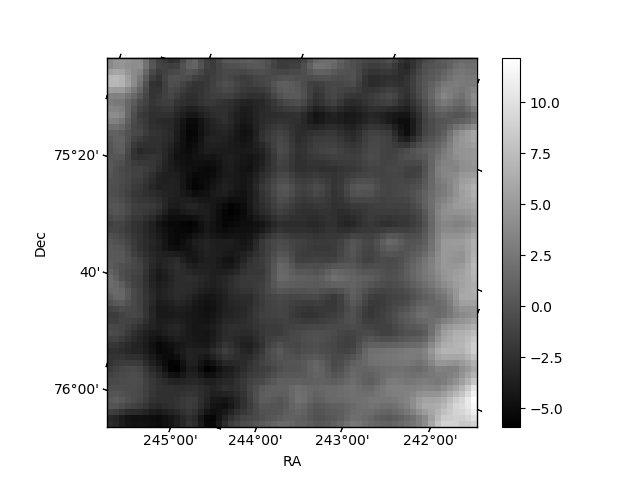
Histogram calculated using DETX and DETY for each event in the final _common_clean file
| Quadrant A | 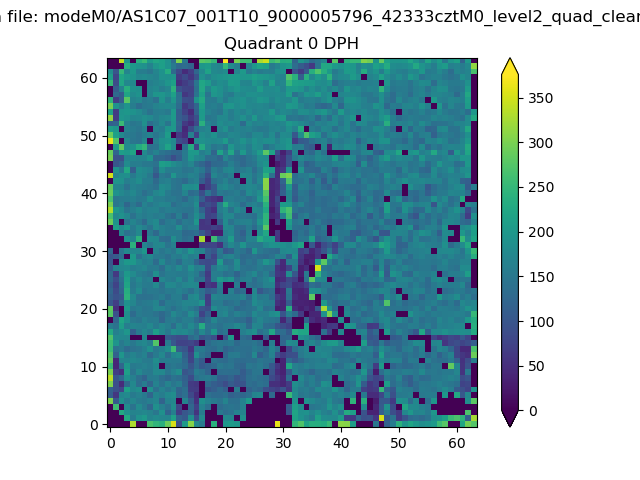 |
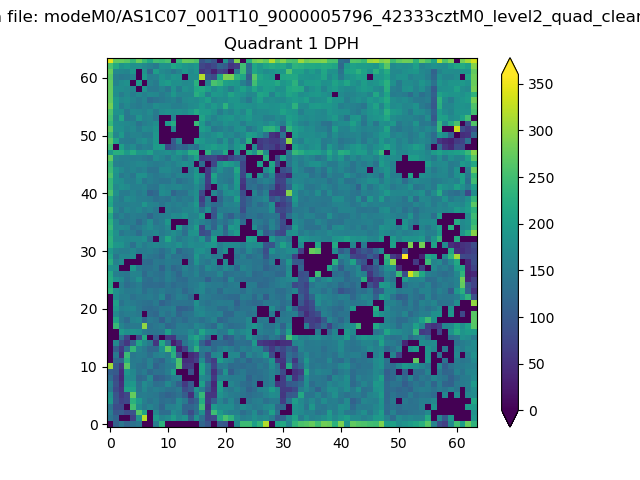 |
Quadrant B |
|---|---|---|---|
| Quadrant D | 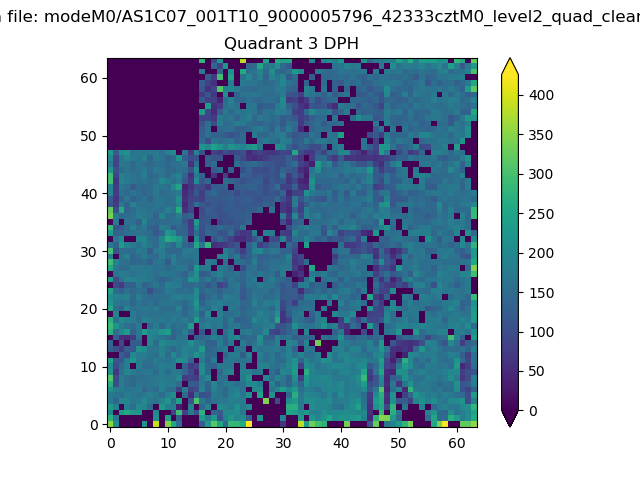 |
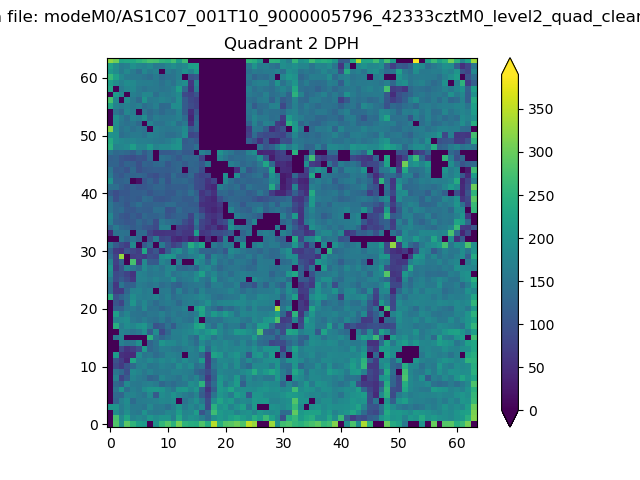 |
Quadrant C |
| Plot type | Count rate plots | Images |
|---|---|---|
| Comparison with Poisson distribution Blue bars denote a histogram of data divided into 1 sec bins. Red curve is a Poisson curve with rate = median count rate of data. |
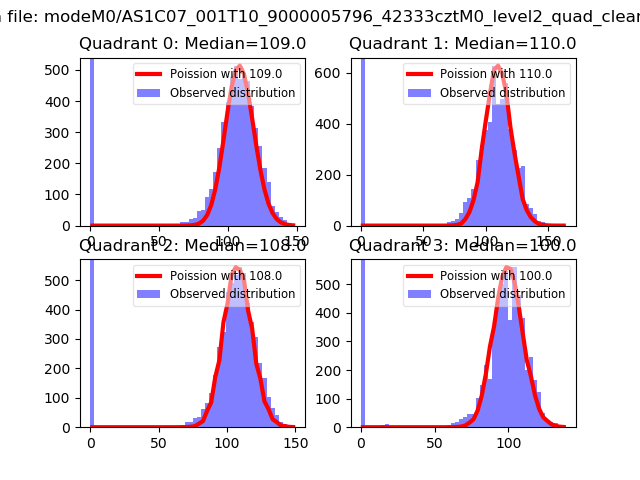 |
 |
| Quadrant-wise count rates Data is divided into 100 sec bins |
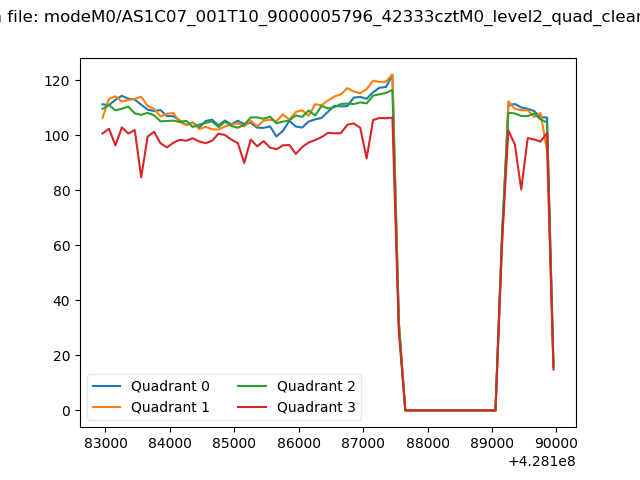 |
|
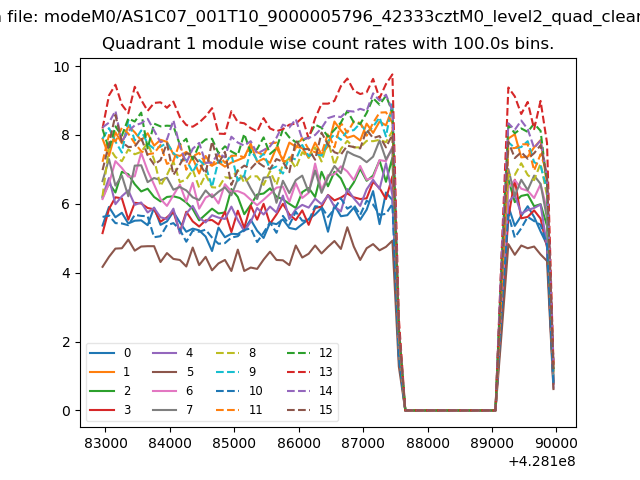
| Module-wise count rates for Quadrant A Data is divided into 100 sec bins |
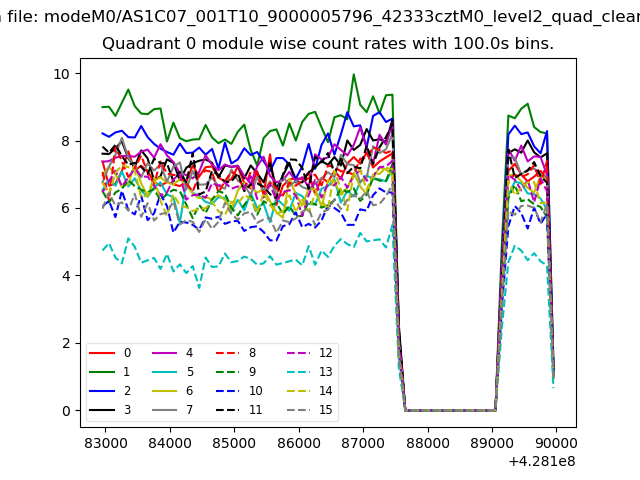 |
 |
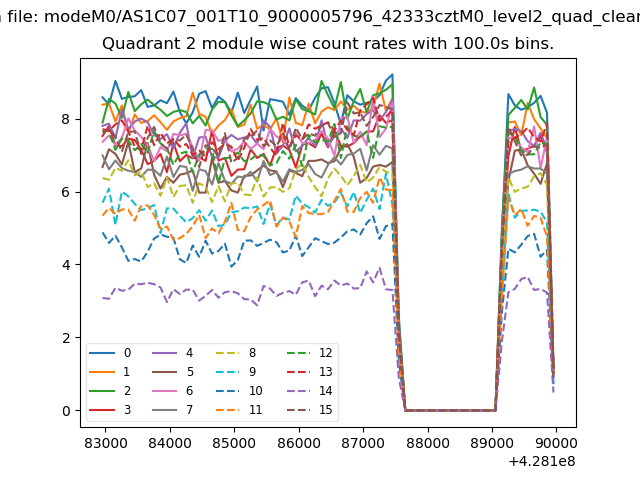
| Module-wise count rates for Quadrant B Data is divided into 100 sec bins |
 |
 |
| Module-wise count rates for Quadrant C Data is divided into 100 sec bins |
 |
 |
| Module-wise count rates for Quadrant D Data is divided into 100 sec bins |
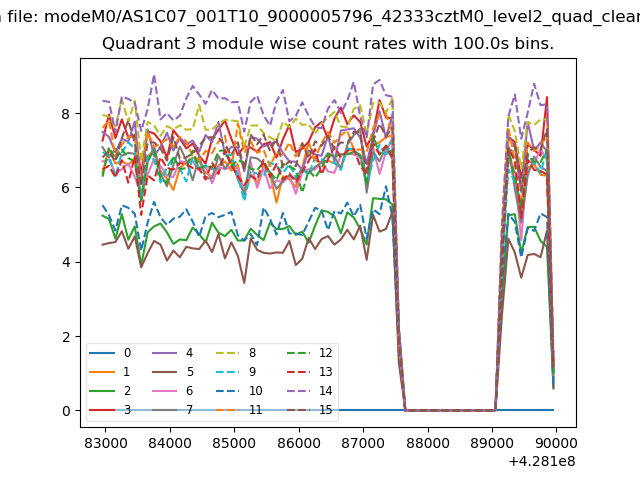 |
 |
| Parameter | Plot |
|---|---|
| CZT HV Monitor | 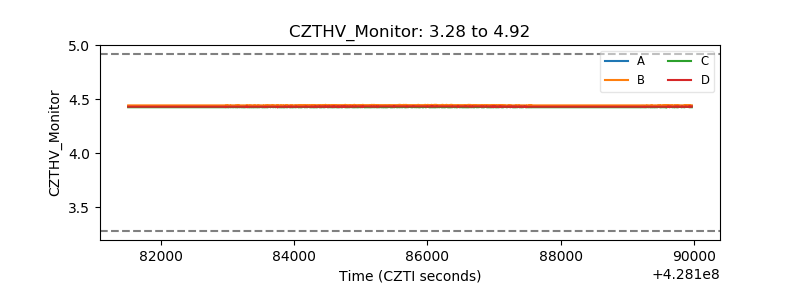 |
| D_VDD | 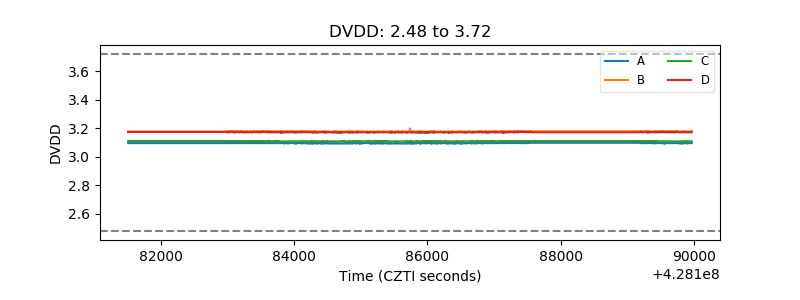 |
| Temperature 1 | 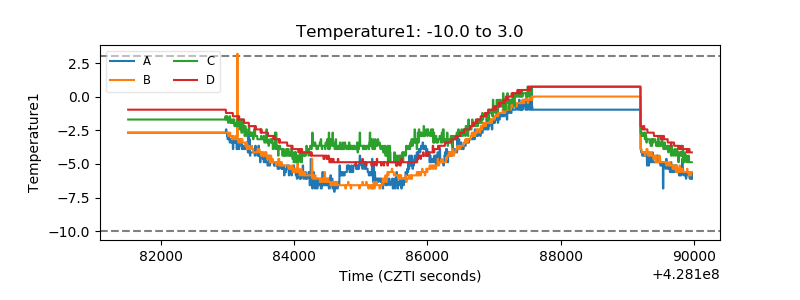 |
| Veto HV Monitor | 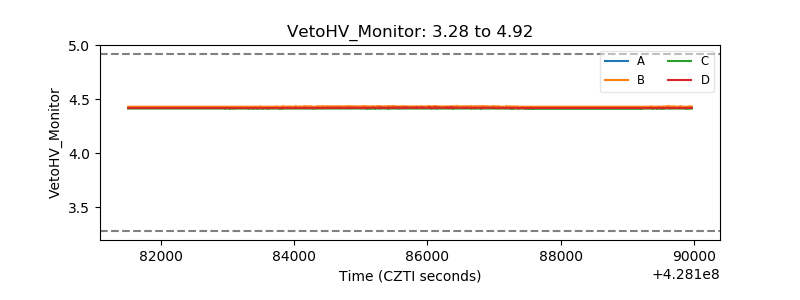 |
| Veto LLD | 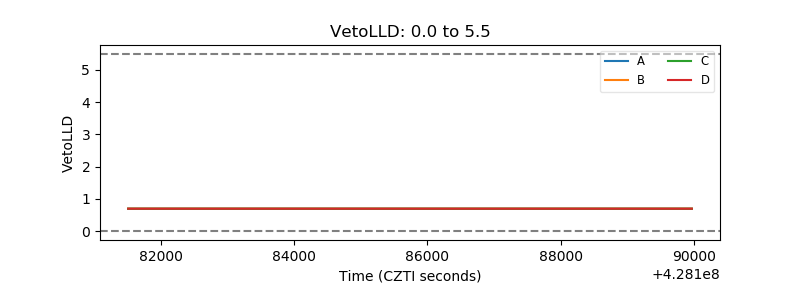 |
| Alpha Counter |  |
| _CPM_Rate | 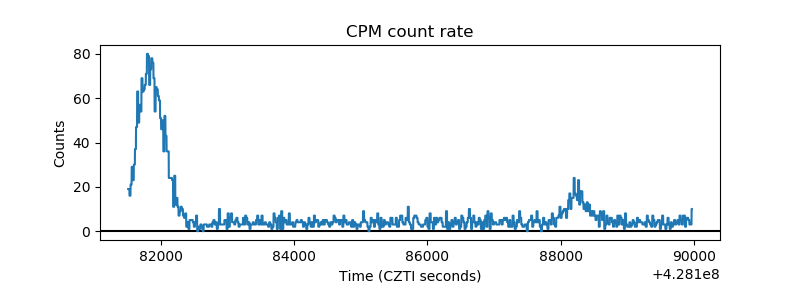 |
| CZT Counter | 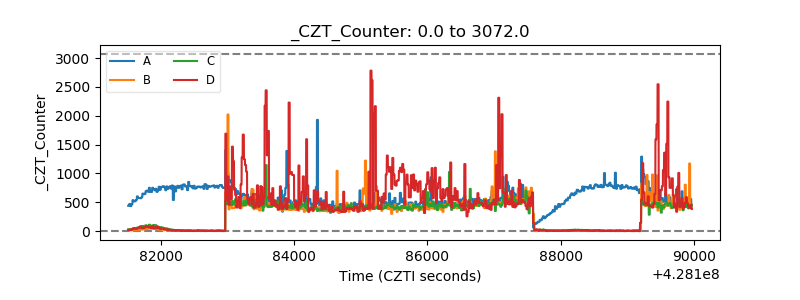 |
| +2.5 Volts monitor | 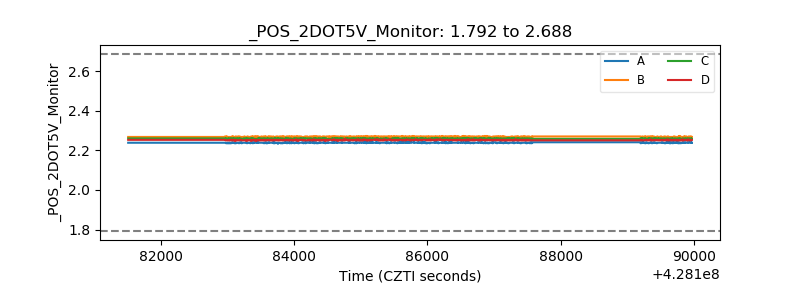 |
| +5 Volts monitor | 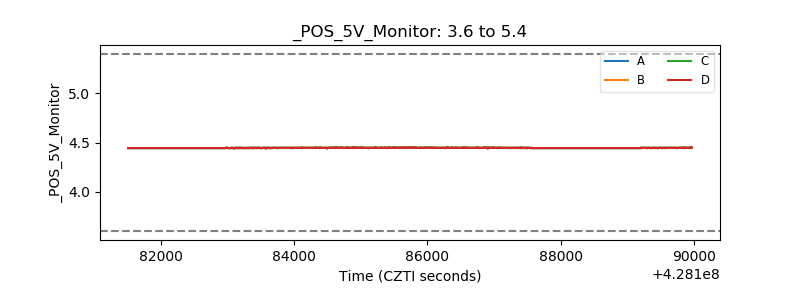 |
| _ROLL_ROT | 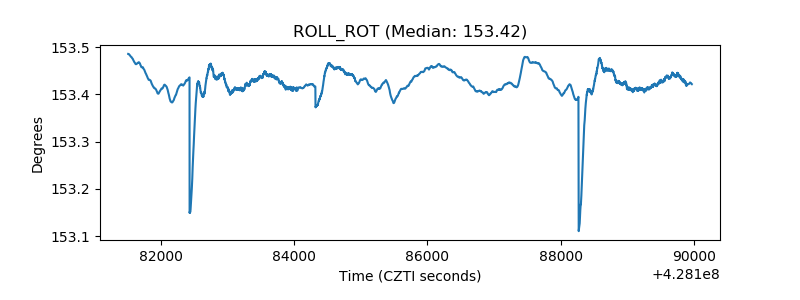 |
| _Roll_DEC | 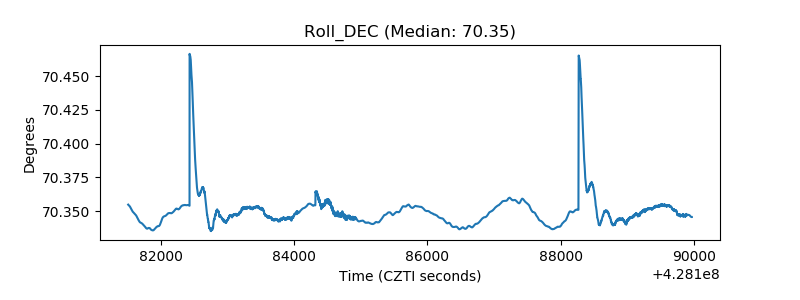 |
| _Roll_RA | 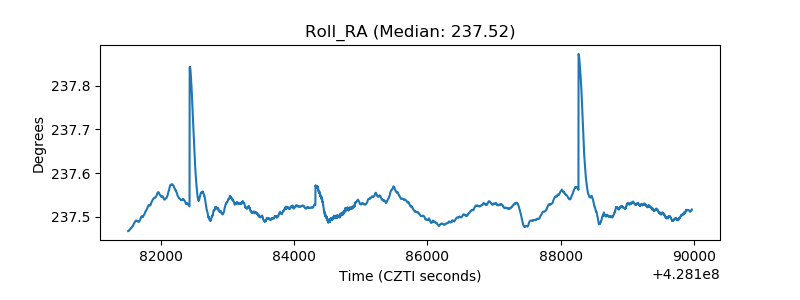 |
| Veto Counter | 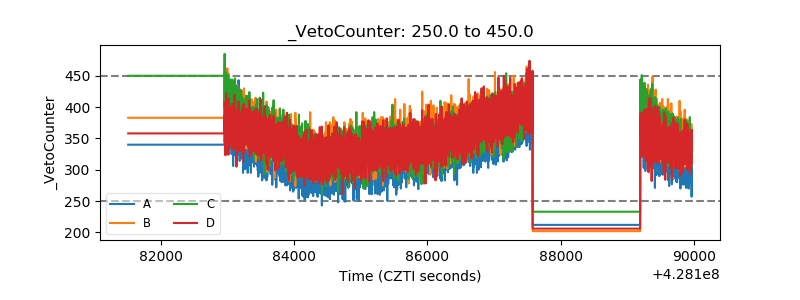 |