| Param | Original file | Final file |
|---|---|---|
| Filename | modeM0/AS1C07_001T10_9000005796_42334cztM0_level2.fits | modeM0/AS1C07_001T10_9000005796_42334cztM0_level2_quad_clean.evt |
| Size (bytes) | 356,382,720 | 92,784,960 |
| Size | 339.9 MB | 88.5 MB |
| Events in quadrant A | 3,010,853 | 619,842 |
| Events in quadrant B | 2,772,177 | 624,646 |
| Events in quadrant C | 2,635,522 | 612,676 |
| Events in quadrant D | 4,323,060 | 547,640 |
| Mode M0 | |||
|---|---|---|---|
| Quadrant | BADHDUFLAG | Total packets | Discarded packets |
| A | 0 | 12594 | 2 |
| B | 0 | 12447 | 2 |
| C | 0 | 11798 | 2 |
| D | 0 | 17045 | 2 |
| Mode SS | |||
|---|---|---|---|
| Quadrant | BADHDUFLAG | Total packets | Discarded packets |
| A | 0 | 118 | 0 |
| B | 0 | 118 | 0 |
| C | 0 | 118 | 0 |
| D | 0 | 118 | 0 |
| Mode M9 | |||
|---|---|---|---|
| Quadrant | BADHDUFLAG | Total packets | Discarded packets |
| A | 0 | 24 | 0 |
| B | 0 | 25 | 0 |
| C | 0 | 25 | 0 |
| D | 0 | 25 | 0 |
| Quadrant | Total seconds | Saturated seconds | Saturation percentage |
|---|---|---|---|
| A | 5784 | 15 | 0.259336% |
| B | 5784 | 57 | 0.985477% |
| C | 5784 | 6 | 0.103734% |
| D | 5784 | 358 | 6.189488% |
Noise dominated data is calculated using 1-second bins in cleaned event files. If a bin has >2000 counts, and if more than 50% of those come from <1% of pixels, then it is considered to be noise-dominated and hence unusable.
| Quadrant | # 1 sec bins | Bins with >0 counts | Bins with >2000 counts | High rate bins dominated by noise | Noise dominated (total time) | Noise dominated (detector-on time) | Marked lightcurve |
|---|---|---|---|---|---|---|---|
| A | 7156 | 5785 | 6 | 6 | 0.08% | 0.10% | 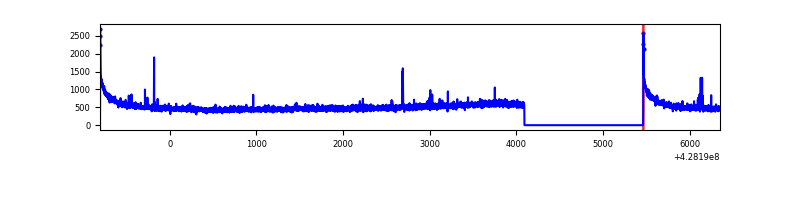 |
| B | 7156 | 5785 | 31 | 31 | 0.43% | 0.54% | 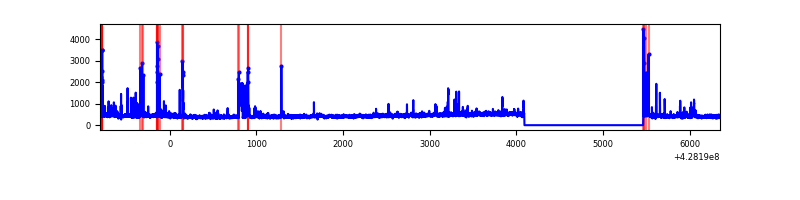 |
| C | 7156 | 5785 | 3 | 3 | 0.04% | 0.05% | 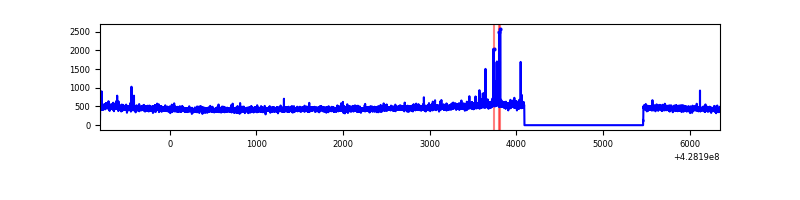 |
| D | 7156 | 5785 | 322 | 322 | 4.50% | 5.57% | 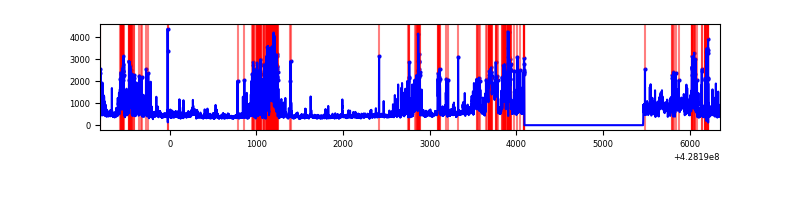 |
Top three noisy pixels from each quadrant. If the there are fewer than three noisy pixels in the level2.evt file, extra rows are filled as -1
| Pixel properties | Quadrant properties | ||||||
|---|---|---|---|---|---|---|---|
| Quadrant | DetID | PixID | Counts | Sigma | Mean | Median | Sigma |
| A | 10 | 83 | 612135 | 4847.34 | 609 | 595 | 126.2 |
| A | 7 | 3 | 21990 | 169.59 | 609 | 595 | 126.2 |
| A | 13 | 254 | 9949 | 74.14 | 609 | 595 | 126.2 |
| B | 5 | 172 | 189862 | 1636.08 | 603 | 587 | 115.7 |
| B | 3 | 112 | 72571 | 622.23 | 603 | 587 | 115.7 |
| B | 0 | 245 | 43304 | 369.24 | 603 | 587 | 115.7 |
| C | 15 | 214 | 241060 | 1720.77 | 600 | 603 | 139.7 |
| C | 5 | 250 | 26026 | 181.93 | 600 | 603 | 139.7 |
| C | 12 | 249 | 12030 | 81.77 | 600 | 603 | 139.7 |
| D | 5 | 222 | 498843 | 3496.75 | 585 | 571 | 142.5 |
| D | 12 | 6 | 438506 | 3073.32 | 585 | 571 | 142.5 |
| D | 12 | 218 | 388777 | 2724.33 | 585 | 571 | 142.5 |
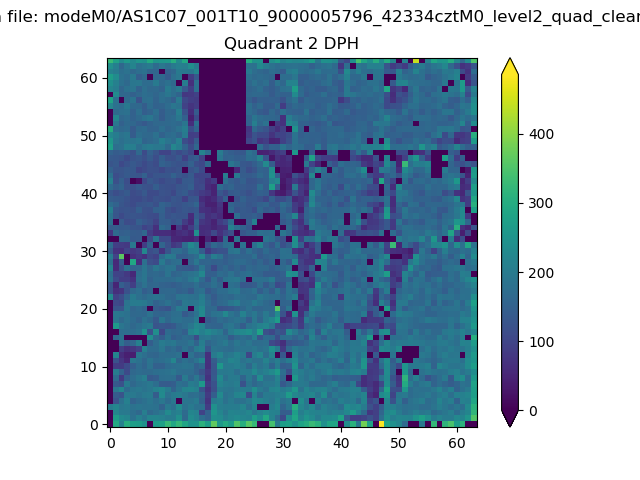
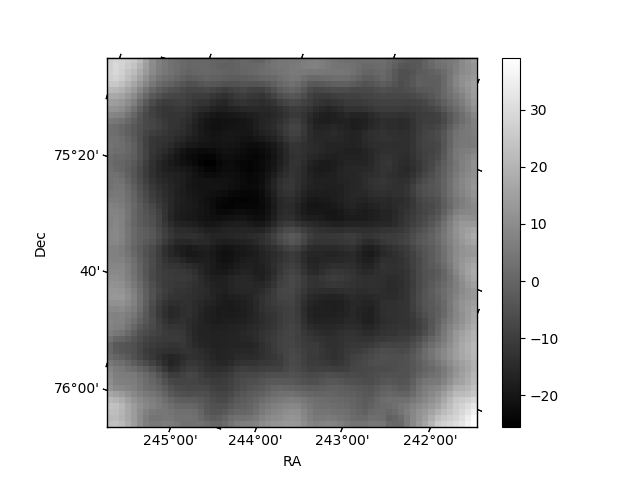
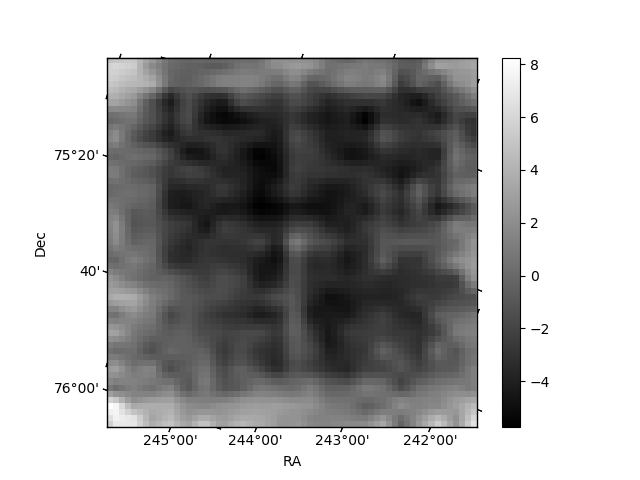
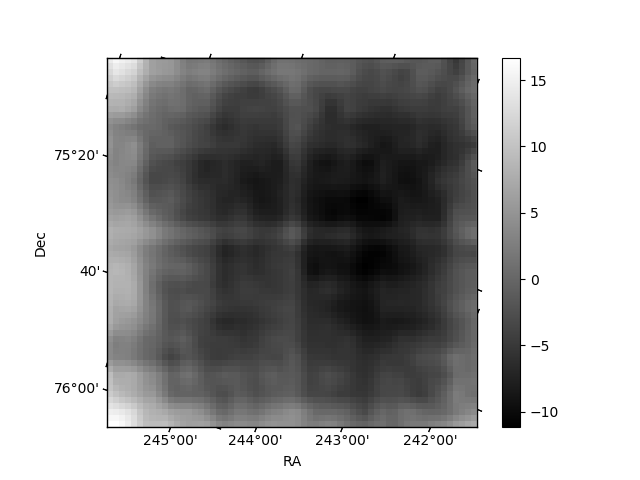
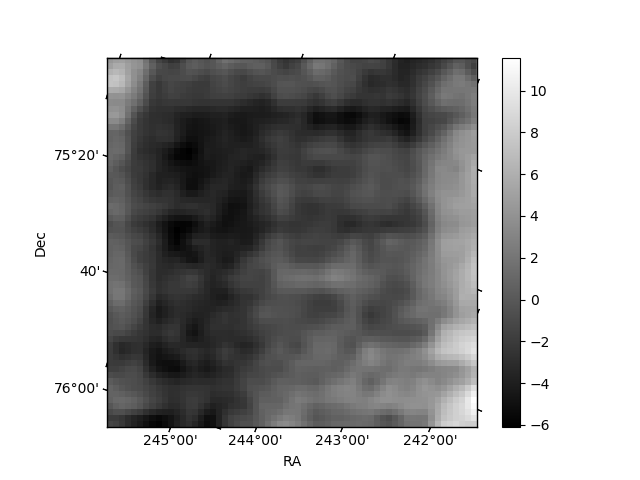
Histogram calculated using DETX and DETY for each event in the final _common_clean file
| Quadrant A | 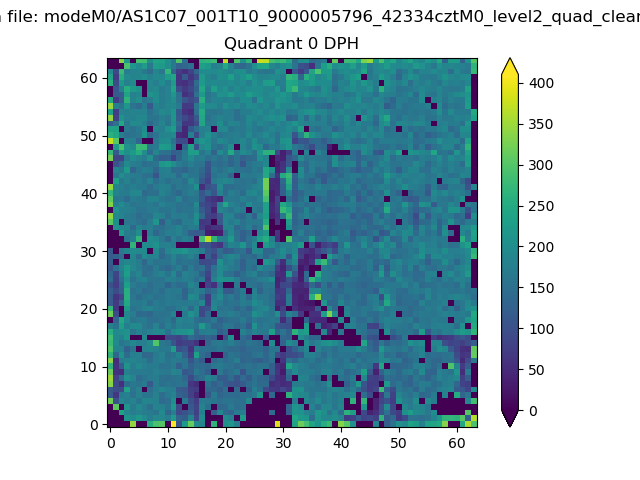 |
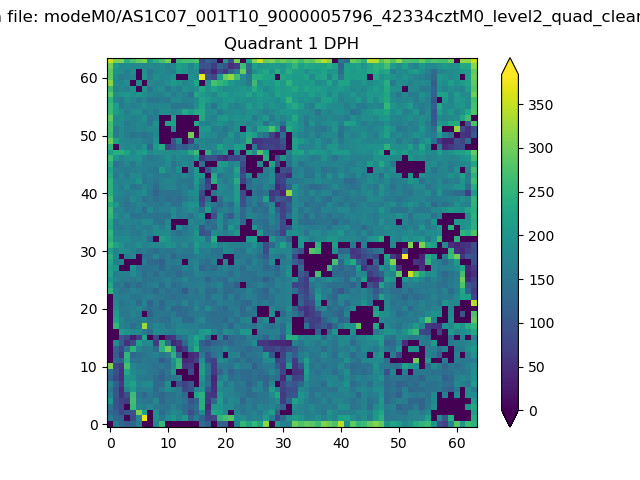 |
Quadrant B |
|---|---|---|---|
| Quadrant D | 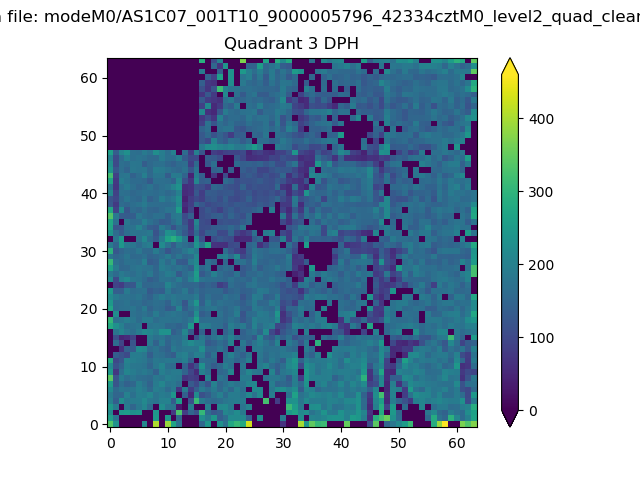 |
 |
Quadrant C |
| Plot type | Count rate plots | Images |
|---|---|---|
| Comparison with Poisson distribution Blue bars denote a histogram of data divided into 1 sec bins. Red curve is a Poisson curve with rate = median count rate of data. |
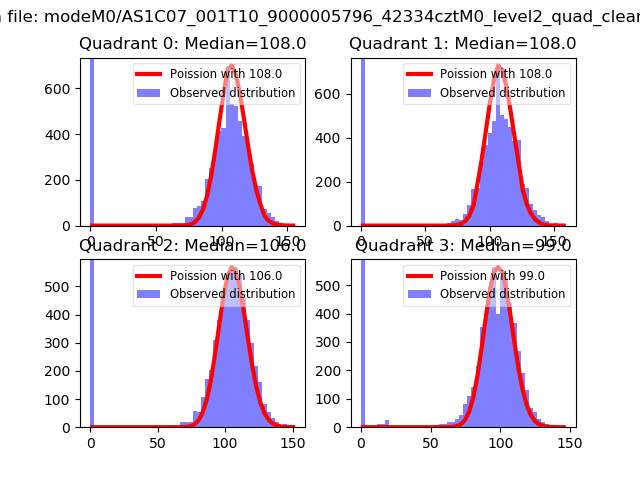 |
 |
| Quadrant-wise count rates Data is divided into 100 sec bins |
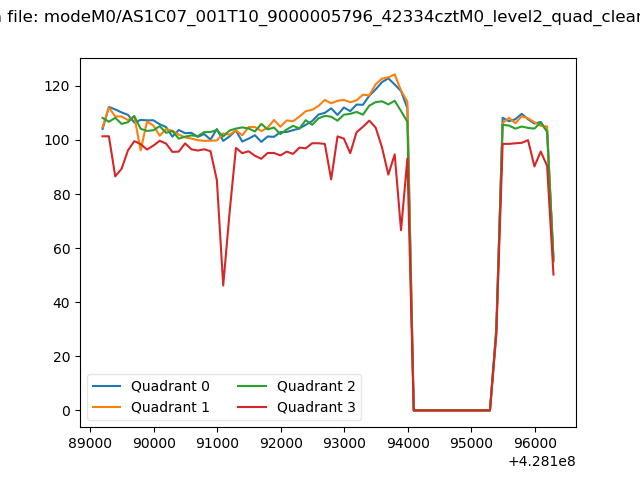 |
|
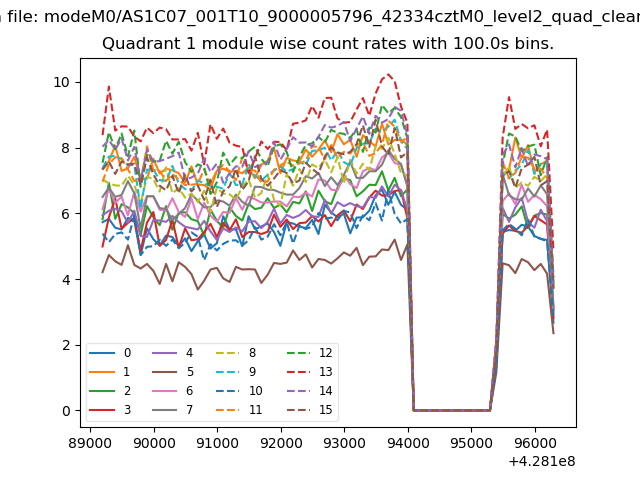
| Module-wise count rates for Quadrant A Data is divided into 100 sec bins |
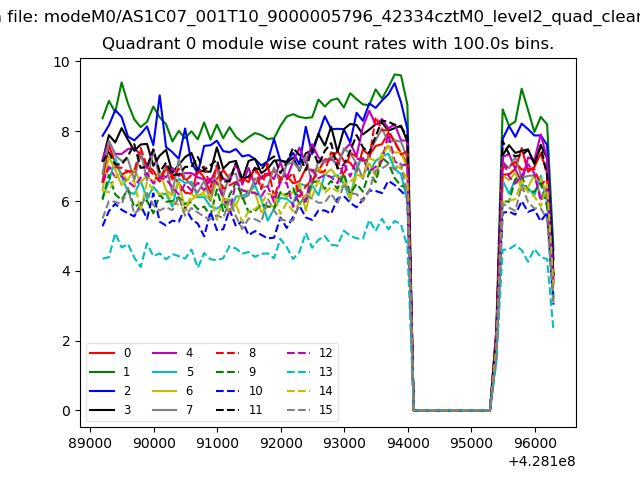 |
 |
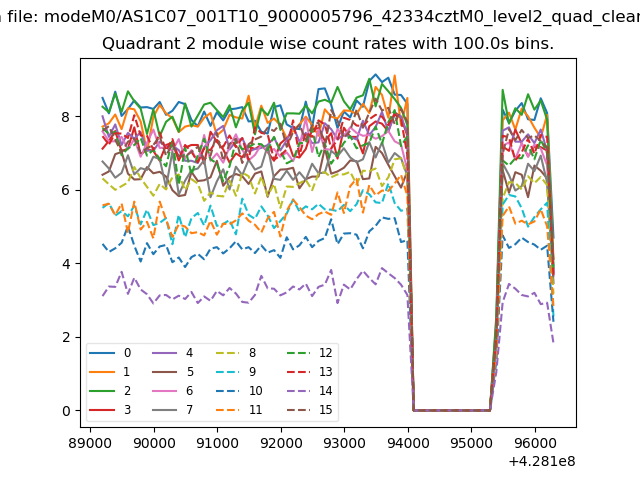
| Module-wise count rates for Quadrant B Data is divided into 100 sec bins |
 |
 |
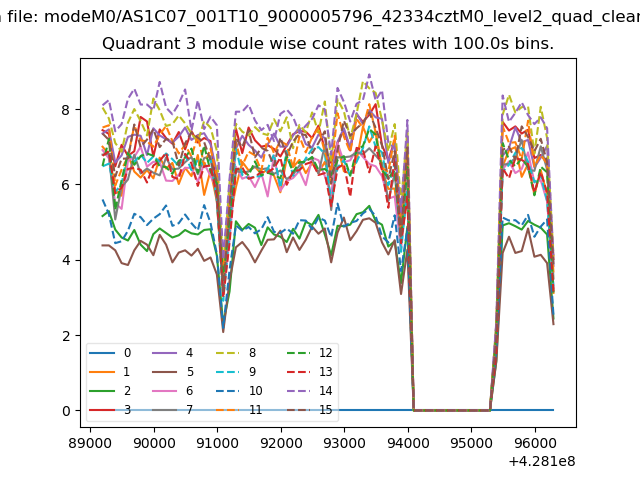
| Module-wise count rates for Quadrant C Data is divided into 100 sec bins |
 |
 |
| Module-wise count rates for Quadrant D Data is divided into 100 sec bins |
 |
 |
| Parameter | Plot |
|---|---|
| CZT HV Monitor | 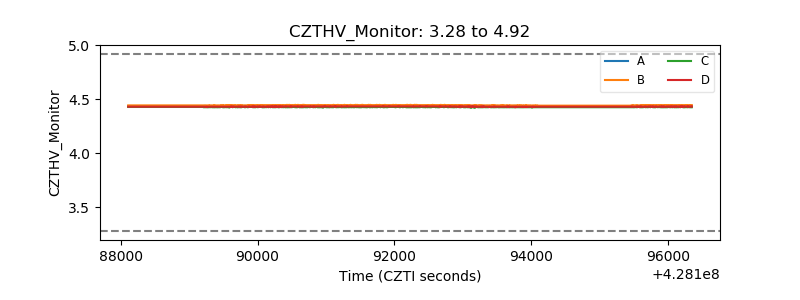 |
| D_VDD | 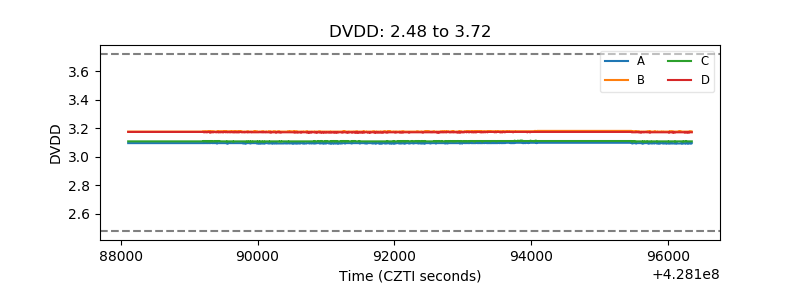 |
| Temperature 1 | 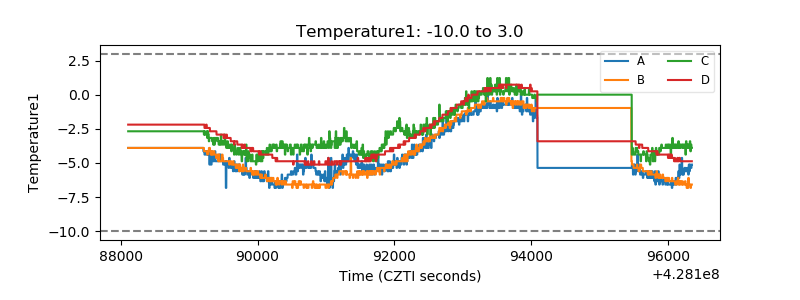 |
| Veto HV Monitor | 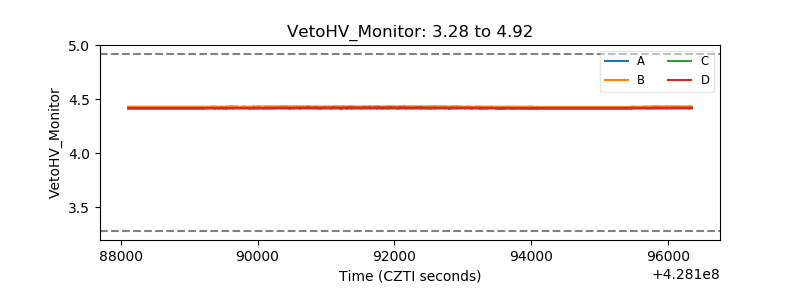 |
| Veto LLD | 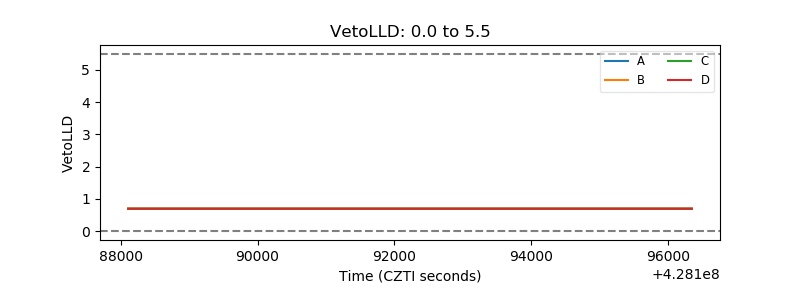 |
| Alpha Counter | 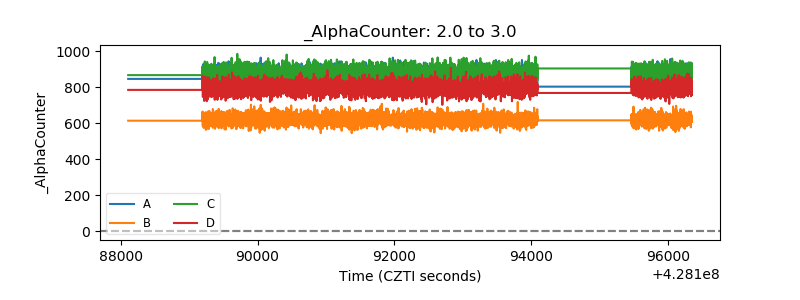 |
| _CPM_Rate |  |
| CZT Counter | 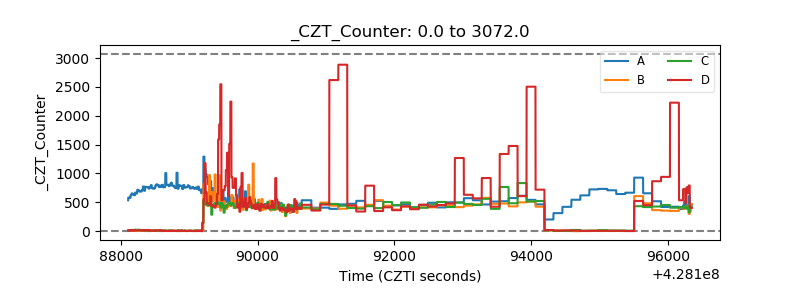 |
| +2.5 Volts monitor | 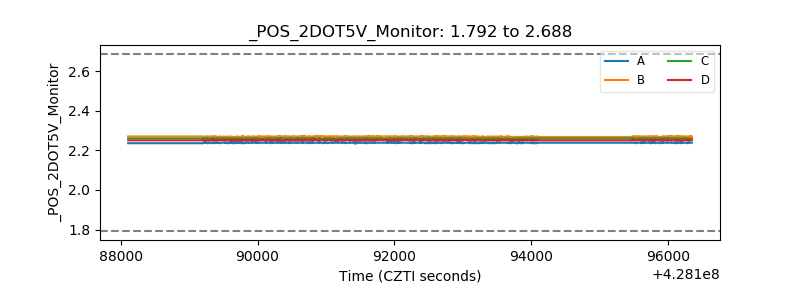 |
| +5 Volts monitor | 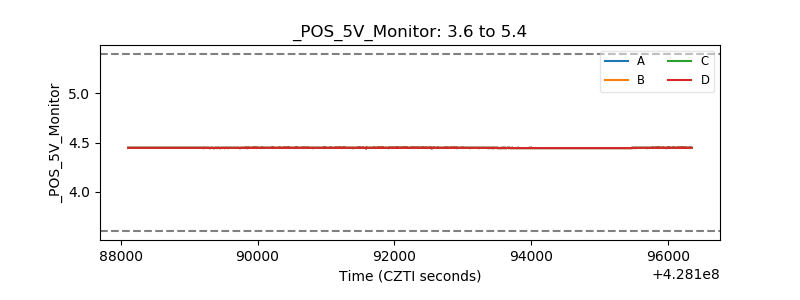 |
| _ROLL_ROT | 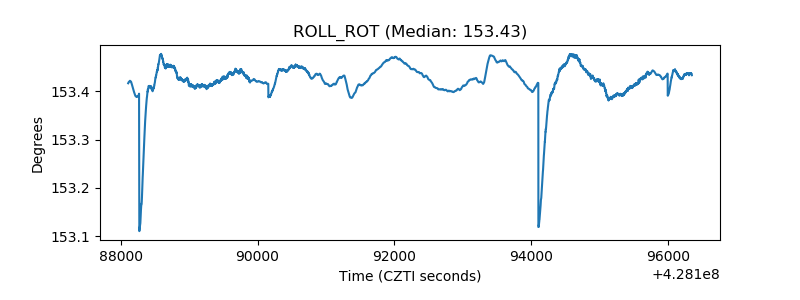 |
| _Roll_DEC | 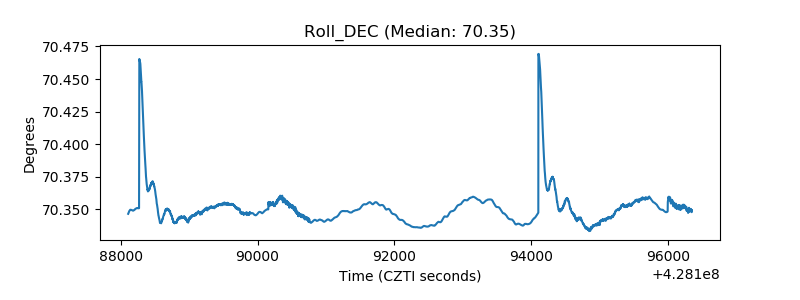 |
| _Roll_RA | 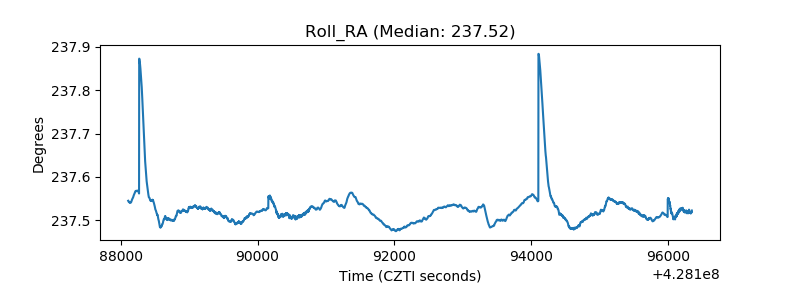 |
| Veto Counter | 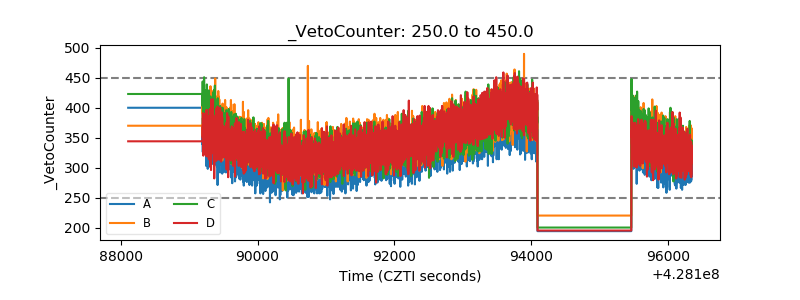 |