| Param | Original file | Final file |
|---|---|---|
| Filename | modeM0/AS1C07_001T10_9000005796_42335cztM0_level2.fits | modeM0/AS1C07_001T10_9000005796_42335cztM0_level2_quad_clean.evt |
| Size (bytes) | 381,205,440 | 102,447,360 |
| Size | 363.5 MB | 97.7 MB |
| Events in quadrant A | 3,350,631 | 681,531 |
| Events in quadrant B | 2,919,131 | 690,113 |
| Events in quadrant C | 3,064,561 | 675,744 |
| Events in quadrant D | 4,283,656 | 612,497 |
| Mode M0 | |||
|---|---|---|---|
| Quadrant | BADHDUFLAG | Total packets | Discarded packets |
| A | 0 | 13942 | 2 |
| B | 0 | 13265 | 2 |
| C | 0 | 13231 | 2 |
| D | 0 | 17230 | 2 |
| Mode SS | |||
|---|---|---|---|
| Quadrant | BADHDUFLAG | Total packets | Discarded packets |
| A | 0 | 130 | 0 |
| B | 0 | 130 | 0 |
| C | 0 | 130 | 0 |
| D | 0 | 130 | 0 |
| Mode M9 | |||
|---|---|---|---|
| Quadrant | BADHDUFLAG | Total packets | Discarded packets |
| A | 0 | 27 | 0 |
| B | 0 | 27 | 0 |
| C | 0 | 27 | 0 |
| D | 0 | 27 | 0 |
| Quadrant | Total seconds | Saturated seconds | Saturation percentage |
|---|---|---|---|
| A | 6335 | 9 | 0.142068% |
| B | 6335 | 23 | 0.363062% |
| C | 6335 | 6 | 0.094712% |
| D | 6335 | 244 | 3.851618% |
Noise dominated data is calculated using 1-second bins in cleaned event files. If a bin has >2000 counts, and if more than 50% of those come from <1% of pixels, then it is considered to be noise-dominated and hence unusable.
| Quadrant | # 1 sec bins | Bins with >0 counts | Bins with >2000 counts | High rate bins dominated by noise | Noise dominated (total time) | Noise dominated (detector-on time) | Marked lightcurve |
|---|---|---|---|---|---|---|---|
| A | 9019 | 6337 | 5 | 5 | 0.06% | 0.08% | 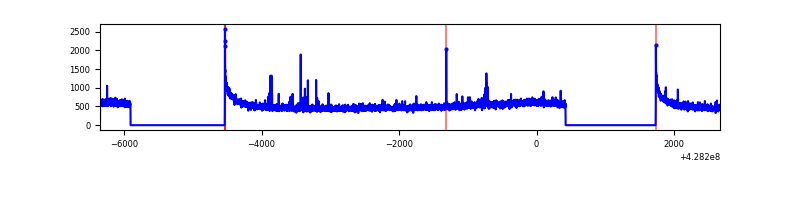 |
| B | 9019 | 6337 | 9 | 9 | 0.10% | 0.14% | 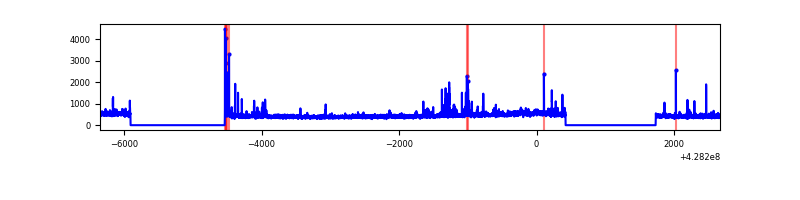 |
| C | 9019 | 6337 | 4 | 4 | 0.04% | 0.06% | 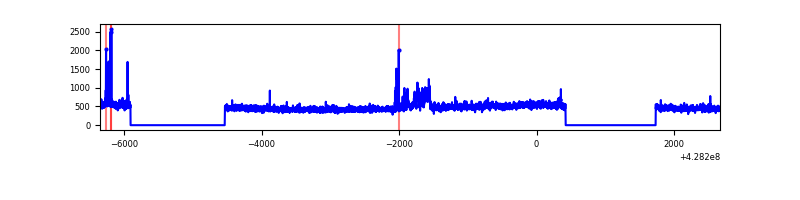 |
| D | 9019 | 6337 | 192 | 192 | 2.13% | 3.03% | 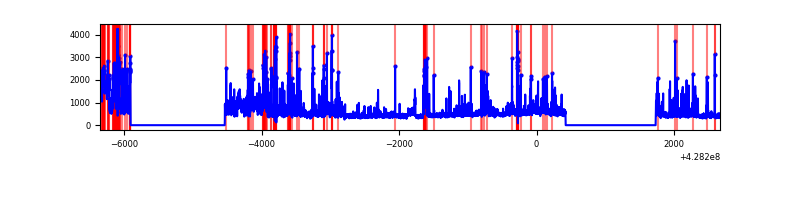 |
Top three noisy pixels from each quadrant. If the there are fewer than three noisy pixels in the level2.evt file, extra rows are filled as -1
| Pixel properties | Quadrant properties | ||||||
|---|---|---|---|---|---|---|---|
| Quadrant | DetID | PixID | Counts | Sigma | Mean | Median | Sigma |
| A | 10 | 83 | 660903 | 4673.72 | 681 | 666 | 141.3 |
| A | 13 | 248 | 20156 | 137.97 | 681 | 666 | 141.3 |
| A | 7 | 3 | 18811 | 128.45 | 681 | 666 | 141.3 |
| B | 5 | 172 | 67689 | 510.59 | 677 | 659 | 131.3 |
| B | 0 | 230 | 61802 | 465.75 | 677 | 659 | 131.3 |
| B | 4 | 141 | 57832 | 435.51 | 677 | 659 | 131.3 |
| C | 15 | 214 | 268833 | 1722.11 | 668 | 672 | 155.7 |
| C | 9 | 54 | 135852 | 868.12 | 668 | 672 | 155.7 |
| C | 5 | 250 | 26157 | 163.66 | 668 | 672 | 155.7 |
| D | 5 | 222 | 402304 | 2503.83 | 659 | 642 | 160.4 |
| D | 12 | 218 | 296311 | 1843.11 | 659 | 642 | 160.4 |
| D | 13 | 249 | 189320 | 1176.16 | 659 | 642 | 160.4 |
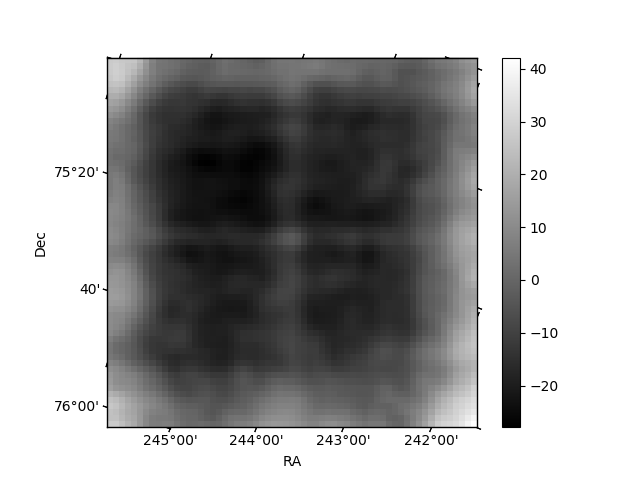
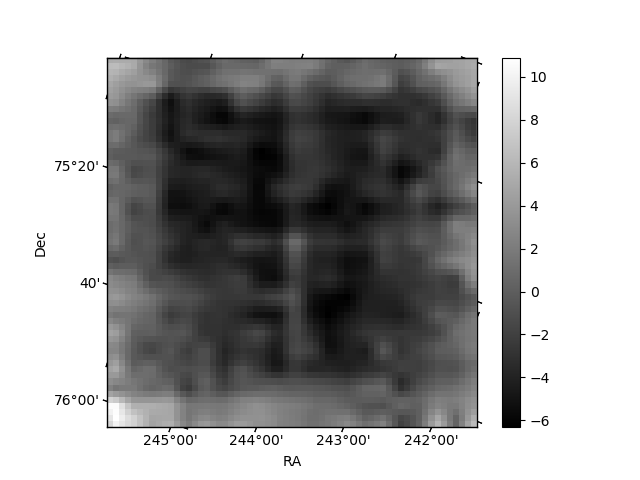
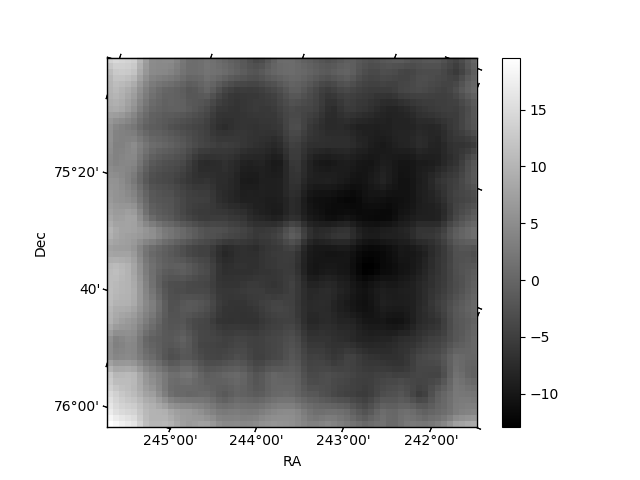
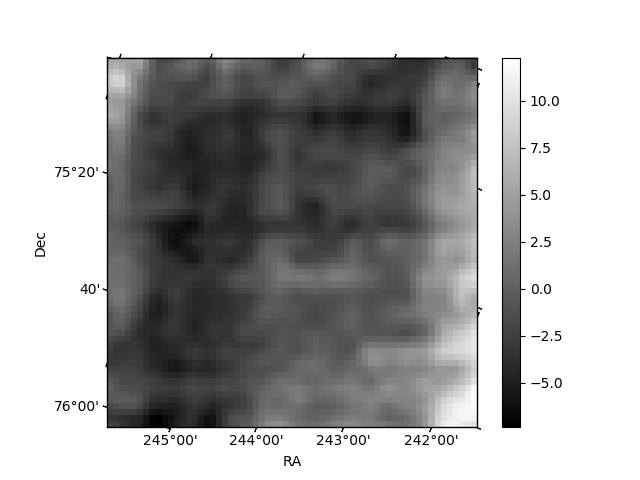
Histogram calculated using DETX and DETY for each event in the final _common_clean file
| Quadrant A | 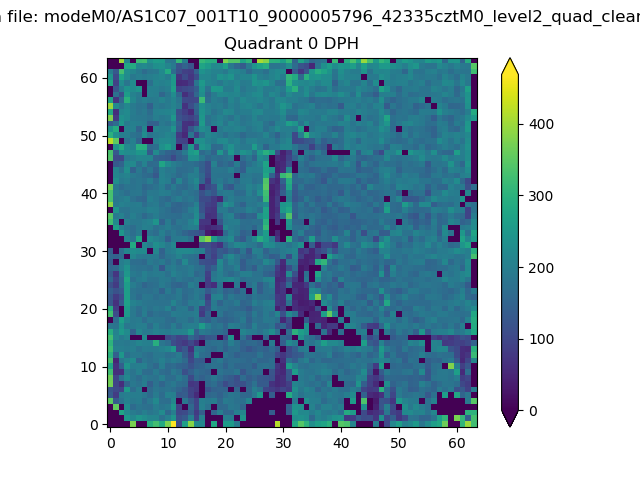 |
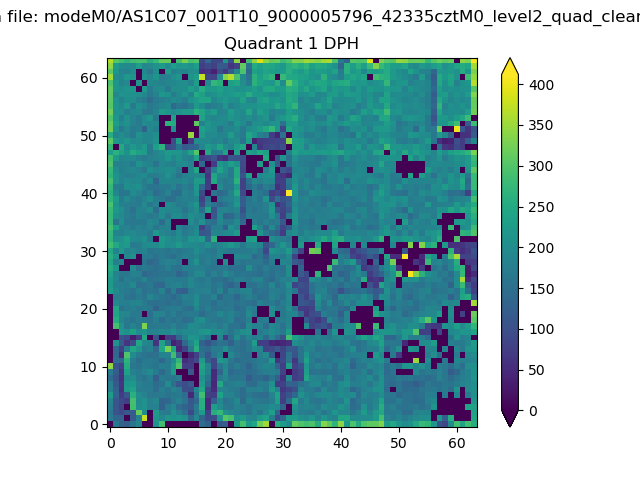 |
Quadrant B |
|---|---|---|---|
| Quadrant D | 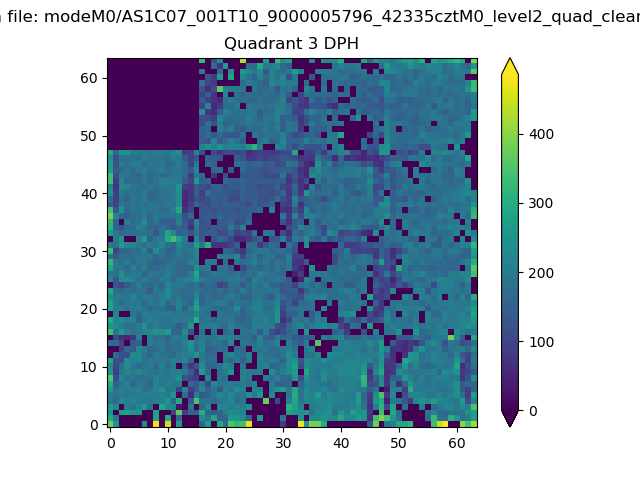 |
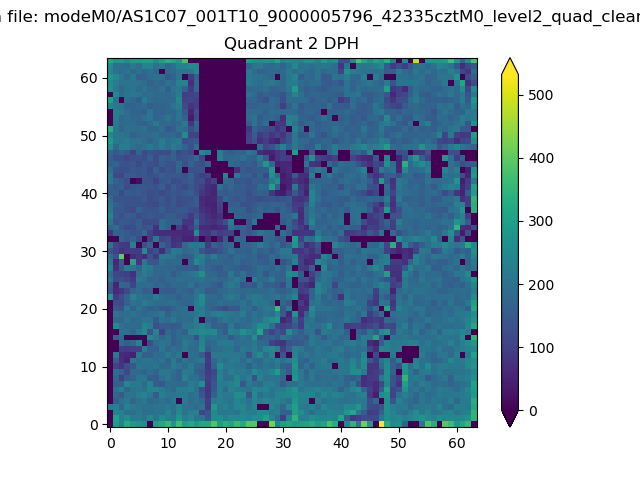 |
Quadrant C |
| Plot type | Count rate plots | Images |
|---|---|---|
| Comparison with Poisson distribution Blue bars denote a histogram of data divided into 1 sec bins. Red curve is a Poisson curve with rate = median count rate of data. |
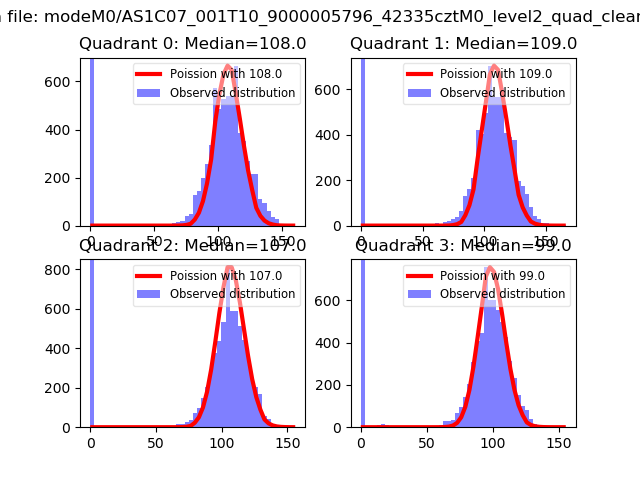 |
 |
| Quadrant-wise count rates Data is divided into 100 sec bins |
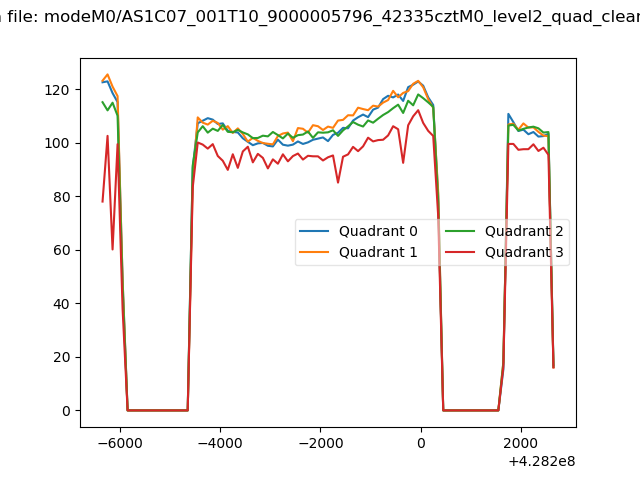 |
|
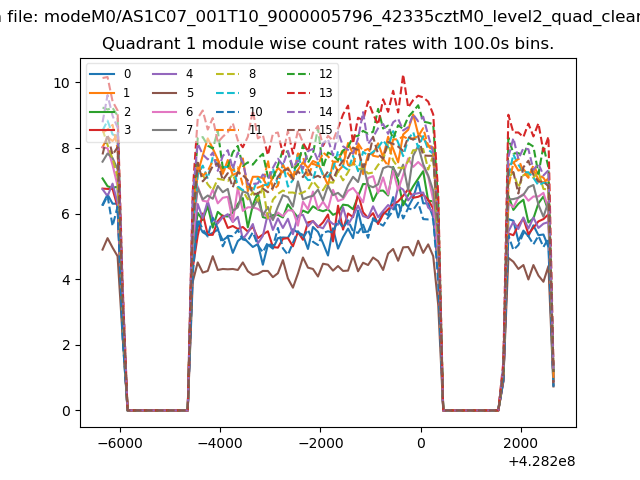
| Module-wise count rates for Quadrant A Data is divided into 100 sec bins |
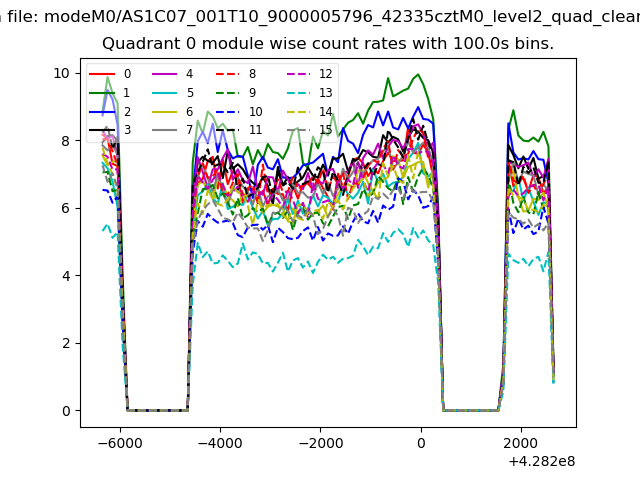 |
 |
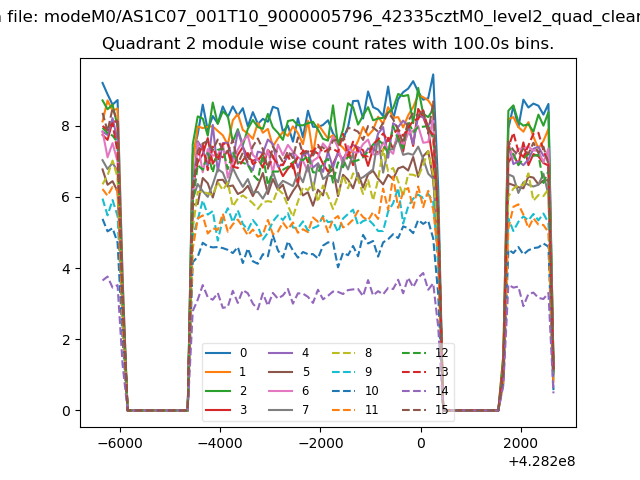
| Module-wise count rates for Quadrant B Data is divided into 100 sec bins |
 |
 |
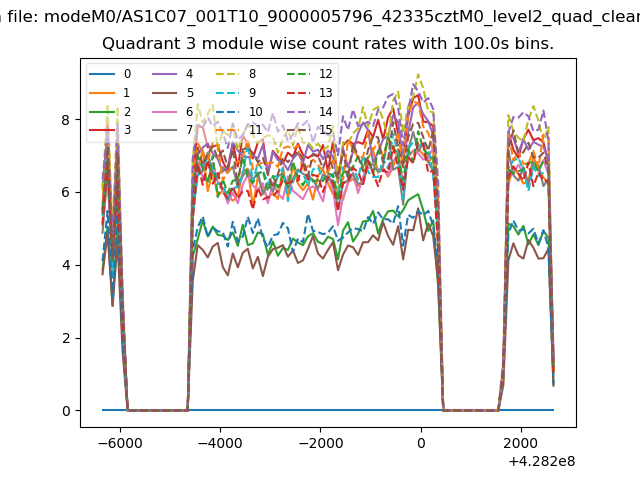
| Module-wise count rates for Quadrant C Data is divided into 100 sec bins |
 |
 |
| Module-wise count rates for Quadrant D Data is divided into 100 sec bins |
 |
 |
| Parameter | Plot |
|---|---|
| CZT HV Monitor | 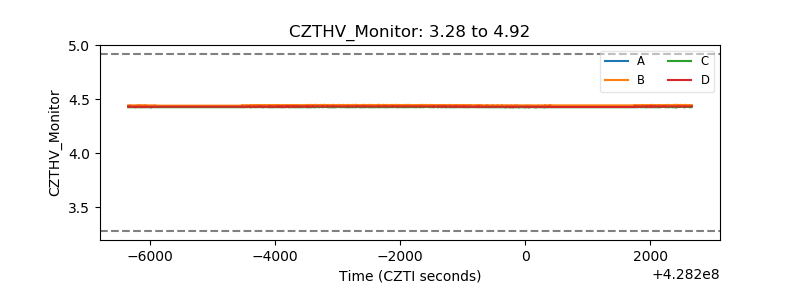 |
| D_VDD | 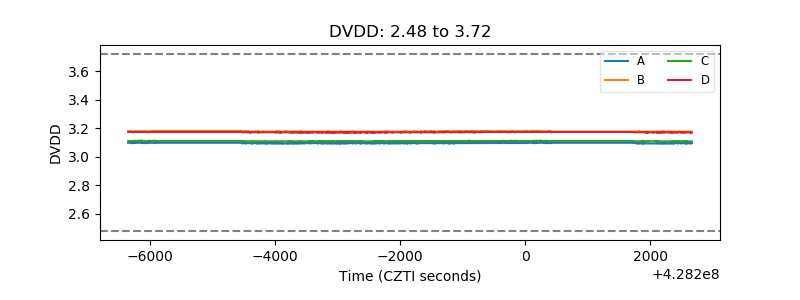 |
| Temperature 1 | 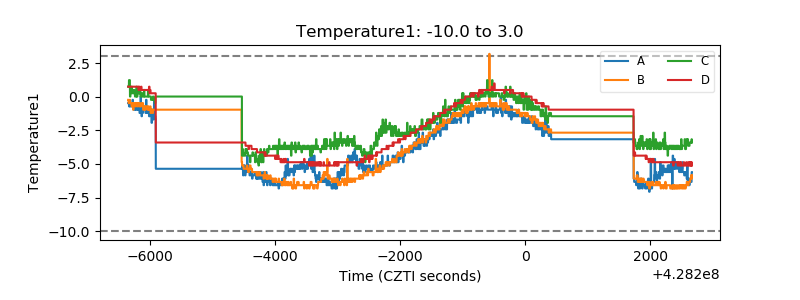 |
| Veto HV Monitor |  |
| Veto LLD | 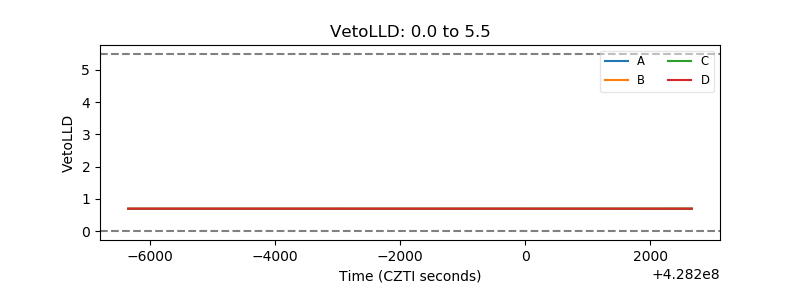 |
| Alpha Counter | 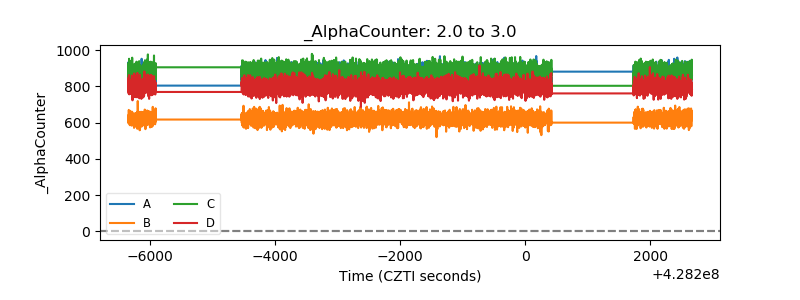 |
| _CPM_Rate | 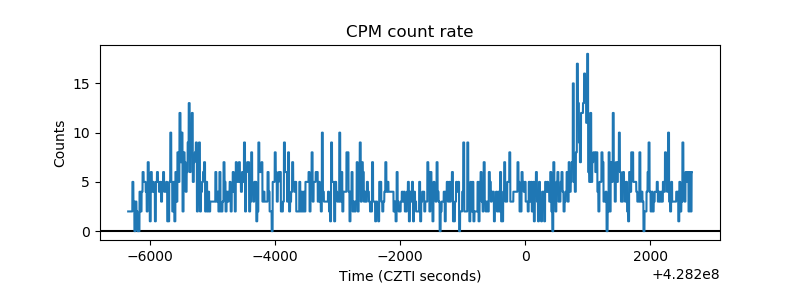 |
| CZT Counter | 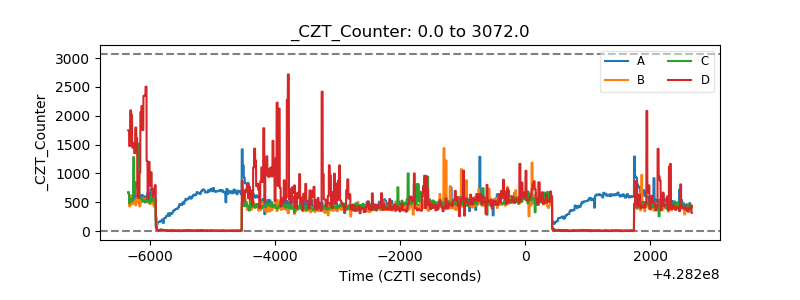 |
| +2.5 Volts monitor | 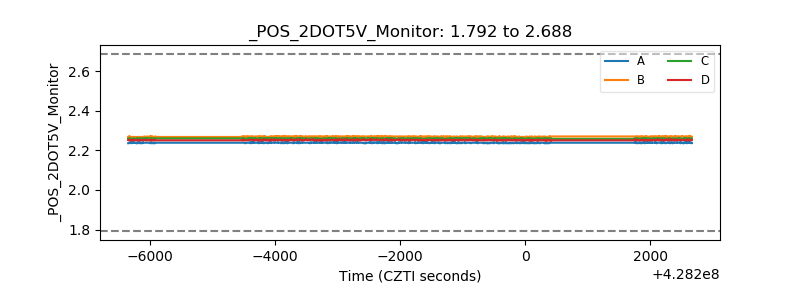 |
| +5 Volts monitor | 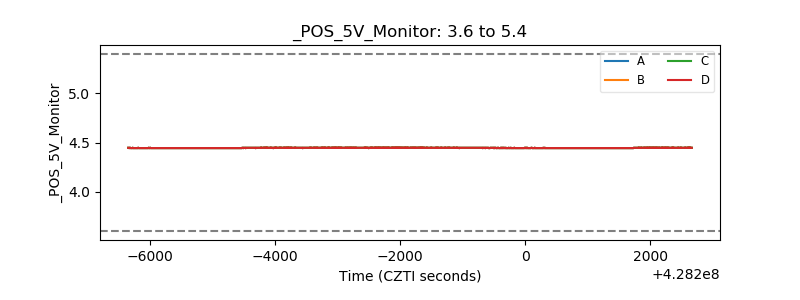 |
| _ROLL_ROT | 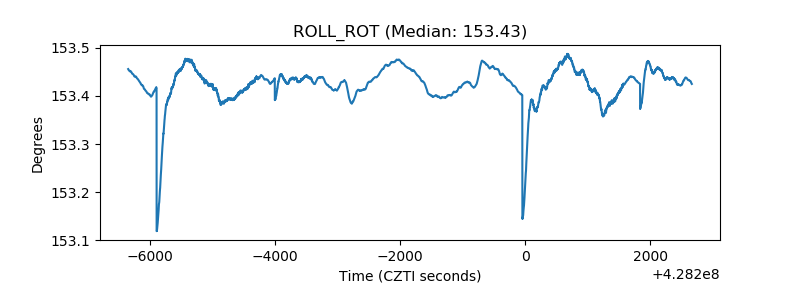 |
| _Roll_DEC | 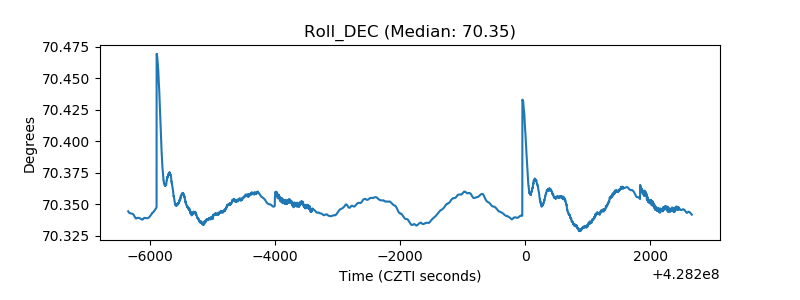 |
| _Roll_RA | 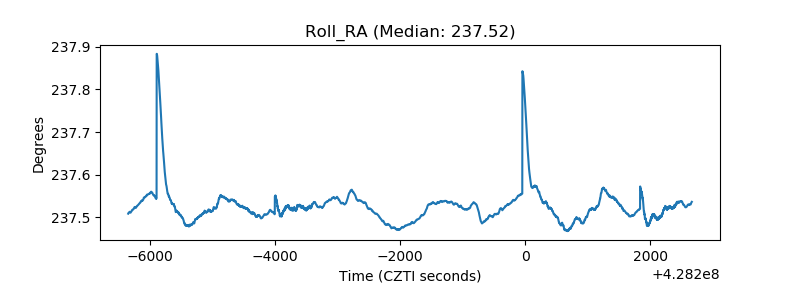 |
| Veto Counter | 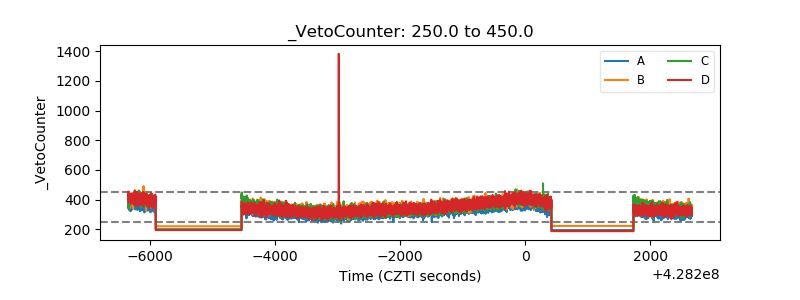 |