| Param | Original file | Final file |
|---|---|---|
| Filename | modeM0/AS1C07_001T10_9000005796_42337cztM0_level2.fits | modeM0/AS1C07_001T10_9000005796_42337cztM0_level2_quad_clean.evt |
| Size (bytes) | 631,382,400 | 179,746,560 |
| Size | 602.1 MB | 171.4 MB |
| Events in quadrant A | 5,902,243 | 1,190,325 |
| Events in quadrant B | 4,996,766 | 1,210,430 |
| Events in quadrant C | 5,142,244 | 1,186,952 |
| Events in quadrant D | 6,460,958 | 1,078,721 |
| Mode M0 | |||
|---|---|---|---|
| Quadrant | BADHDUFLAG | Total packets | Discarded packets |
| A | 0 | 24301 | 3 |
| B | 0 | 22962 | 3 |
| C | 0 | 22618 | 3 |
| D | 0 | 27296 | 3 |
| Mode SS | |||
|---|---|---|---|
| Quadrant | BADHDUFLAG | Total packets | Discarded packets |
| A | 0 | 232 | 0 |
| B | 0 | 232 | 0 |
| C | 0 | 232 | 0 |
| D | 0 | 232 | 0 |
| Mode M9 | |||
|---|---|---|---|
| Quadrant | BADHDUFLAG | Total packets | Discarded packets |
| A | 0 | 40 | 0 |
| B | 0 | 40 | 0 |
| C | 0 | 40 | 0 |
| D | 0 | 40 | 0 |
| Quadrant | Total seconds | Saturated seconds | Saturation percentage |
|---|---|---|---|
| A | 11202 | 19 | 0.169613% |
| B | 11203 | 25 | 0.223155% |
| C | 11203 | 7 | 0.062483% |
| D | 11203 | 283 | 2.526109% |
Noise dominated data is calculated using 1-second bins in cleaned event files. If a bin has >2000 counts, and if more than 50% of those come from <1% of pixels, then it is considered to be noise-dominated and hence unusable.
| Quadrant | # 1 sec bins | Bins with >0 counts | Bins with >2000 counts | High rate bins dominated by noise | Noise dominated (total time) | Noise dominated (detector-on time) | Marked lightcurve |
|---|---|---|---|---|---|---|---|
| A | 15259 | 11205 | 5 | 5 | 0.03% | 0.04% | 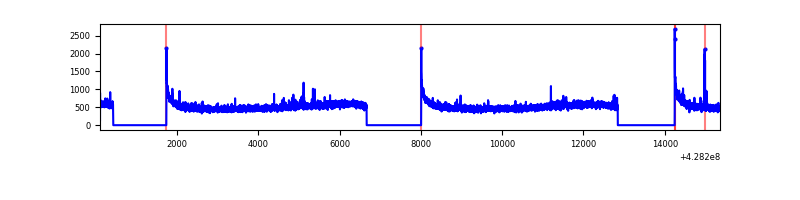 |
| B | 15260 | 11206 | 10 | 10 | 0.07% | 0.09% | 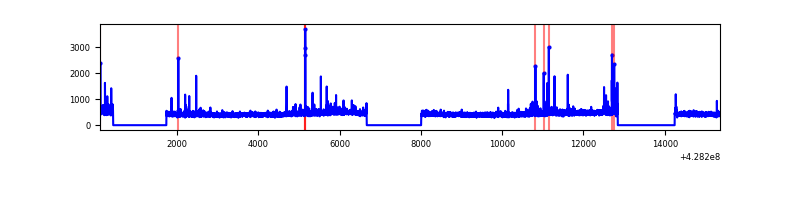 |
| C | 15260 | 11206 | 1 | 1 | 0.01% | 0.01% | 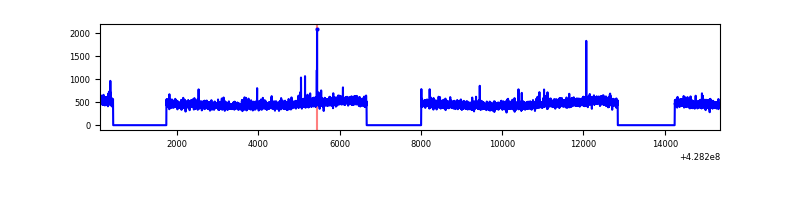 |
| D | 15260 | 11206 | 233 | 233 | 1.53% | 2.08% | 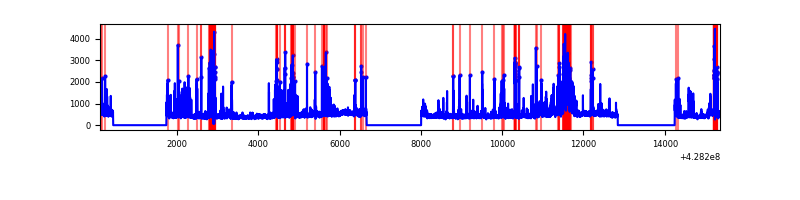 |
Top three noisy pixels from each quadrant. If the there are fewer than three noisy pixels in the level2.evt file, extra rows are filled as -1
| Pixel properties | Quadrant properties | ||||||
|---|---|---|---|---|---|---|---|
| Quadrant | DetID | PixID | Counts | Sigma | Mean | Median | Sigma |
| A | 10 | 83 | 1124461 | 4551.8 | 1209 | 1182 | 246.8 |
| A | 13 | 248 | 50308 | 199.07 | 1209 | 1182 | 246.8 |
| A | 2 | 79 | 22112 | 84.81 | 1209 | 1182 | 246.8 |
| B | 0 | 230 | 96282 | 413.95 | 1200 | 1168 | 229.8 |
| B | 4 | 141 | 44145 | 187.04 | 1200 | 1168 | 229.8 |
| B | 5 | 172 | 36659 | 154.46 | 1200 | 1168 | 229.8 |
| C | 15 | 214 | 473882 | 1720.72 | 1184 | 1188 | 274.7 |
| C | 12 | 249 | 29277 | 102.25 | 1184 | 1188 | 274.7 |
| C | 9 | 54 | 11529 | 37.64 | 1184 | 1188 | 274.7 |
| D | 1 | 52 | 416128 | 1446.02 | 1180 | 1144 | 287.0 |
| D | 12 | 6 | 374693 | 1301.64 | 1180 | 1144 | 287.0 |
| D | 5 | 32 | 314015 | 1090.2 | 1180 | 1144 | 287.0 |
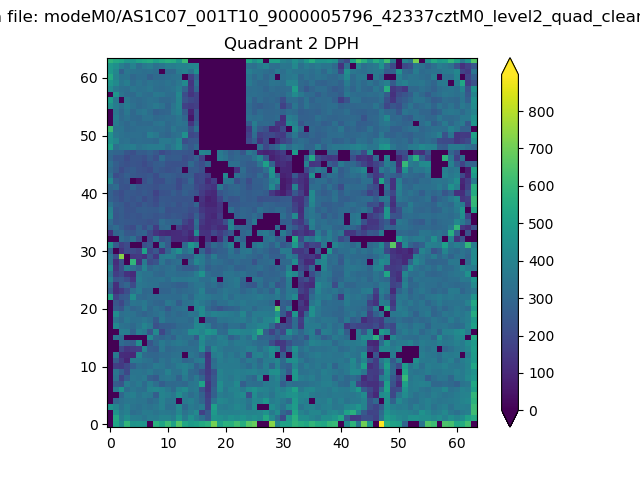
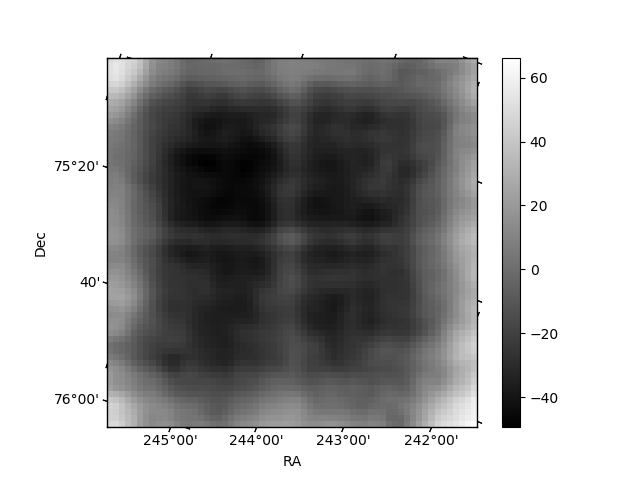
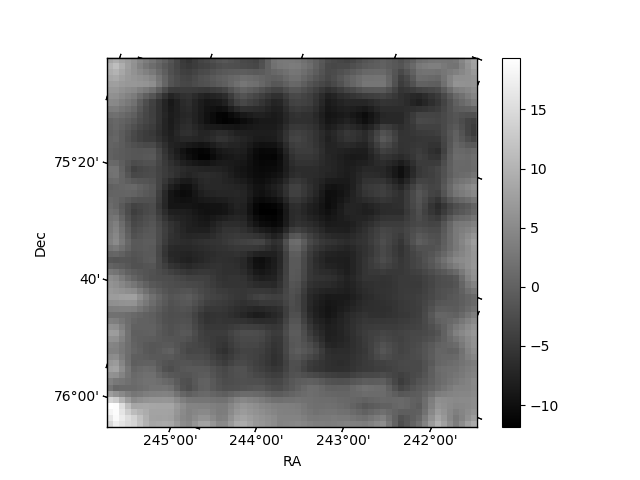
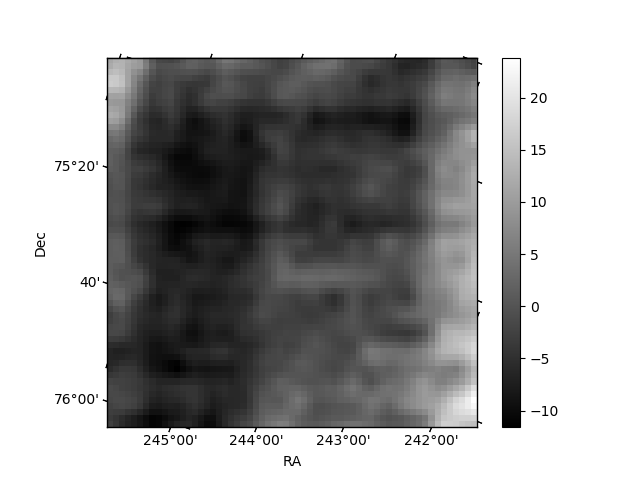
Histogram calculated using DETX and DETY for each event in the final _common_clean file
| Quadrant A | 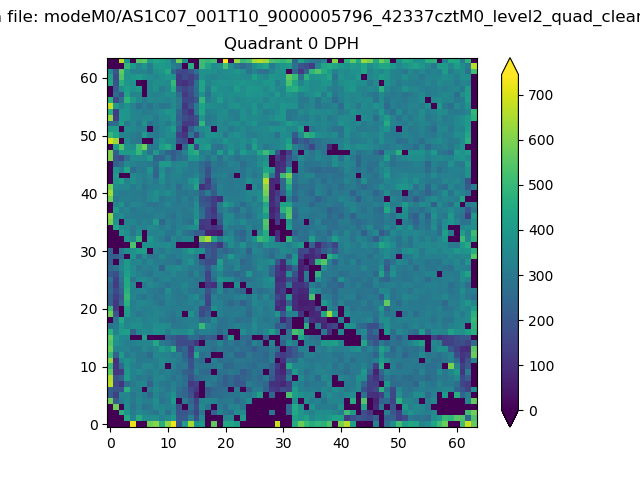 |
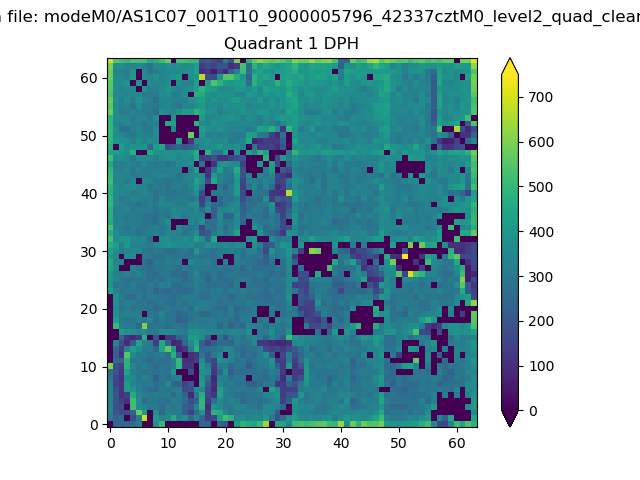 |
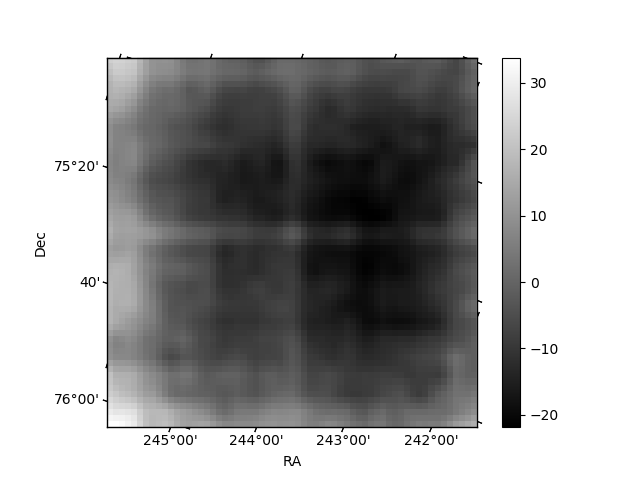
Quadrant B |
|---|---|---|---|
| Quadrant D | 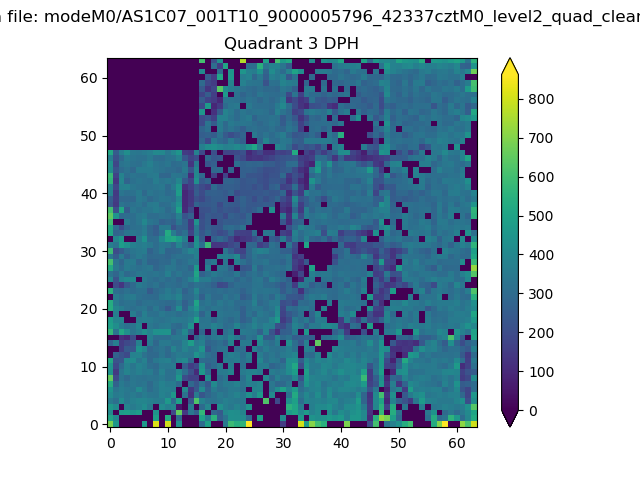 |
 |
Quadrant C |
| Plot type | Count rate plots | Images |
|---|---|---|
| Comparison with Poisson distribution Blue bars denote a histogram of data divided into 1 sec bins. Red curve is a Poisson curve with rate = median count rate of data. |
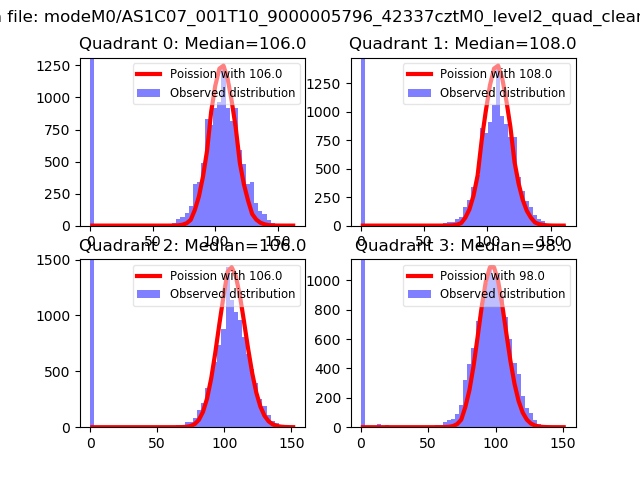 |
 |
| Quadrant-wise count rates Data is divided into 100 sec bins |
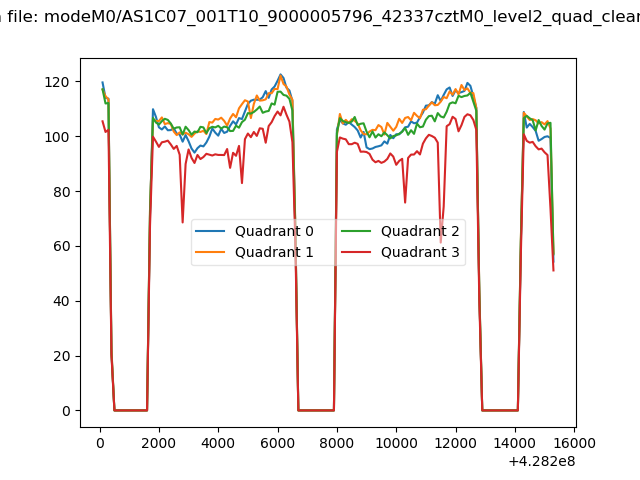 |
|
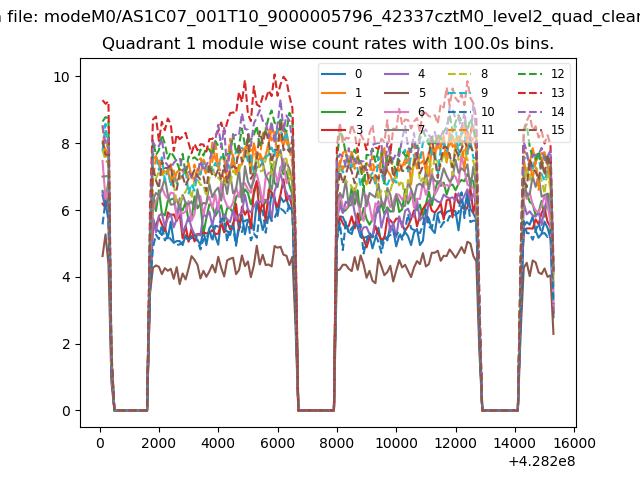
| Module-wise count rates for Quadrant A Data is divided into 100 sec bins |
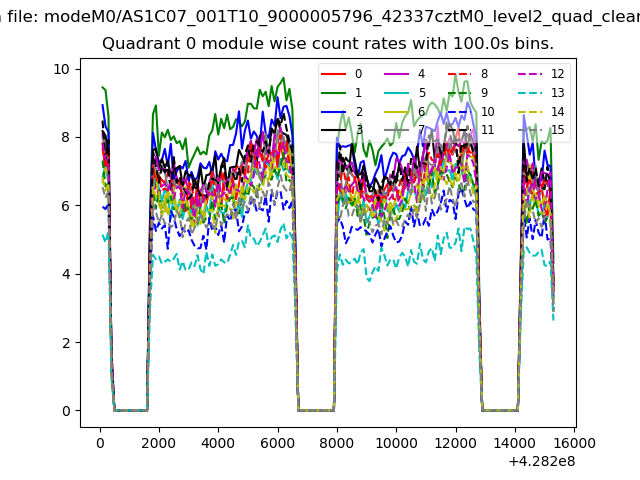 |
 |
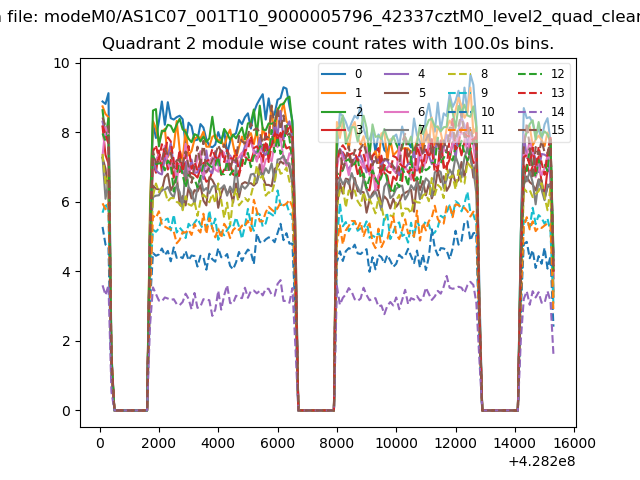
| Module-wise count rates for Quadrant B Data is divided into 100 sec bins |
 |
 |
| Module-wise count rates for Quadrant C Data is divided into 100 sec bins |
 |
 |
| Module-wise count rates for Quadrant D Data is divided into 100 sec bins |
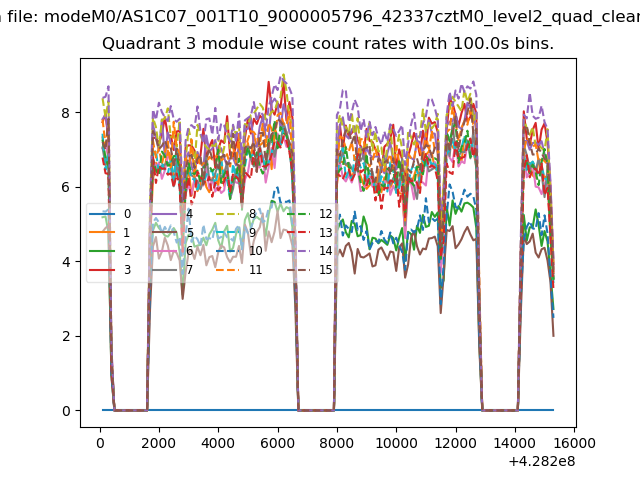 |
 |
| Parameter | Plot |
|---|---|
| CZT HV Monitor | 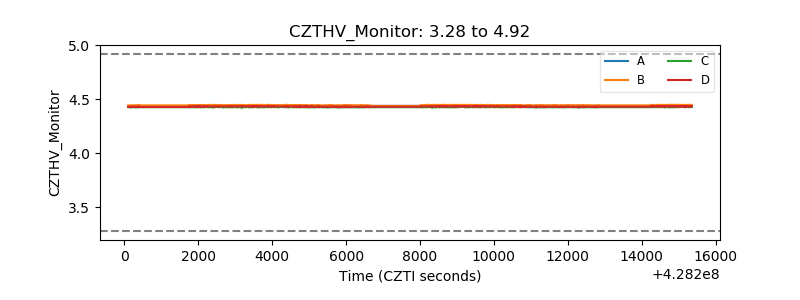 |
| D_VDD | 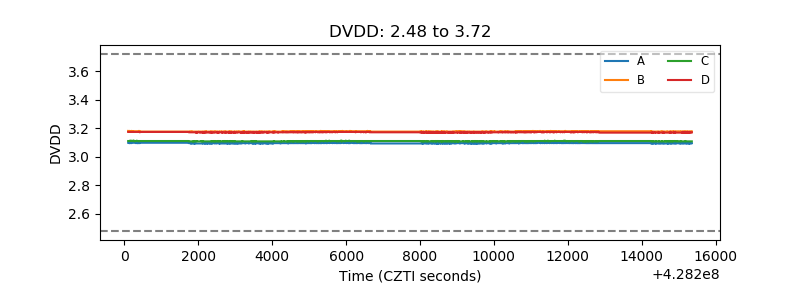 |
| Temperature 1 | 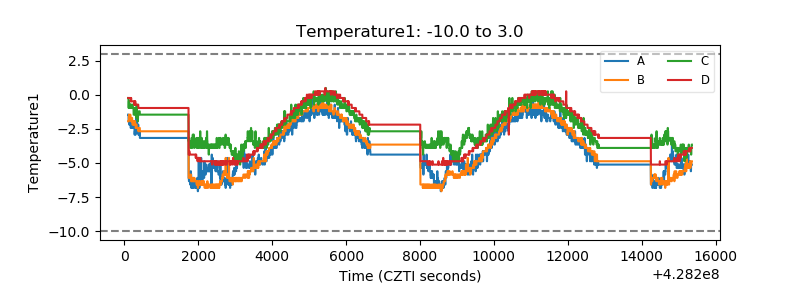 |
| Veto HV Monitor | 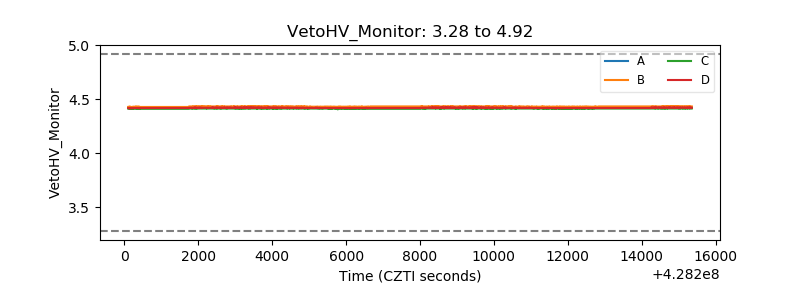 |
| Veto LLD | 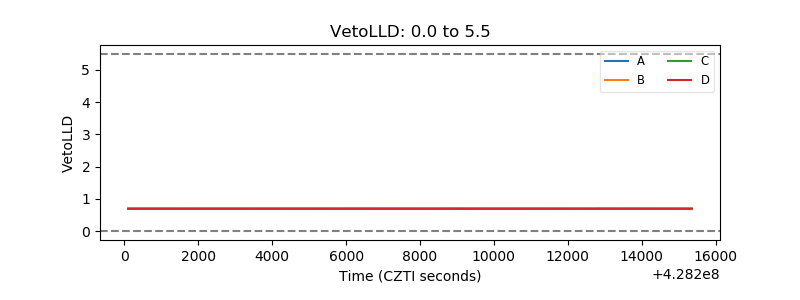 |
| Alpha Counter | 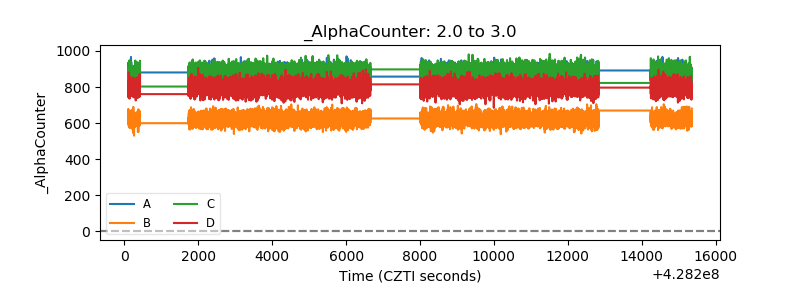 |
| _CPM_Rate |  |
| CZT Counter | 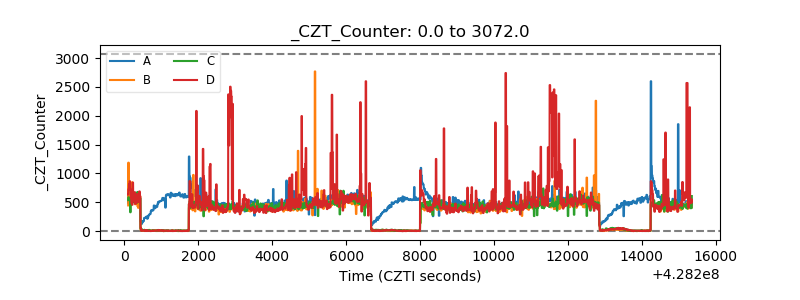 |
| +2.5 Volts monitor | 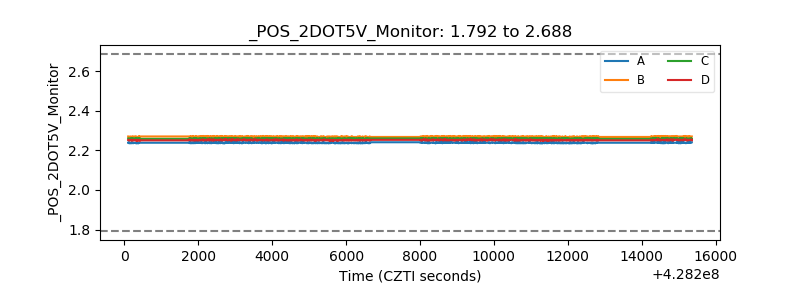 |
| +5 Volts monitor | 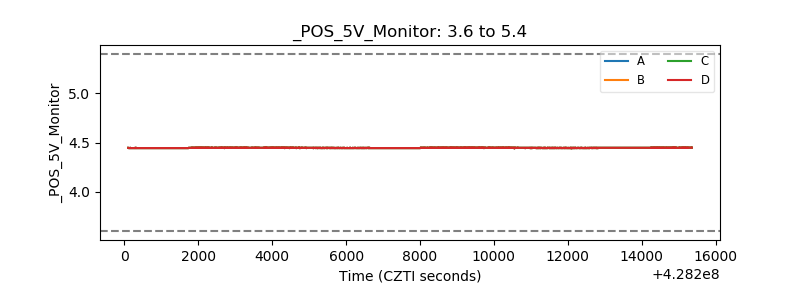 |
| _ROLL_ROT | 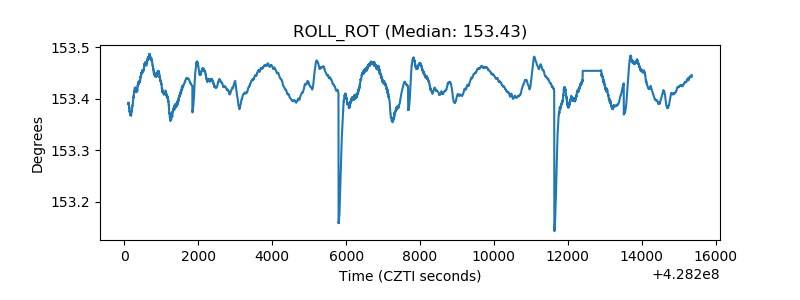 |
| _Roll_DEC | 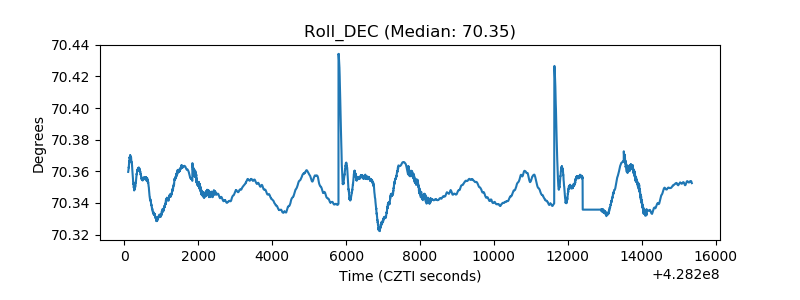 |
| _Roll_RA | 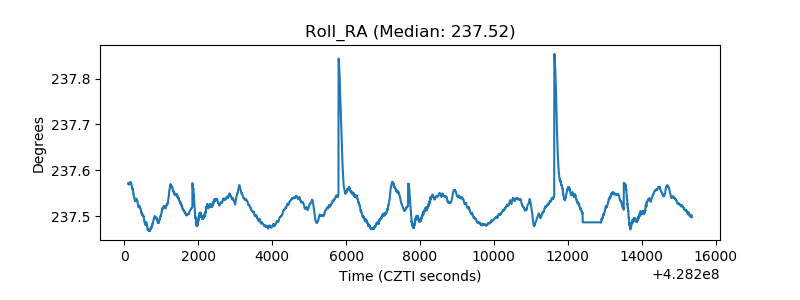 |
| Veto Counter | 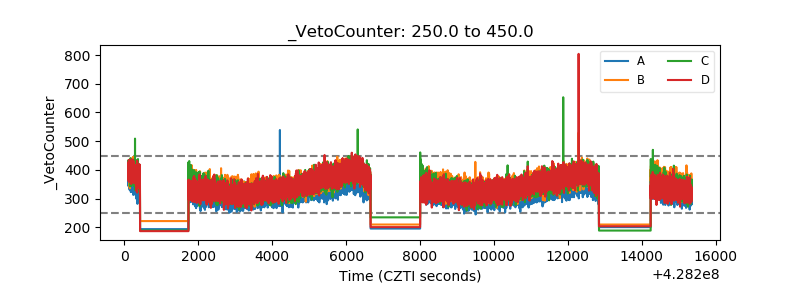 |