| Param | Original file | Final file |
|---|---|---|
| Filename | modeM0/AS1C07_001T10_9000005796_42338cztM0_level2.fits | modeM0/AS1C07_001T10_9000005796_42338cztM0_level2_quad_clean.evt |
| Size (bytes) | 328,066,560 | 92,724,480 |
| Size | 312.9 MB | 88.4 MB |
| Events in quadrant A | 3,125,767 | 612,262 |
| Events in quadrant B | 2,622,044 | 624,933 |
| Events in quadrant C | 2,680,359 | 608,777 |
| Events in quadrant D | 3,264,413 | 557,146 |
| Mode M0 | |||
|---|---|---|---|
| Quadrant | BADHDUFLAG | Total packets | Discarded packets |
| A | 0 | 12618 | 2 |
| B | 0 | 11916 | 2 |
| C | 0 | 11715 | 2 |
| D | 0 | 13827 | 2 |
| Mode SS | |||
|---|---|---|---|
| Quadrant | BADHDUFLAG | Total packets | Discarded packets |
| A | 0 | 118 | 0 |
| B | 0 | 118 | 0 |
| C | 0 | 118 | 0 |
| D | 0 | 118 | 0 |
| Mode M9 | |||
|---|---|---|---|
| Quadrant | BADHDUFLAG | Total packets | Discarded packets |
| A | 0 | 30 | 0 |
| B | 0 | 30 | 0 |
| C | 0 | 30 | 0 |
| D | 0 | 30 | 0 |
| Quadrant | Total seconds | Saturated seconds | Saturation percentage |
|---|---|---|---|
| A | 5792 | 20 | 0.345304% |
| B | 5792 | 17 | 0.293508% |
| C | 5792 | 2 | 0.034530% |
| D | 5793 | 111 | 1.916106% |
Noise dominated data is calculated using 1-second bins in cleaned event files. If a bin has >2000 counts, and if more than 50% of those come from <1% of pixels, then it is considered to be noise-dominated and hence unusable.
| Quadrant | # 1 sec bins | Bins with >0 counts | Bins with >2000 counts | High rate bins dominated by noise | Noise dominated (total time) | Noise dominated (detector-on time) | Marked lightcurve |
|---|---|---|---|---|---|---|---|
| A | 8717 | 5794 | 5 | 5 | 0.06% | 0.09% | 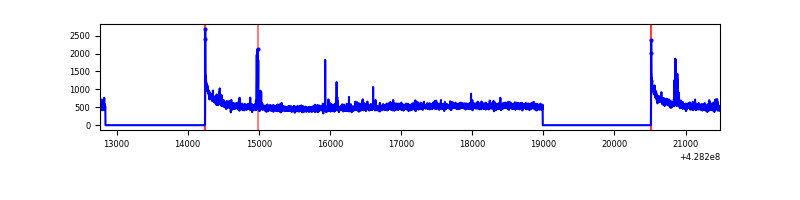 |
| B | 8717 | 5794 | 7 | 7 | 0.08% | 0.12% | 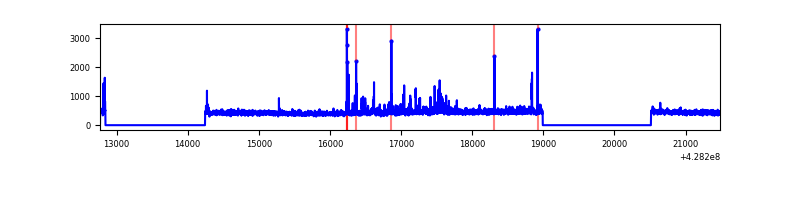 |
| C | 8717 | 5794 | 0 | 0 | 0.00% | 0.00% | 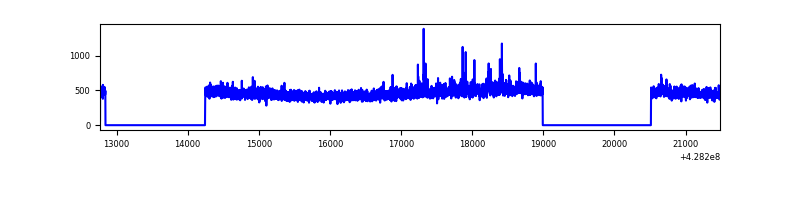 |
| D | 8718 | 5795 | 104 | 104 | 1.19% | 1.79% | 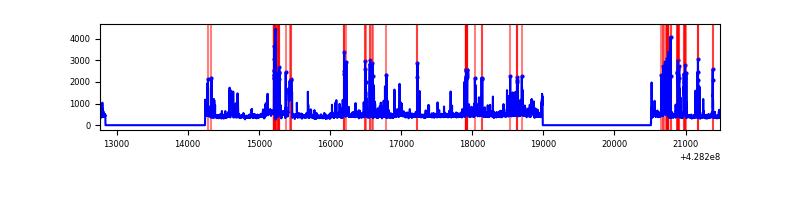 |
Top three noisy pixels from each quadrant. If the there are fewer than three noisy pixels in the level2.evt file, extra rows are filled as -1
| Pixel properties | Quadrant properties | ||||||
|---|---|---|---|---|---|---|---|
| Quadrant | DetID | PixID | Counts | Sigma | Mean | Median | Sigma |
| A | 10 | 83 | 619988 | 4825.57 | 625 | 611 | 128.4 |
| A | 13 | 248 | 37078 | 284.11 | 625 | 611 | 128.4 |
| A | 15 | 252 | 31769 | 242.75 | 625 | 611 | 128.4 |
| B | 5 | 172 | 46789 | 385.82 | 620 | 603 | 119.7 |
| B | 0 | 230 | 35577 | 292.16 | 620 | 603 | 119.7 |
| B | 0 | 245 | 23652 | 192.54 | 620 | 603 | 119.7 |
| C | 15 | 214 | 244553 | 1710.17 | 610 | 614 | 142.6 |
| C | 15 | 111 | 38303 | 264.22 | 610 | 614 | 142.6 |
| C | 7 | 220 | 6899 | 44.06 | 610 | 614 | 142.6 |
| D | 12 | 6 | 322813 | 2172.83 | 609 | 592 | 148.3 |
| D | 1 | 52 | 290238 | 1953.17 | 609 | 592 | 148.3 |
| D | 12 | 233 | 98654 | 661.26 | 609 | 592 | 148.3 |
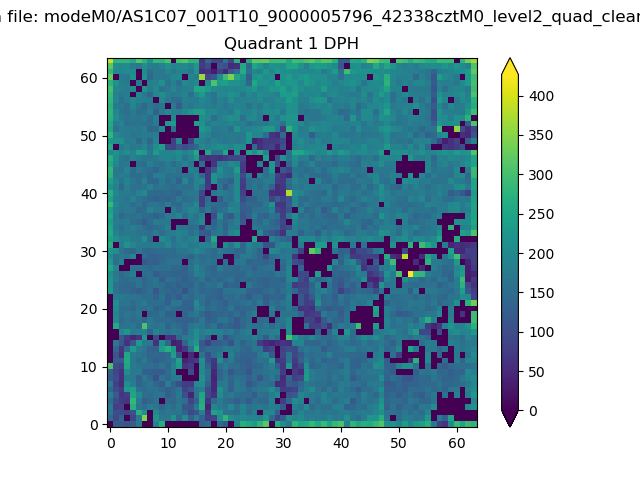
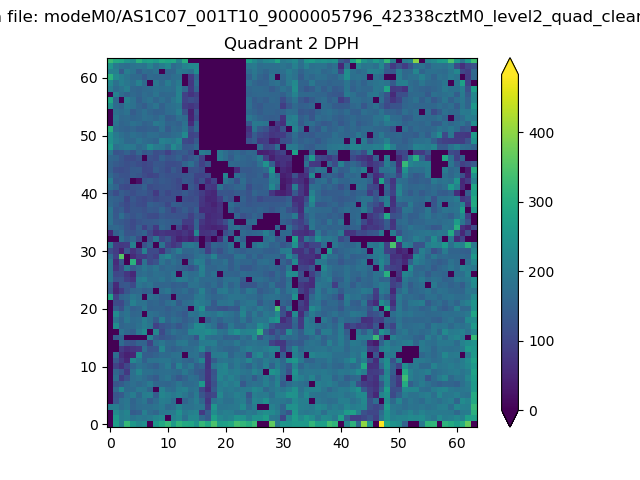
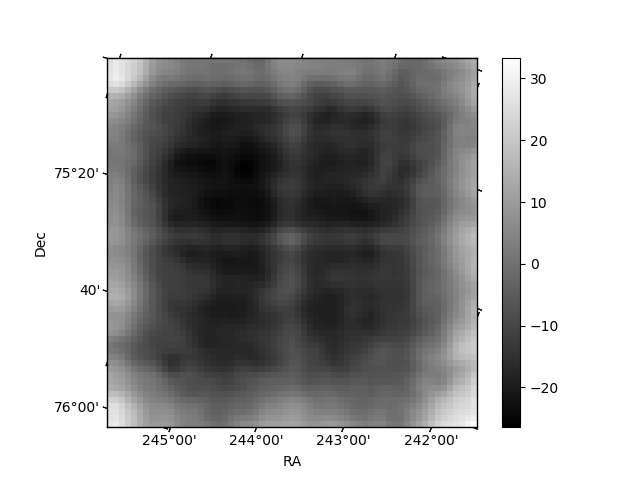
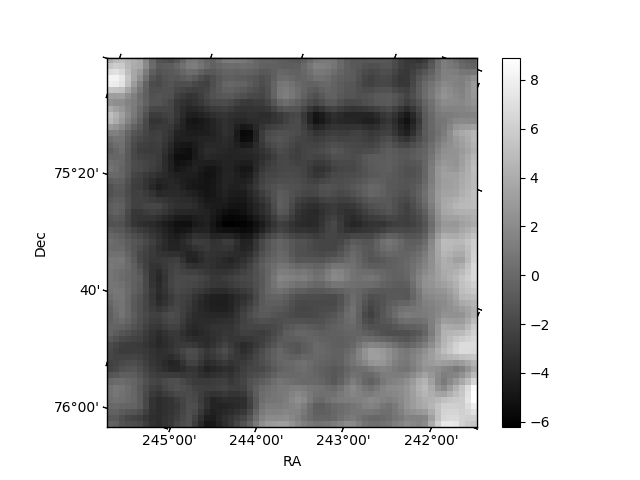
Histogram calculated using DETX and DETY for each event in the final _common_clean file
| Quadrant A |  |
 |
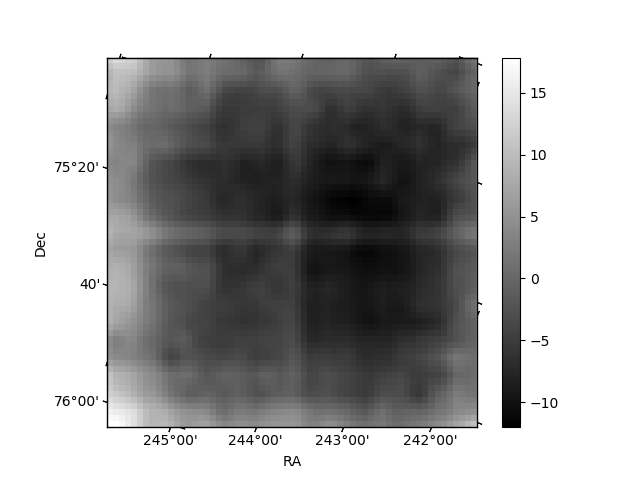
Quadrant B |
|---|---|---|---|
| Quadrant D | 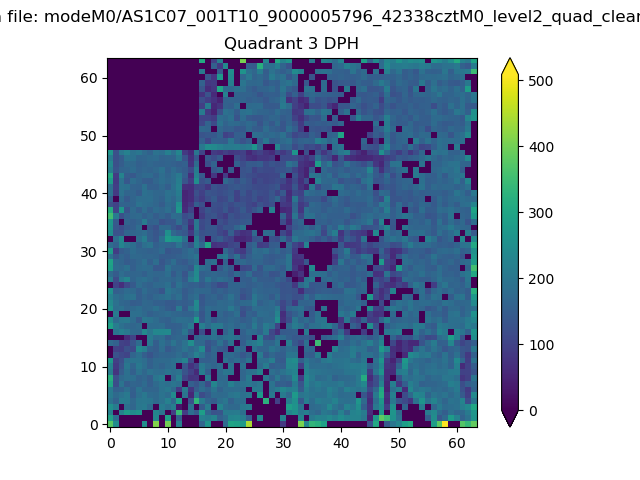 |
 |
Quadrant C |
| Plot type | Count rate plots | Images |
|---|---|---|
| Comparison with Poisson distribution Blue bars denote a histogram of data divided into 1 sec bins. Red curve is a Poisson curve with rate = median count rate of data. |
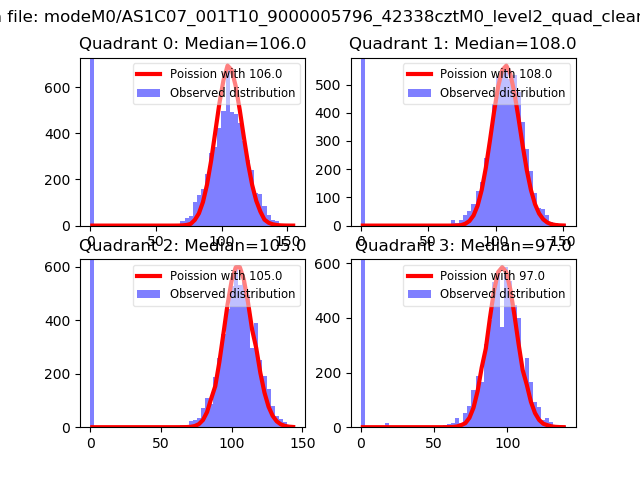 |
 |
| Quadrant-wise count rates Data is divided into 100 sec bins |
 |
|
| Module-wise count rates for Quadrant A Data is divided into 100 sec bins |
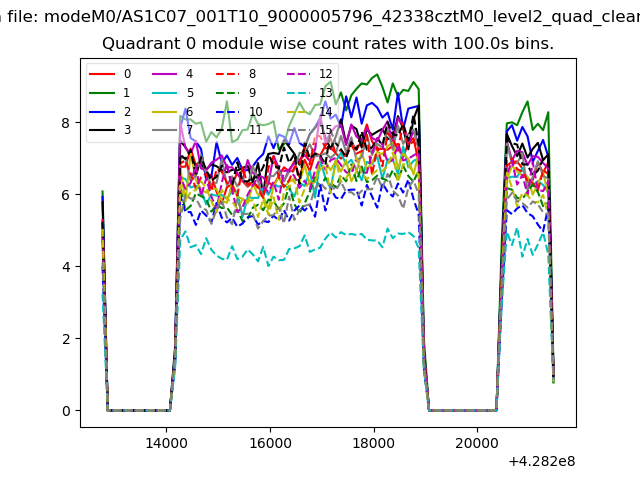 |
 |
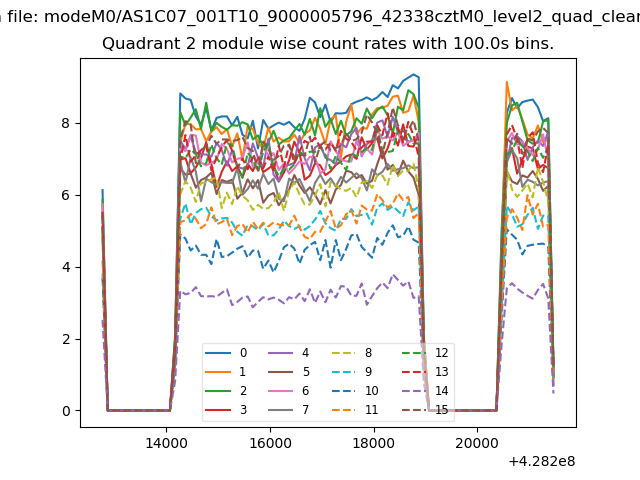
| Module-wise count rates for Quadrant B Data is divided into 100 sec bins |
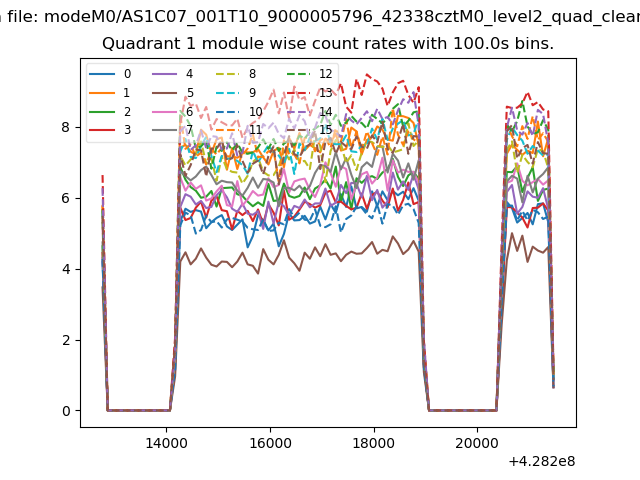 |
 |
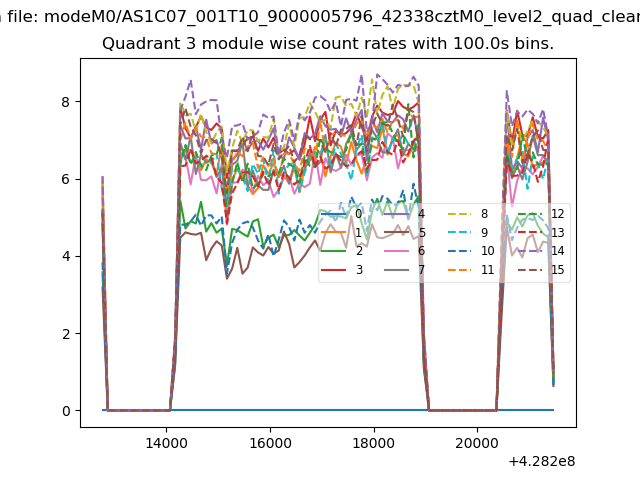
| Module-wise count rates for Quadrant C Data is divided into 100 sec bins |
 |
 |
| Module-wise count rates for Quadrant D Data is divided into 100 sec bins |
 |
 |
| Parameter | Plot |
|---|---|
| CZT HV Monitor | 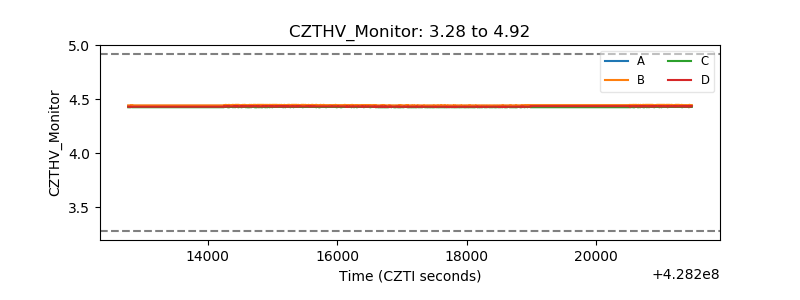 |
| D_VDD | 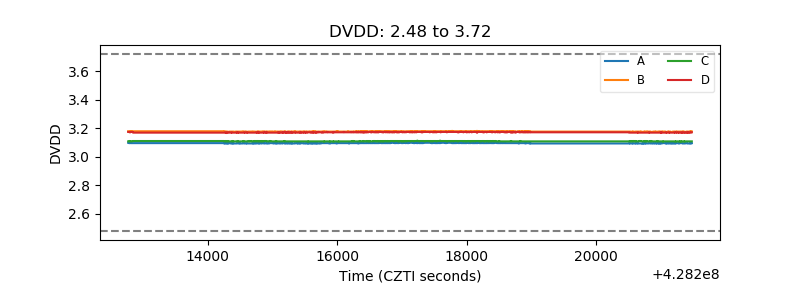 |
| Temperature 1 | 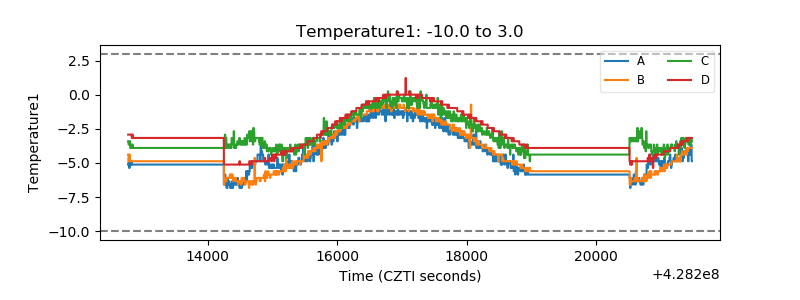 |
| Veto HV Monitor |  |
| Veto LLD | 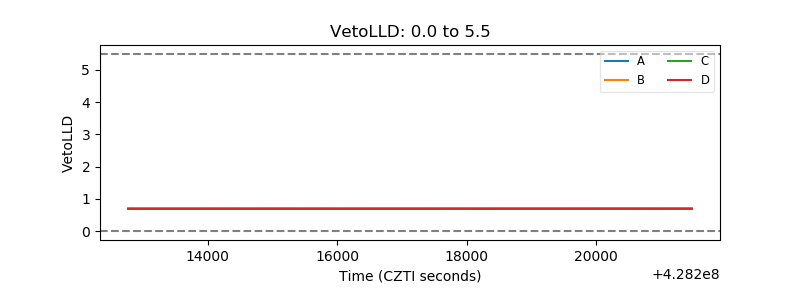 |
| Alpha Counter | 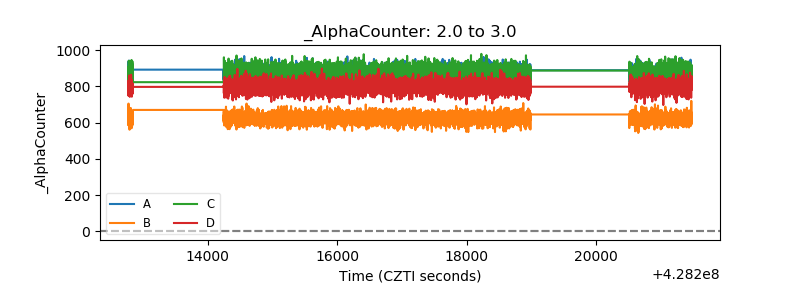 |
| _CPM_Rate | 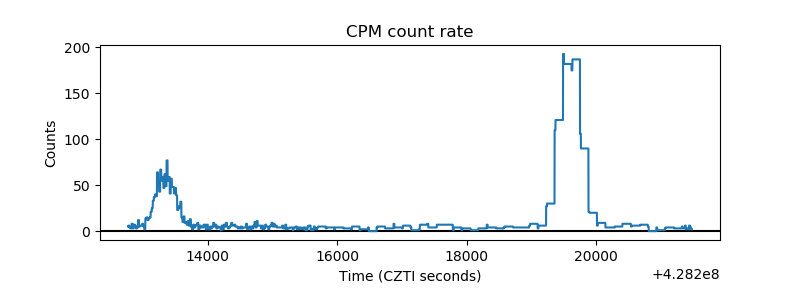 |
| CZT Counter | 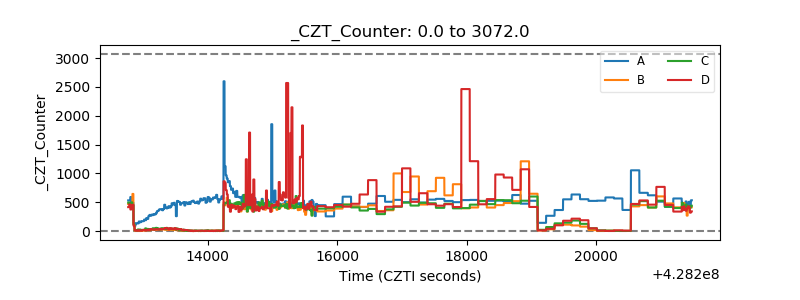 |
| +2.5 Volts monitor | 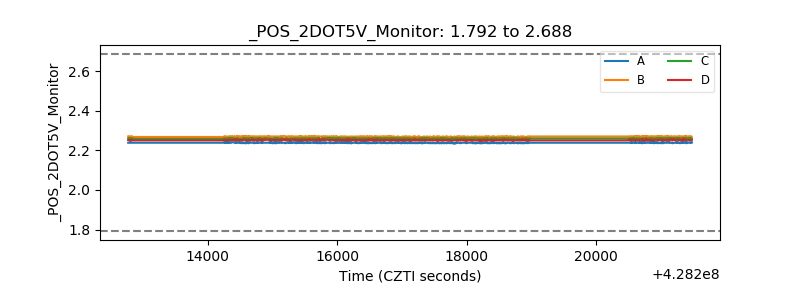 |
| +5 Volts monitor | 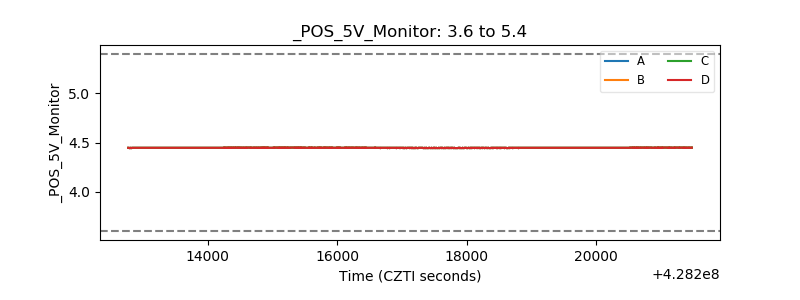 |
| _ROLL_ROT | 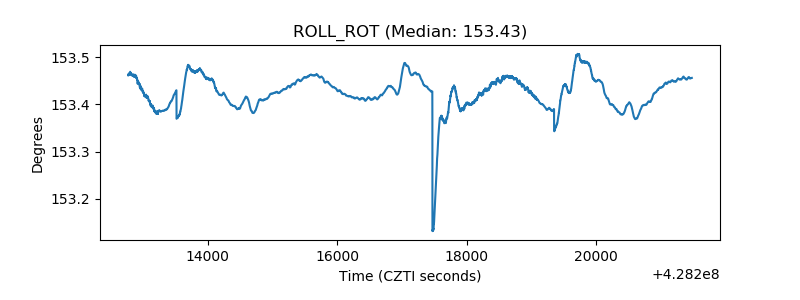 |
| _Roll_DEC | 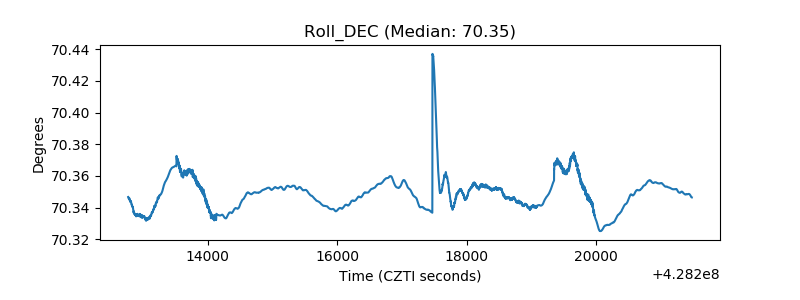 |
| _Roll_RA | 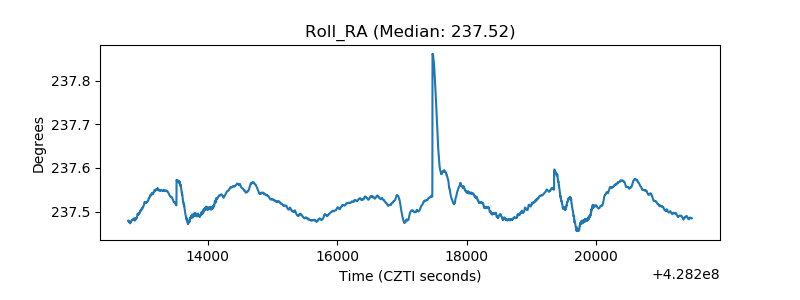 |
| Veto Counter | 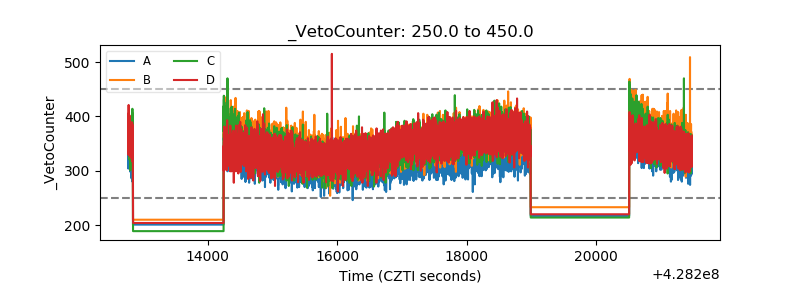 |