| Param | Original file | Final file |
|---|---|---|
| Filename | modeM0/AS1C07_001T10_9000005796_42339cztM0_level2.fits | modeM0/AS1C07_001T10_9000005796_42339cztM0_level2_quad_clean.evt |
| Size (bytes) | 318,144,960 | 89,596,800 |
| Size | 303.4 MB | 85.4 MB |
| Events in quadrant A | 2,983,623 | 596,138 |
| Events in quadrant B | 2,538,881 | 607,795 |
| Events in quadrant C | 2,602,453 | 585,952 |
| Events in quadrant D | 3,221,361 | 536,569 |
| Mode M0 | |||
|---|---|---|---|
| Quadrant | BADHDUFLAG | Total packets | Discarded packets |
| A | 0 | 12092 | 2 |
| B | 0 | 11398 | 2 |
| C | 0 | 11246 | 2 |
| D | 0 | 13471 | 4 |
| Mode SS | |||
|---|---|---|---|
| Quadrant | BADHDUFLAG | Total packets | Discarded packets |
| A | 0 | 112 | 0 |
| B | 0 | 112 | 0 |
| C | 0 | 112 | 0 |
| D | 0 | 112 | 0 |
| Mode M9 | |||
|---|---|---|---|
| Quadrant | BADHDUFLAG | Total packets | Discarded packets |
| A | 0 | 18 | 0 |
| B | 0 | 19 | 0 |
| C | 0 | 19 | 0 |
| D | 0 | 19 | 0 |
| Quadrant | Total seconds | Saturated seconds | Saturation percentage |
|---|---|---|---|
| A | 5522 | 15 | 0.271641% |
| B | 5522 | 16 | 0.289750% |
| C | 5522 | 2 | 0.036219% |
| D | 5521 | 125 | 2.264083% |
Noise dominated data is calculated using 1-second bins in cleaned event files. If a bin has >2000 counts, and if more than 50% of those come from <1% of pixels, then it is considered to be noise-dominated and hence unusable.
| Quadrant | # 1 sec bins | Bins with >0 counts | Bins with >2000 counts | High rate bins dominated by noise | Noise dominated (total time) | Noise dominated (detector-on time) | Marked lightcurve |
|---|---|---|---|---|---|---|---|
| A | 7165 | 5523 | 6 | 6 | 0.08% | 0.11% | 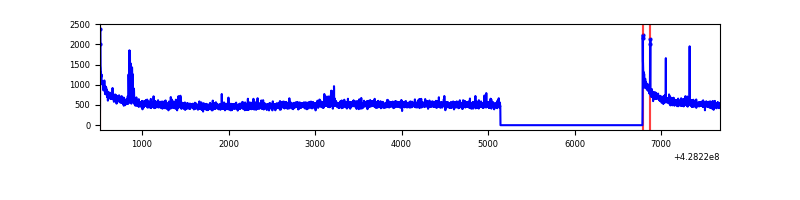 |
| B | 7165 | 5523 | 6 | 6 | 0.08% | 0.11% | 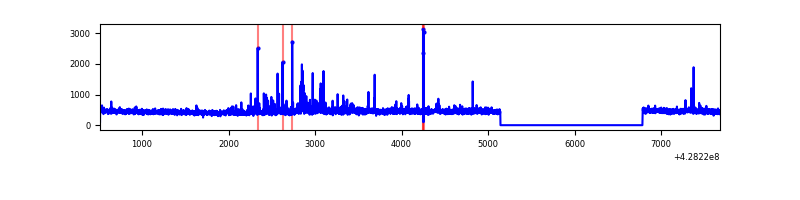 |
| C | 7165 | 5523 | 1 | 1 | 0.01% | 0.02% | 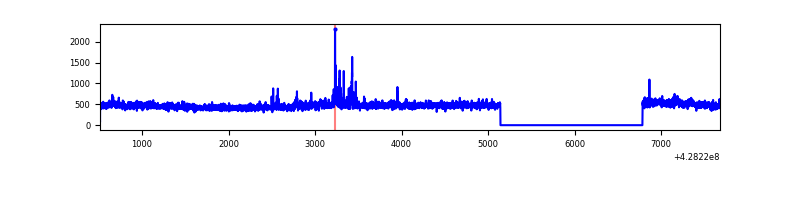 |
| D | 7164 | 5522 | 121 | 121 | 1.69% | 2.19% | 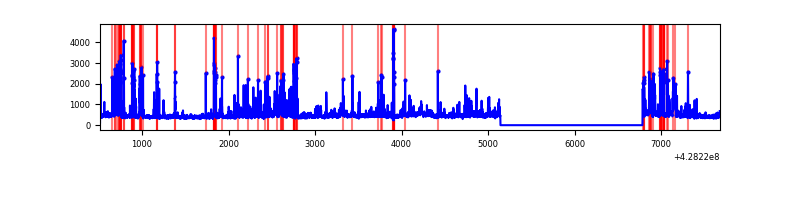 |
Top three noisy pixels from each quadrant. If the there are fewer than three noisy pixels in the level2.evt file, extra rows are filled as -1
| Pixel properties | Quadrant properties | ||||||
|---|---|---|---|---|---|---|---|
| Quadrant | DetID | PixID | Counts | Sigma | Mean | Median | Sigma |
| A | 10 | 83 | 596877 | 4827.23 | 599 | 586 | 123.5 |
| A | 15 | 252 | 33897 | 269.67 | 599 | 586 | 123.5 |
| A | 3 | 1 | 11048 | 84.69 | 599 | 586 | 123.5 |
| B | 0 | 245 | 52398 | 453.82 | 593 | 577 | 114.2 |
| B | 15 | 36 | 44972 | 388.79 | 593 | 577 | 114.2 |
| B | 0 | 230 | 34342 | 295.7 | 593 | 577 | 114.2 |
| C | 15 | 214 | 233172 | 1720.39 | 581 | 583 | 135.2 |
| C | 9 | 54 | 62007 | 454.33 | 581 | 583 | 135.2 |
| C | 15 | 111 | 36663 | 266.87 | 581 | 583 | 135.2 |
| D | 12 | 6 | 270091 | 1883.95 | 581 | 563 | 143.1 |
| D | 1 | 52 | 195839 | 1364.94 | 581 | 563 | 143.1 |
| D | 12 | 233 | 88909 | 617.52 | 581 | 563 | 143.1 |
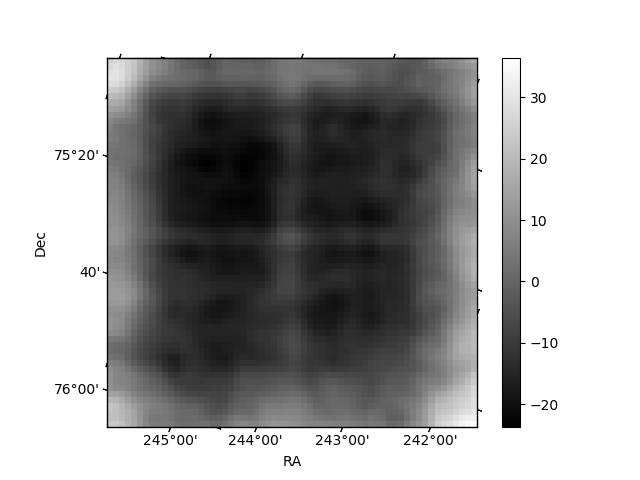
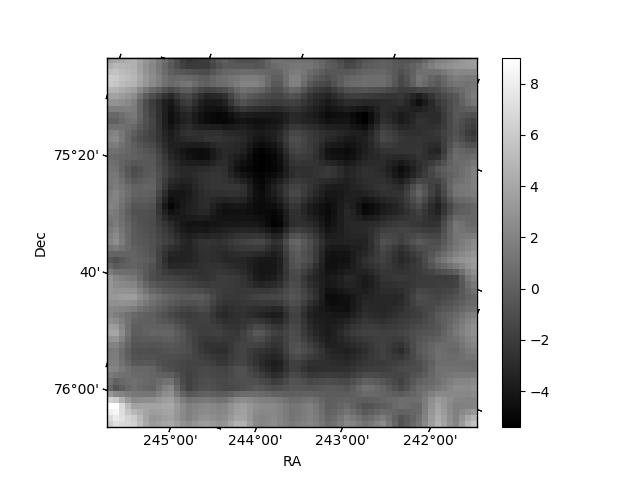
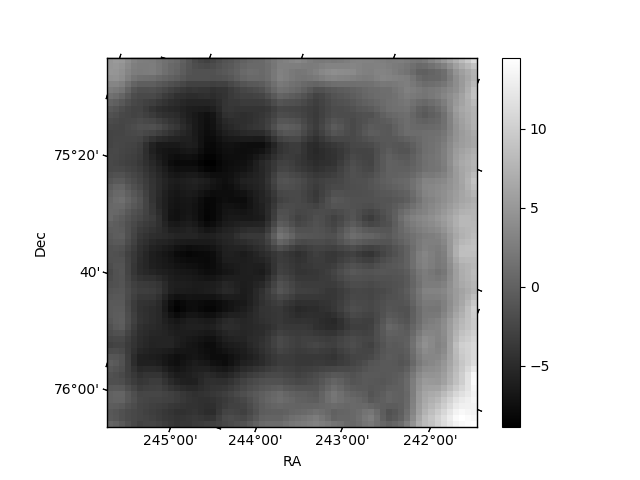
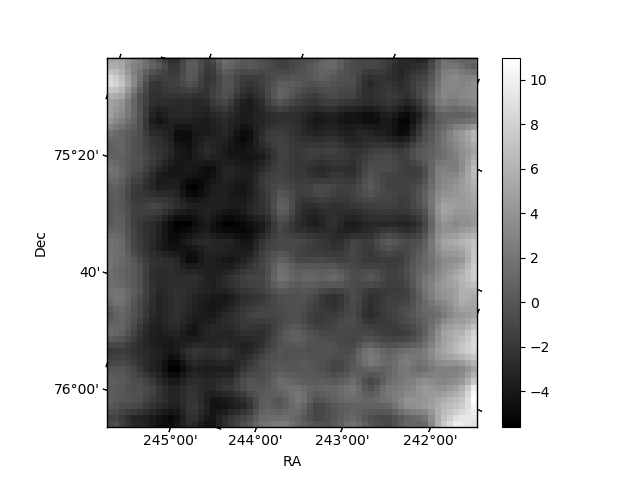
Histogram calculated using DETX and DETY for each event in the final _common_clean file
| Quadrant A | 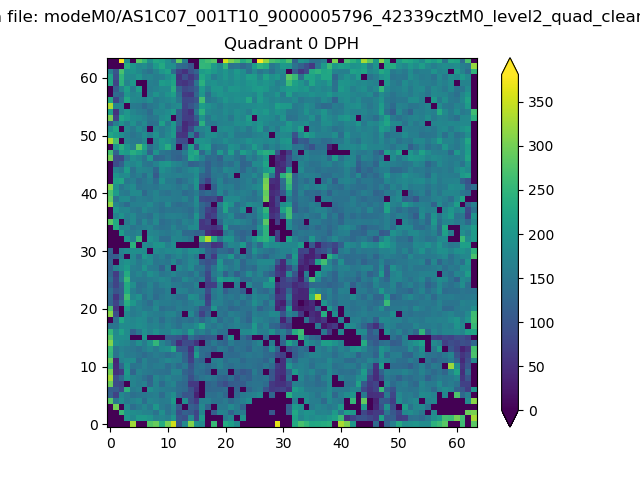 |
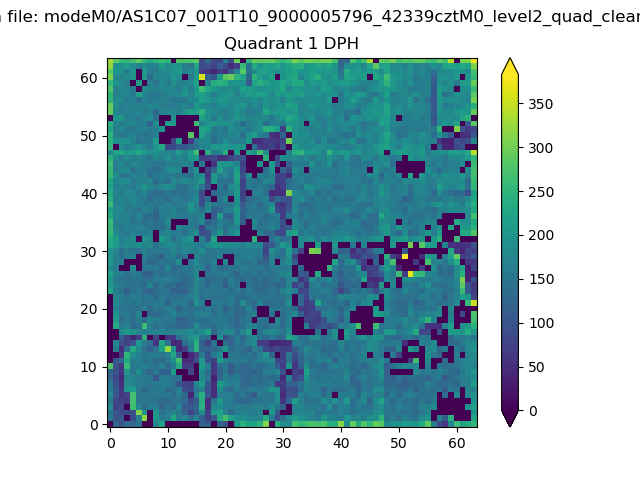 |
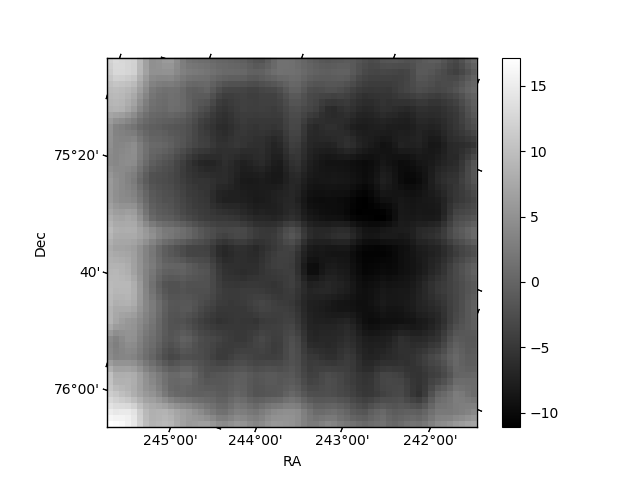
Quadrant B |
|---|---|---|---|
| Quadrant D | 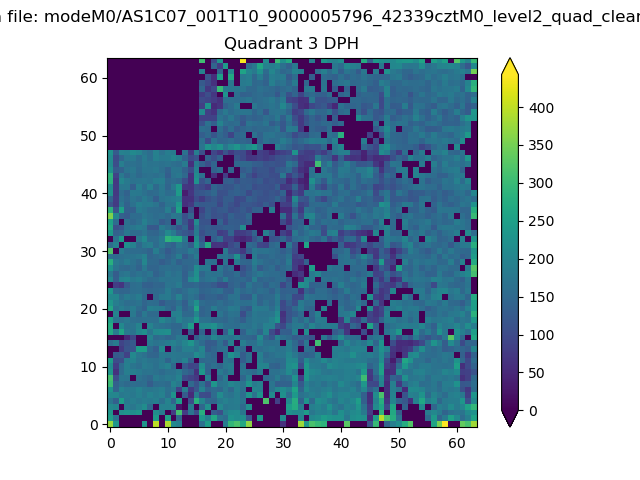 |
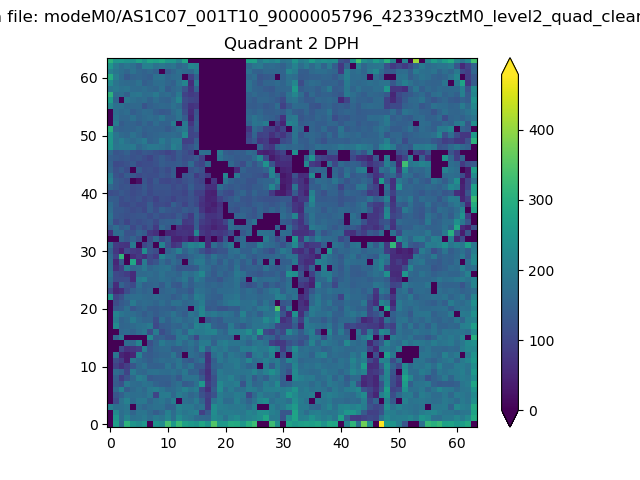 |
Quadrant C |
| Plot type | Count rate plots | Images |
|---|---|---|
| Comparison with Poisson distribution Blue bars denote a histogram of data divided into 1 sec bins. Red curve is a Poisson curve with rate = median count rate of data. |
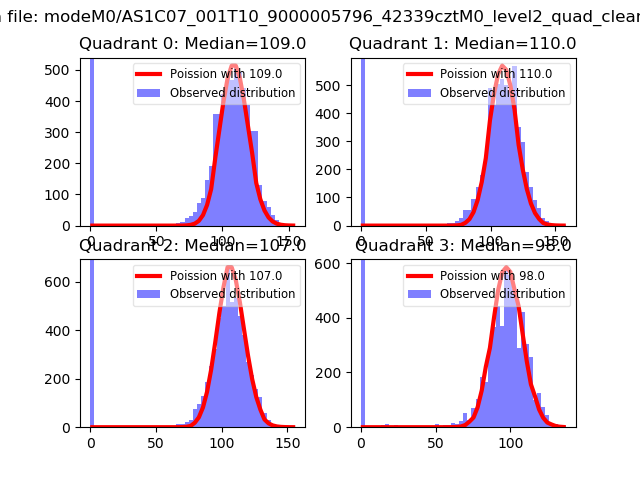 |
 |
| Quadrant-wise count rates Data is divided into 100 sec bins |
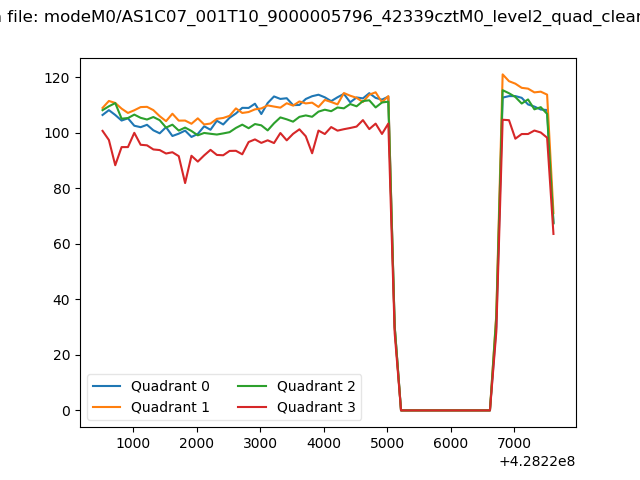 |
|
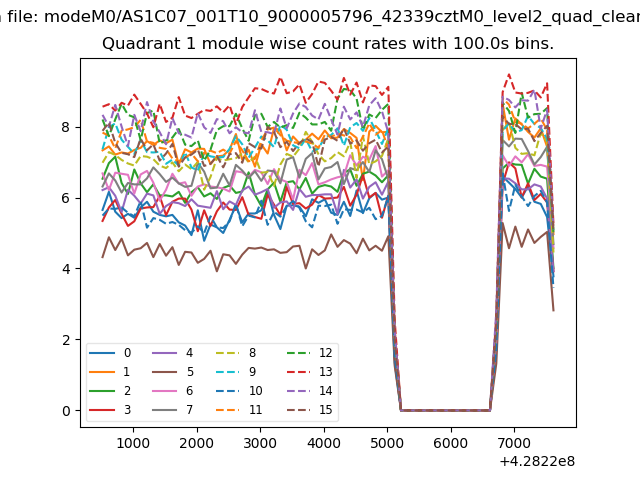
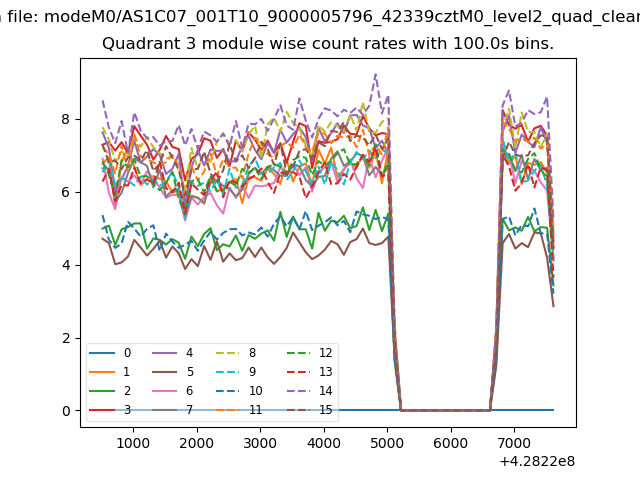
| Module-wise count rates for Quadrant A Data is divided into 100 sec bins |
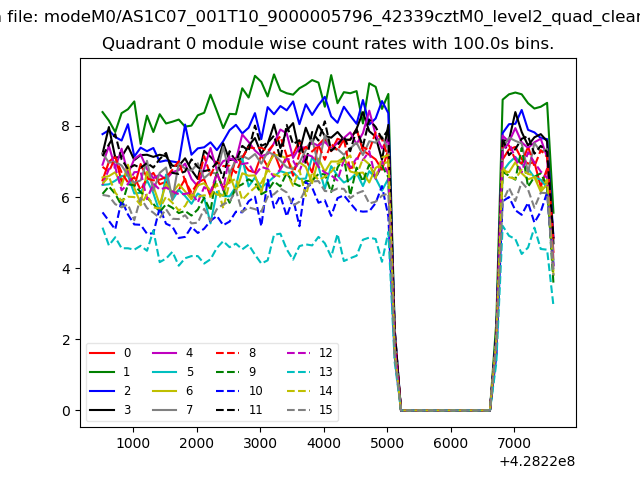 |
 |
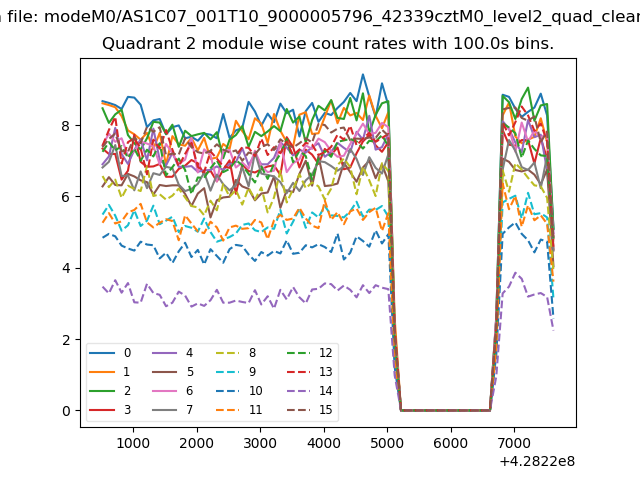
| Module-wise count rates for Quadrant B Data is divided into 100 sec bins |
 |
 |
| Module-wise count rates for Quadrant C Data is divided into 100 sec bins |
 |
 |
| Module-wise count rates for Quadrant D Data is divided into 100 sec bins |
 |
 |
| Parameter | Plot |
|---|---|
| CZT HV Monitor | 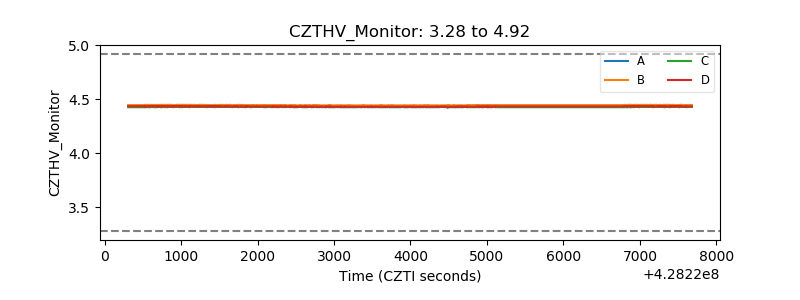 |
| D_VDD | 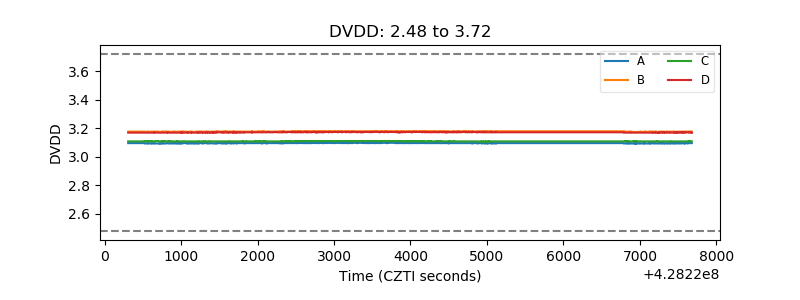 |
| Temperature 1 | 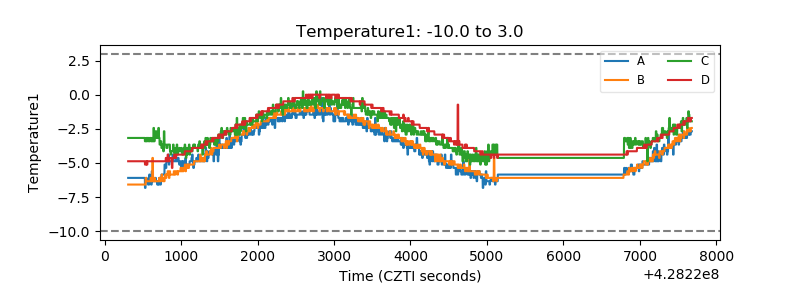 |
| Veto HV Monitor | 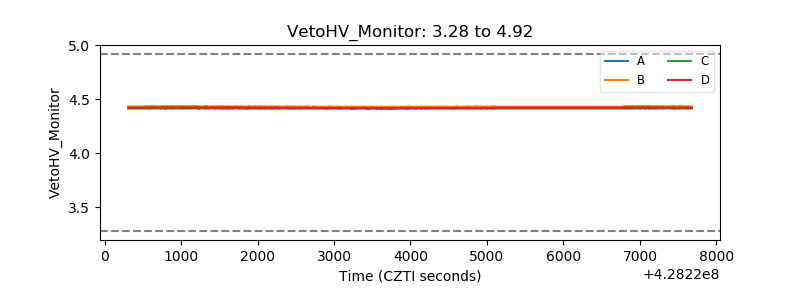 |
| Veto LLD | 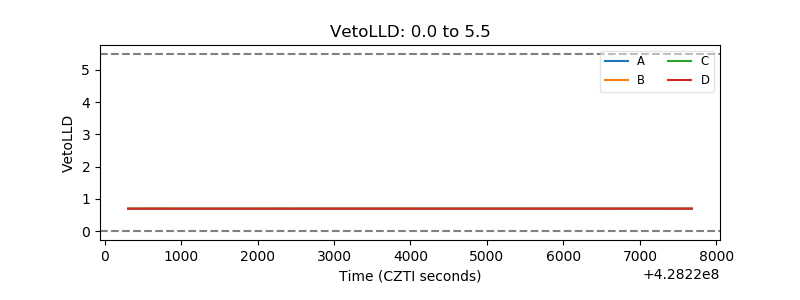 |
| Alpha Counter | 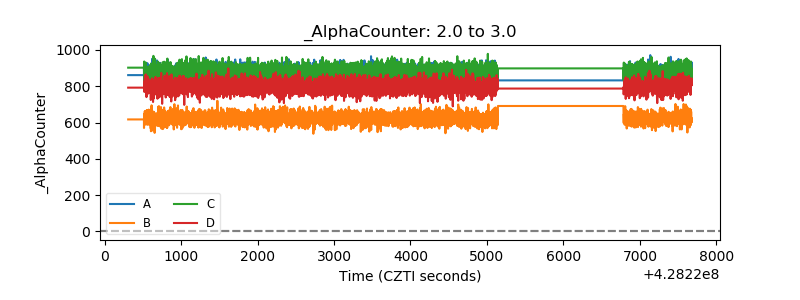 |
| _CPM_Rate | 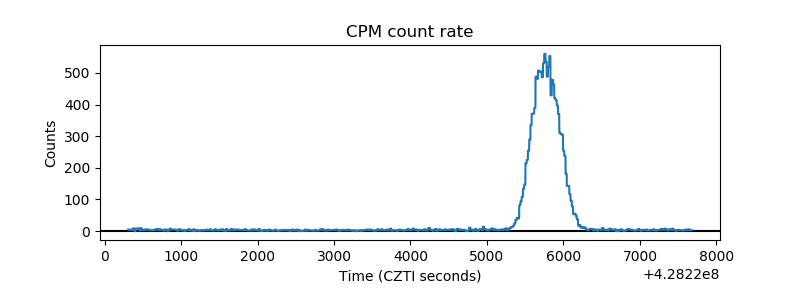 |
| CZT Counter | 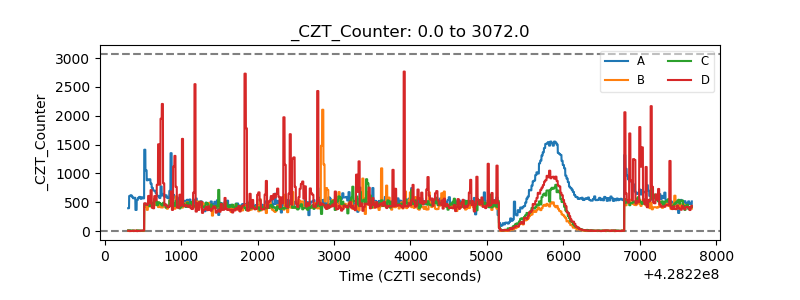 |
| +2.5 Volts monitor | 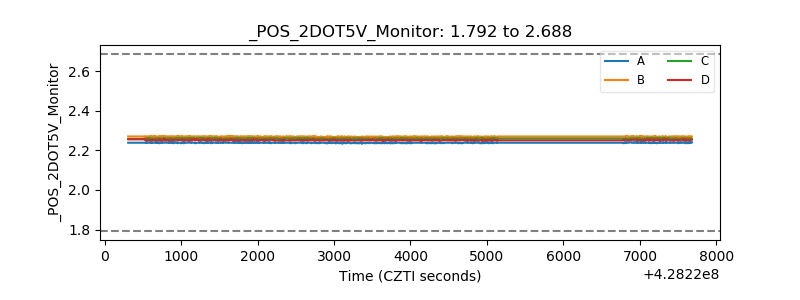 |
| +5 Volts monitor |  |
| _ROLL_ROT | 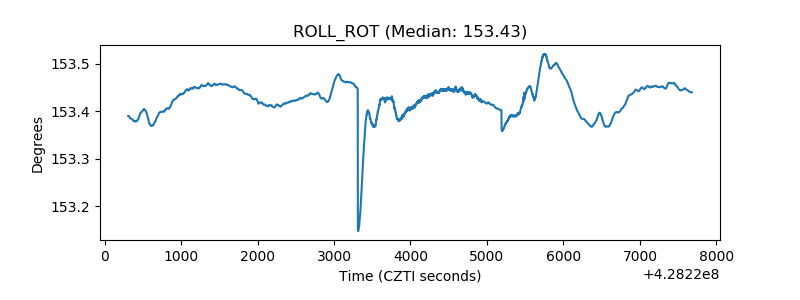 |
| _Roll_DEC | 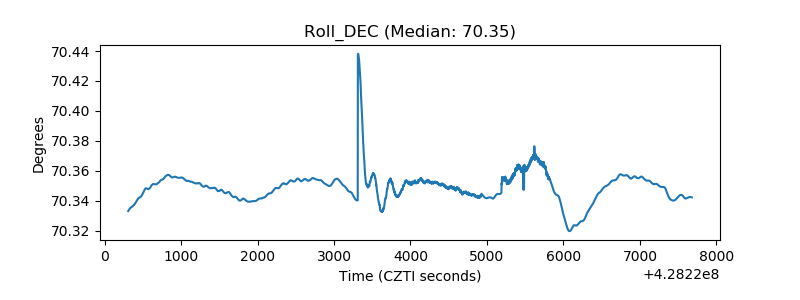 |
| _Roll_RA | 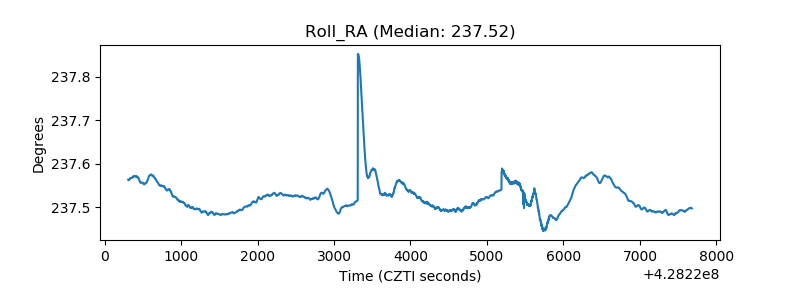 |
| Veto Counter | 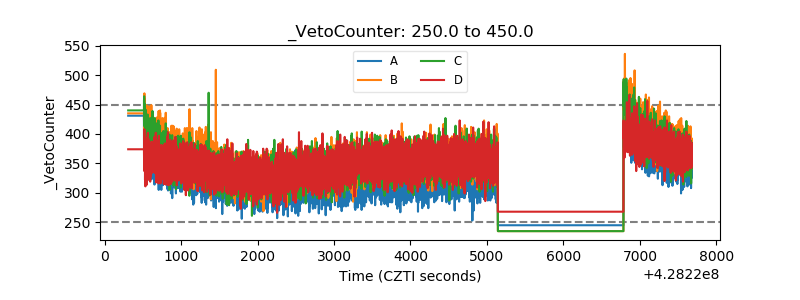 |