| Param | Original file | Final file |
|---|---|---|
| Filename | modeM0/AS1A12_102T01_9000005798_42342cztM0_level2.fits | modeM0/AS1A12_102T01_9000005798_42342cztM0_level2_quad_clean.evt |
| Size (bytes) | 207,144,000 | 60,566,400 |
| Size | 197.5 MB | 57.8 MB |
| Events in quadrant A | 1,899,724 | 414,768 |
| Events in quadrant B | 1,683,716 | 415,217 |
| Events in quadrant C | 1,650,171 | 395,280 |
| Events in quadrant D | 2,167,959 | 368,073 |
| Mode M9 | |||
|---|---|---|---|
| Quadrant | BADHDUFLAG | Total packets | Discarded packets |
| A | 0 | 20 | 0 |
| B | 0 | 20 | 0 |
| C | 0 | 20 | 0 |
| D | 0 | 20 | 0 |
| Mode SS | |||
|---|---|---|---|
| Quadrant | BADHDUFLAG | Total packets | Discarded packets |
| A | 0 | 68 | 0 |
| B | 0 | 68 | 0 |
| C | 0 | 68 | 0 |
| D | 0 | 68 | 0 |
| Mode M0 | |||
|---|---|---|---|
| Quadrant | BADHDUFLAG | Total packets | Discarded packets |
| A | 0 | 7644 | 1 |
| B | 0 | 7240 | 1 |
| C | 0 | 6932 | 1 |
| D | 0 | 8680 | 1 |
| Quadrant | Total seconds | Saturated seconds | Saturation percentage |
|---|---|---|---|
| A | 3401 | 7 | 0.205822% |
| B | 3401 | 33 | 0.970303% |
| C | 3401 | 2 | 0.058806% |
| D | 3401 | 41 | 1.205528% |
Noise dominated data is calculated using 1-second bins in cleaned event files. If a bin has >2000 counts, and if more than 50% of those come from <1% of pixels, then it is considered to be noise-dominated and hence unusable.
| Quadrant | # 1 sec bins | Bins with >0 counts | Bins with >2000 counts | High rate bins dominated by noise | Noise dominated (total time) | Noise dominated (detector-on time) | Marked lightcurve |
|---|---|---|---|---|---|---|---|
| A | 5345 | 3402 | 2 | 2 | 0.04% | 0.06% | 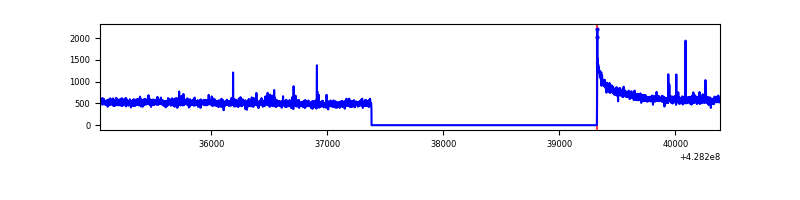 |
| B | 5345 | 3402 | 18 | 18 | 0.34% | 0.53% | 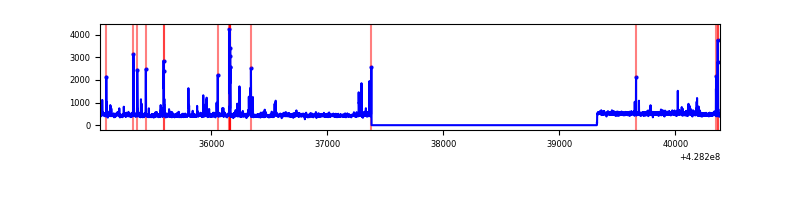 |
| C | 5345 | 3402 | 1 | 1 | 0.02% | 0.03% | 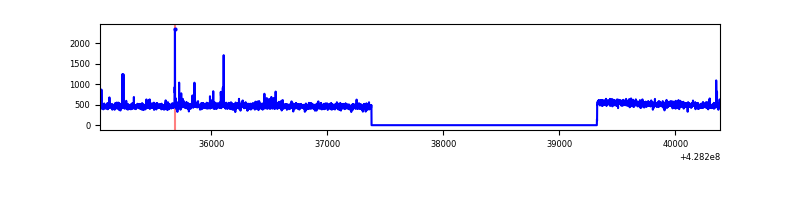 |
| D | 5345 | 3402 | 40 | 40 | 0.75% | 1.18% | 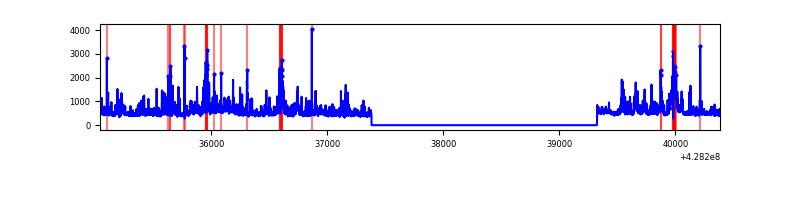 |
Top three noisy pixels from each quadrant. If the there are fewer than three noisy pixels in the level2.evt file, extra rows are filled as -1
| Pixel properties | Quadrant properties | ||||||
|---|---|---|---|---|---|---|---|
| Quadrant | DetID | PixID | Counts | Sigma | Mean | Median | Sigma |
| A | 10 | 83 | 365105 | 4581.35 | 386 | 377 | 79.6 |
| A | 13 | 6 | 13179 | 160.81 | 386 | 377 | 79.6 |
| A | 13 | 248 | 9695 | 117.04 | 386 | 377 | 79.6 |
| B | 5 | 172 | 85775 | 1163.89 | 382 | 372 | 73.4 |
| B | 5 | 32 | 17839 | 238.04 | 382 | 372 | 73.4 |
| B | 15 | 35 | 17780 | 237.24 | 382 | 372 | 73.4 |
| C | 15 | 214 | 145301 | 1632.91 | 378 | 381 | 88.7 |
| C | 15 | 111 | 17595 | 193.96 | 378 | 381 | 88.7 |
| C | 15 | 159 | 12237 | 133.59 | 378 | 381 | 88.7 |
| D | 5 | 222 | 177776 | 1900.25 | 380 | 369 | 93.4 |
| D | 1 | 52 | 170762 | 1825.12 | 380 | 369 | 93.4 |
| D | 12 | 0 | 124979 | 1334.73 | 380 | 369 | 93.4 |
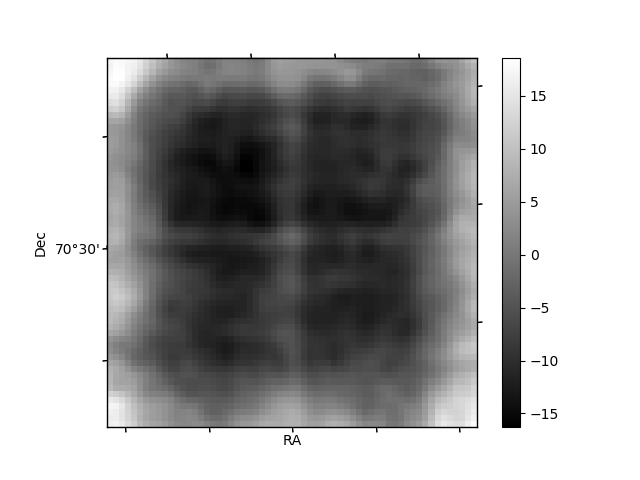
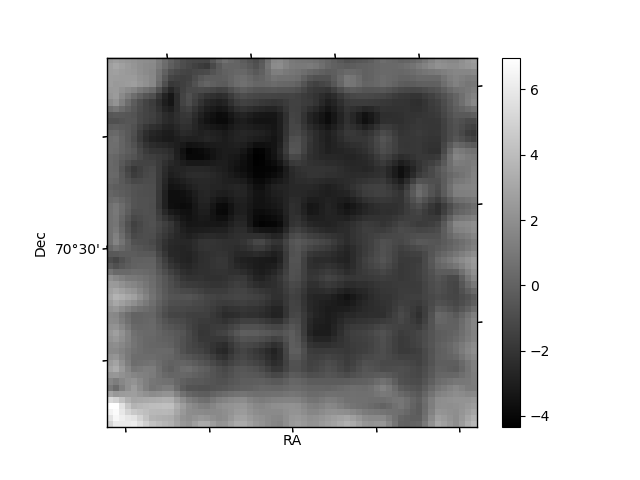
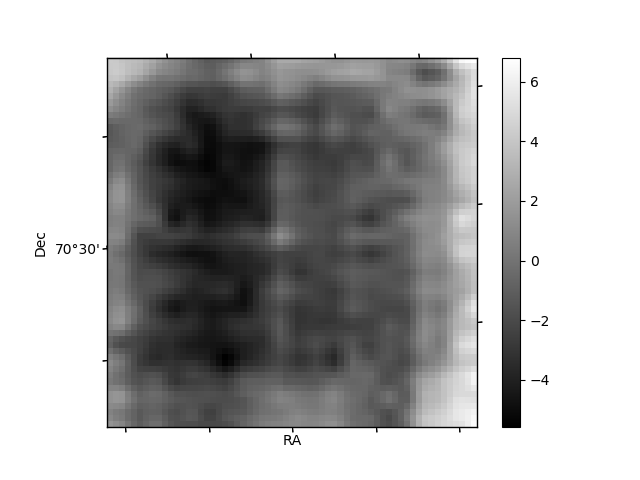
Histogram calculated using DETX and DETY for each event in the final _common_clean file
| Quadrant A | 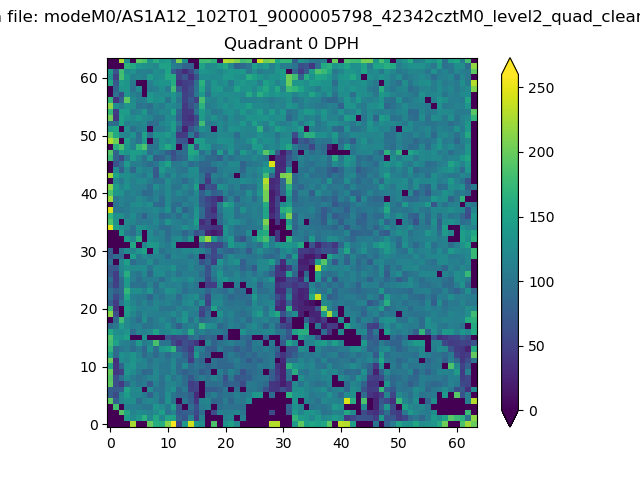 |
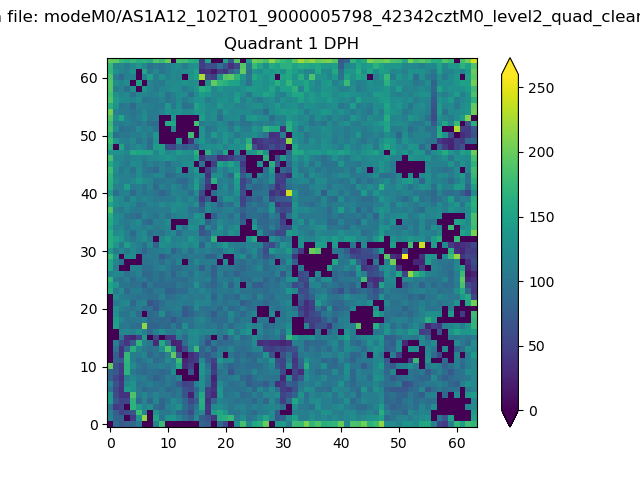 |
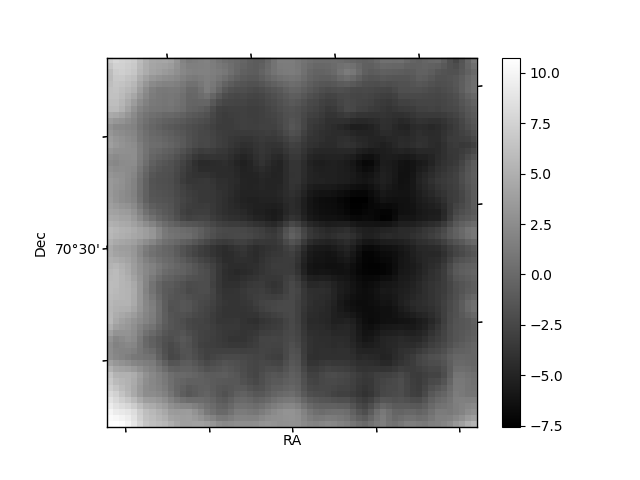
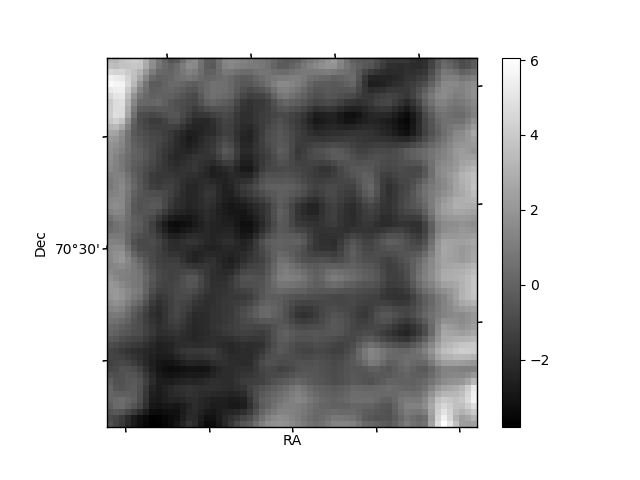
Quadrant B |
|---|---|---|---|
| Quadrant D | 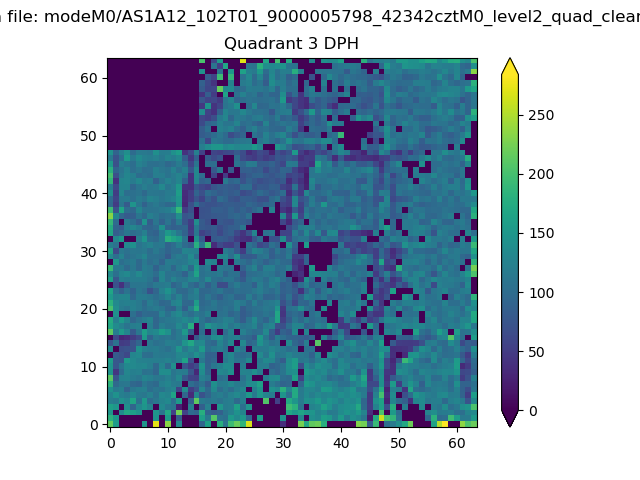 |
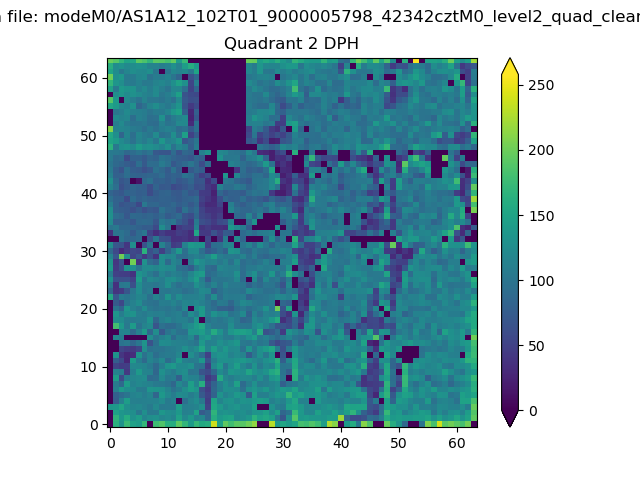 |
Quadrant C |
| Plot type | Count rate plots | Images |
|---|---|---|
| Comparison with Poisson distribution Blue bars denote a histogram of data divided into 1 sec bins. Red curve is a Poisson curve with rate = median count rate of data. |
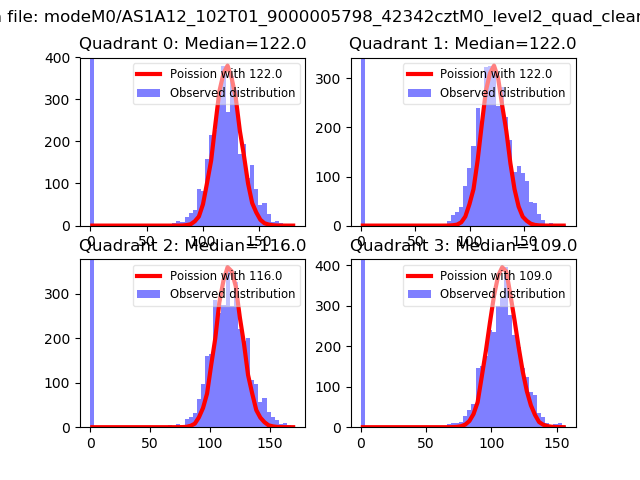 |
 |
| Quadrant-wise count rates Data is divided into 100 sec bins |
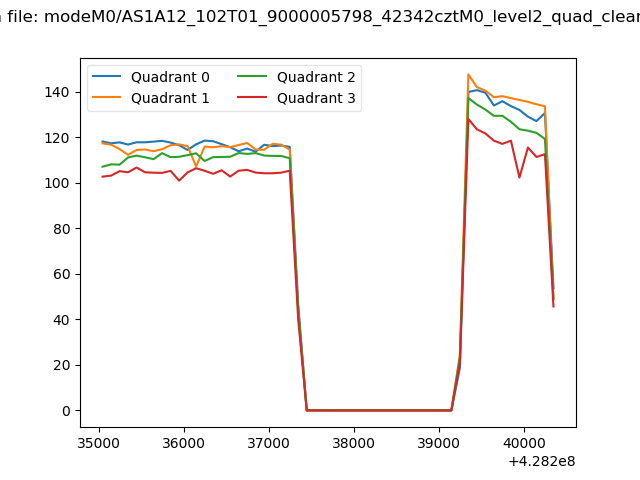 |
|
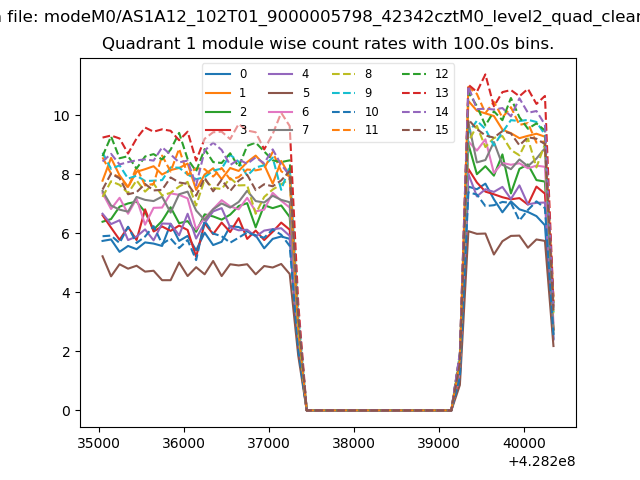
| Module-wise count rates for Quadrant A Data is divided into 100 sec bins |
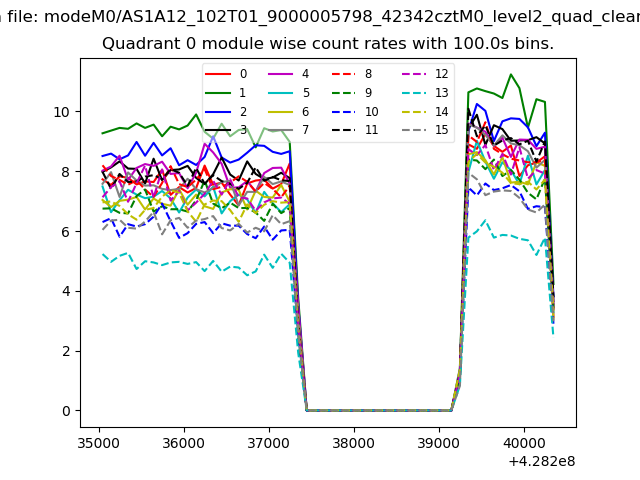 |
 |
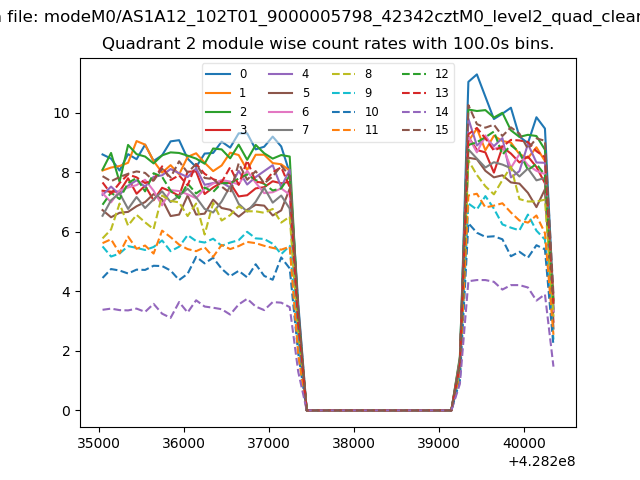
| Module-wise count rates for Quadrant B Data is divided into 100 sec bins |
 |
 |
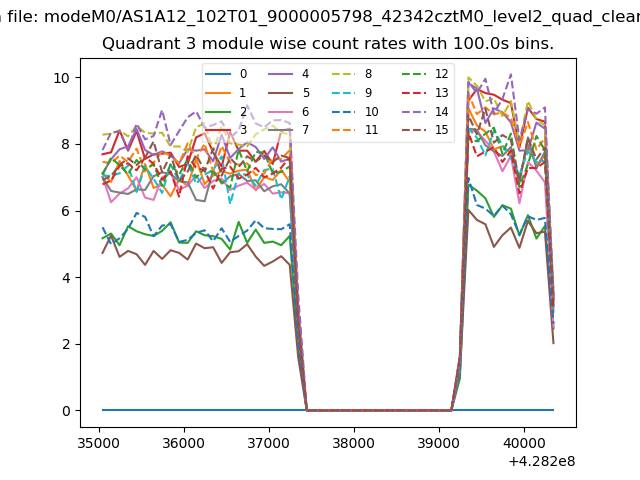
| Module-wise count rates for Quadrant C Data is divided into 100 sec bins |
 |
 |
| Module-wise count rates for Quadrant D Data is divided into 100 sec bins |
 |
 |
| Parameter | Plot |
|---|---|
| CZT HV Monitor | 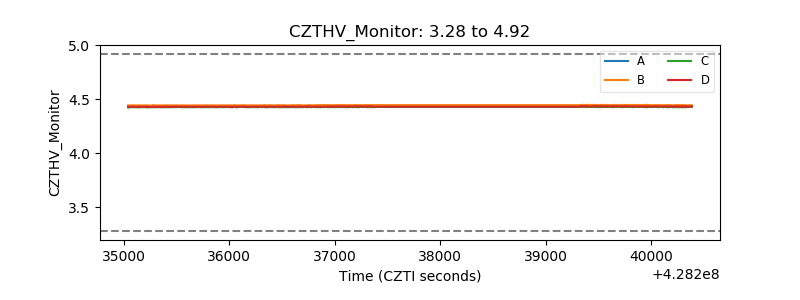 |
| D_VDD | 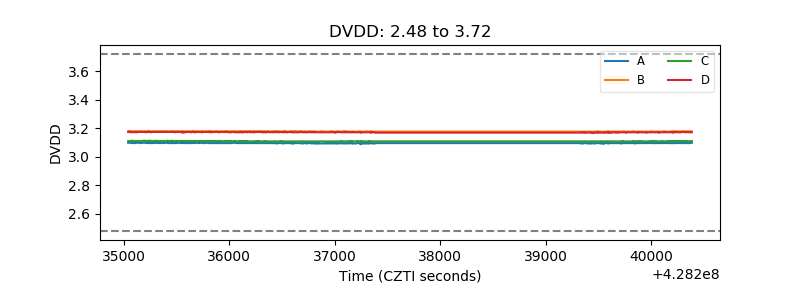 |
| Temperature 1 | 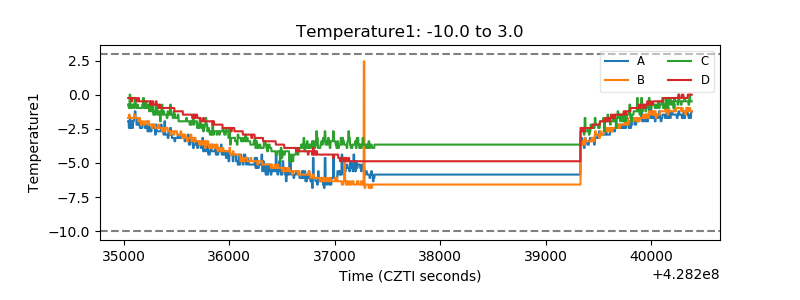 |
| Veto HV Monitor | 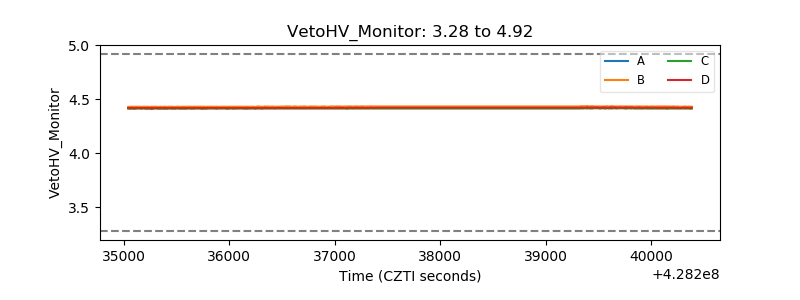 |
| Veto LLD | 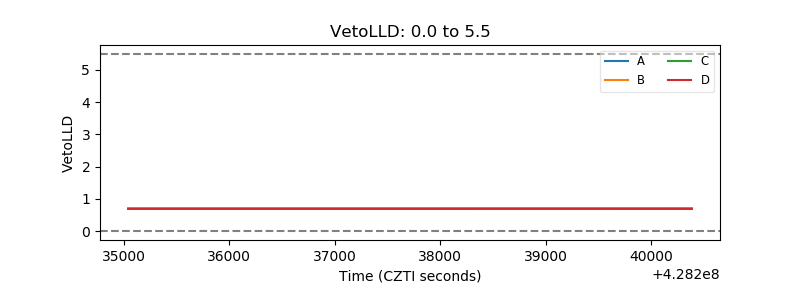 |
| Alpha Counter | 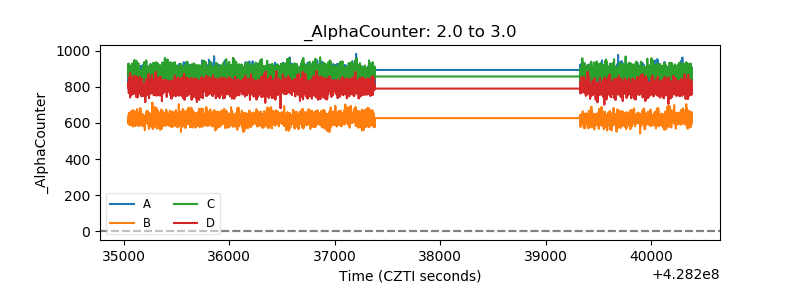 |
| _CPM_Rate | 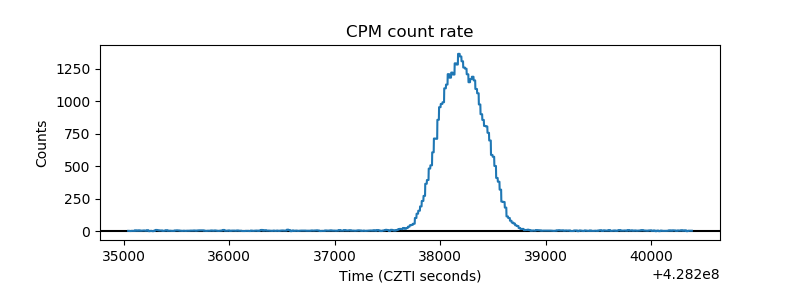 |
| CZT Counter | 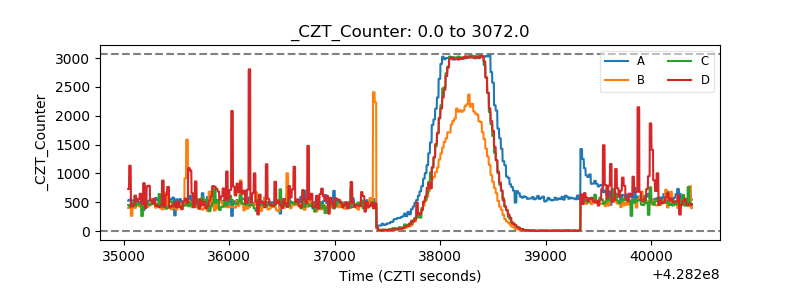 |
| +2.5 Volts monitor | 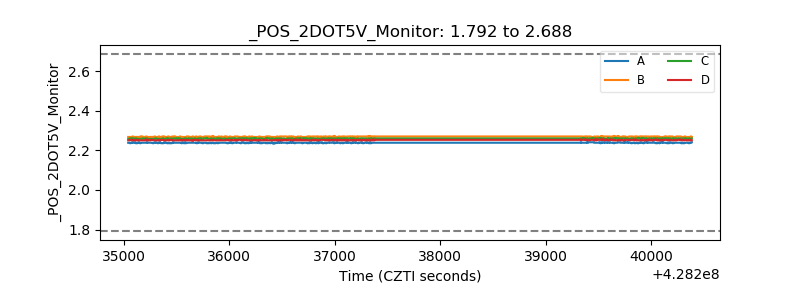 |
| +5 Volts monitor | 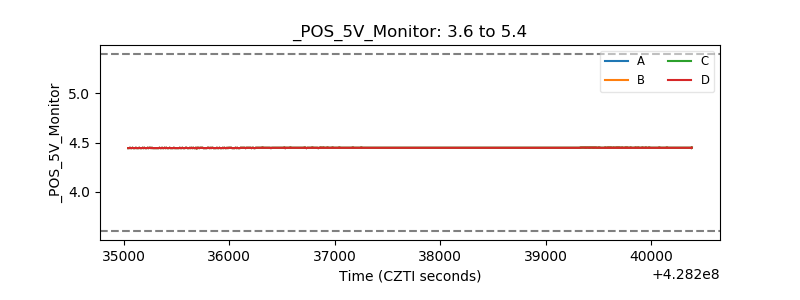 |
| _ROLL_ROT | 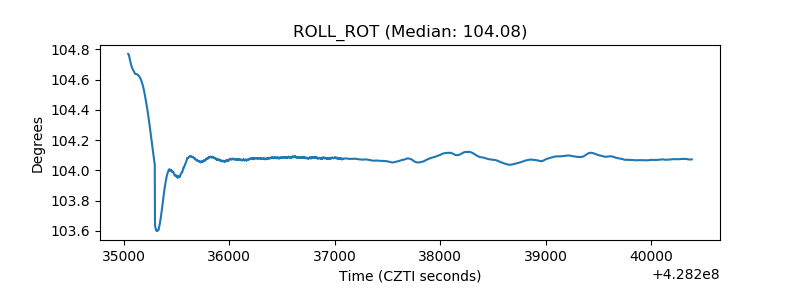 |
| _Roll_DEC | 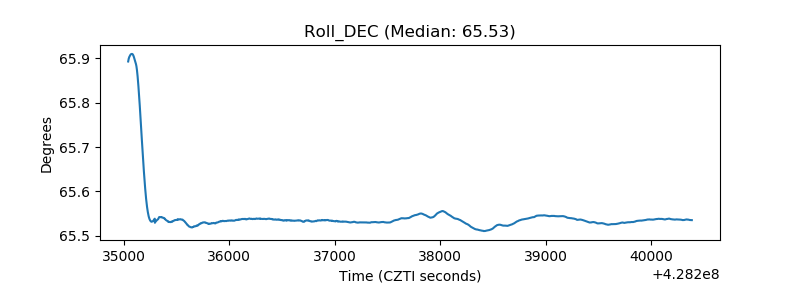 |
| _Roll_RA | 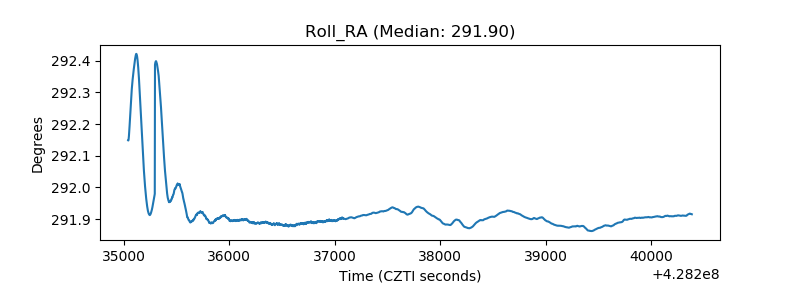 |
| Veto Counter | 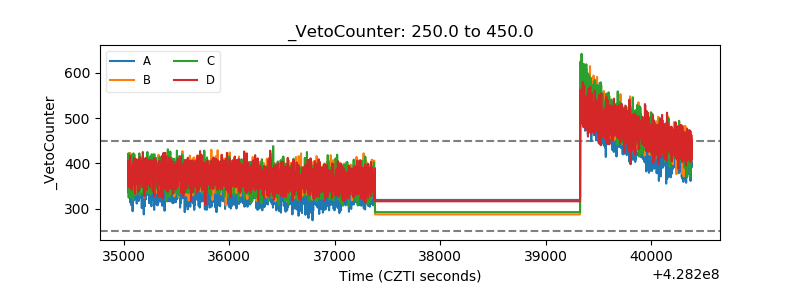 |