| Param | Original file | Final file |
|---|---|---|
| Filename | modeM0/AS1A12_102T01_9000005798_42343cztM0_level2.fits | modeM0/AS1A12_102T01_9000005798_42343cztM0_level2_quad_clean.evt |
| Size (bytes) | 335,450,880 | 95,938,560 |
| Size | 319.9 MB | 91.5 MB |
| Events in quadrant A | 3,061,851 | 665,524 |
| Events in quadrant B | 2,601,840 | 669,666 |
| Events in quadrant C | 2,559,998 | 636,406 |
| Events in quadrant D | 3,784,903 | 566,312 |
| Mode M9 | |||
|---|---|---|---|
| Quadrant | BADHDUFLAG | Total packets | Discarded packets |
| A | 0 | 29 | 0 |
| B | 0 | 30 | 0 |
| C | 0 | 30 | 0 |
| D | 0 | 30 | 0 |
| Mode SS | |||
|---|---|---|---|
| Quadrant | BADHDUFLAG | Total packets | Discarded packets |
| A | 0 | 106 | 0 |
| B | 0 | 106 | 0 |
| C | 0 | 106 | 0 |
| D | 0 | 106 | 0 |
| Mode M0 | |||
|---|---|---|---|
| Quadrant | BADHDUFLAG | Total packets | Discarded packets |
| A | 0 | 12322 | 2 |
| B | 0 | 11087 | 3 |
| C | 0 | 10639 | 2 |
| D | 0 | 14673 | 2 |
| Quadrant | Total seconds | Saturated seconds | Saturation percentage |
|---|---|---|---|
| A | 5248 | 23 | 0.438262% |
| B | 5247 | 38 | 0.724223% |
| C | 5247 | 4 | 0.076234% |
| D | 5247 | 291 | 5.546026% |
Noise dominated data is calculated using 1-second bins in cleaned event files. If a bin has >2000 counts, and if more than 50% of those come from <1% of pixels, then it is considered to be noise-dominated and hence unusable.
| Quadrant | # 1 sec bins | Bins with >0 counts | Bins with >2000 counts | High rate bins dominated by noise | Noise dominated (total time) | Noise dominated (detector-on time) | Marked lightcurve |
|---|---|---|---|---|---|---|---|
| A | 7252 | 5249 | 6 | 6 | 0.08% | 0.11% | 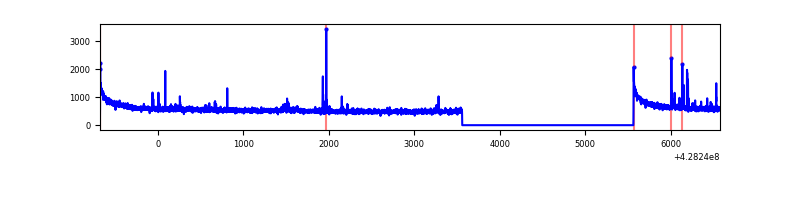 |
| B | 7251 | 5248 | 21 | 21 | 0.29% | 0.40% | 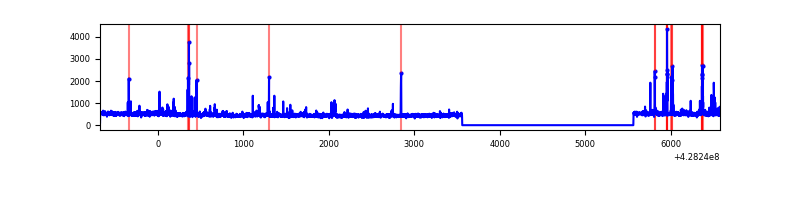 |
| C | 7251 | 5248 | 1 | 1 | 0.01% | 0.02% | 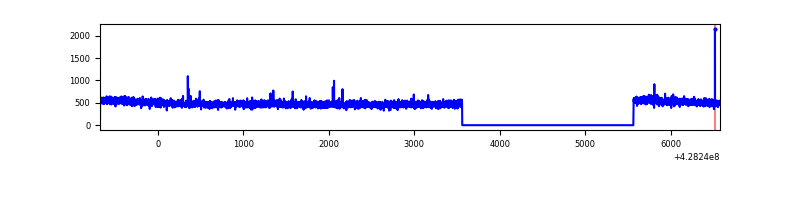 |
| D | 7251 | 5248 | 273 | 273 | 3.76% | 5.20% | 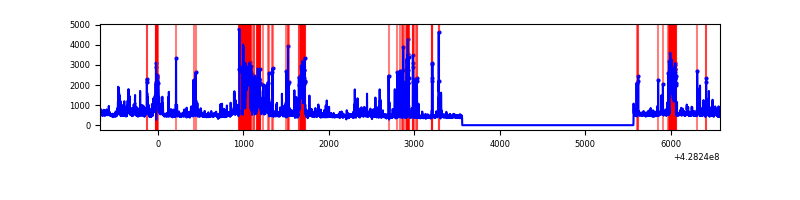 |
Top three noisy pixels from each quadrant. If the there are fewer than three noisy pixels in the level2.evt file, extra rows are filled as -1
| Pixel properties | Quadrant properties | ||||||
|---|---|---|---|---|---|---|---|
| Quadrant | DetID | PixID | Counts | Sigma | Mean | Median | Sigma |
| A | 10 | 83 | 590608 | 4731.44 | 615 | 603 | 124.7 |
| A | 13 | 248 | 49393 | 391.26 | 615 | 603 | 124.7 |
| A | 15 | 223 | 14314 | 109.95 | 615 | 603 | 124.7 |
| B | 5 | 172 | 88114 | 776.0 | 603 | 589 | 112.8 |
| B | 5 | 255 | 42063 | 367.71 | 603 | 589 | 112.8 |
| B | 0 | 230 | 36214 | 315.85 | 603 | 589 | 112.8 |
| C | 15 | 214 | 221092 | 1591.34 | 597 | 602 | 138.6 |
| C | 15 | 111 | 6461 | 42.29 | 597 | 602 | 138.6 |
| C | 7 | 247 | 4216 | 26.08 | 597 | 602 | 138.6 |
| D | 5 | 222 | 414361 | 2906.33 | 586 | 572 | 142.4 |
| D | 15 | 0 | 291460 | 2043.11 | 586 | 572 | 142.4 |
| D | 12 | 233 | 170776 | 1195.46 | 586 | 572 | 142.4 |
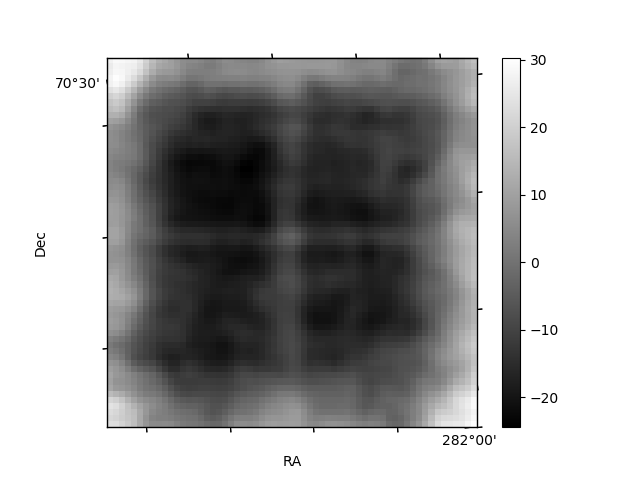
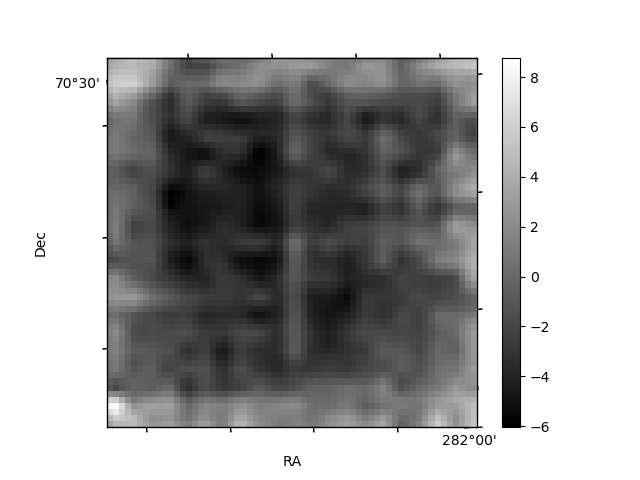
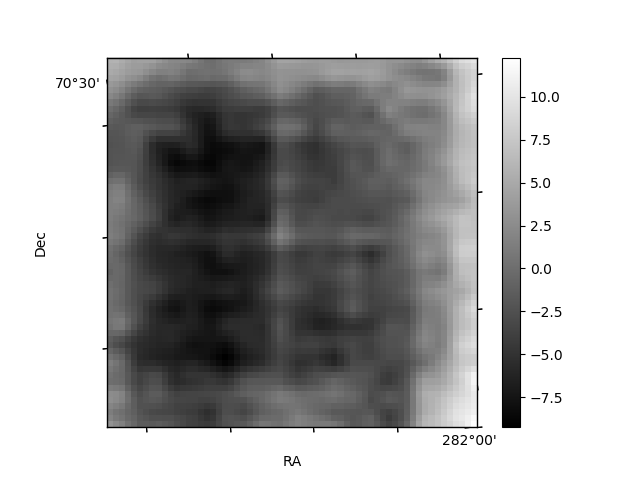
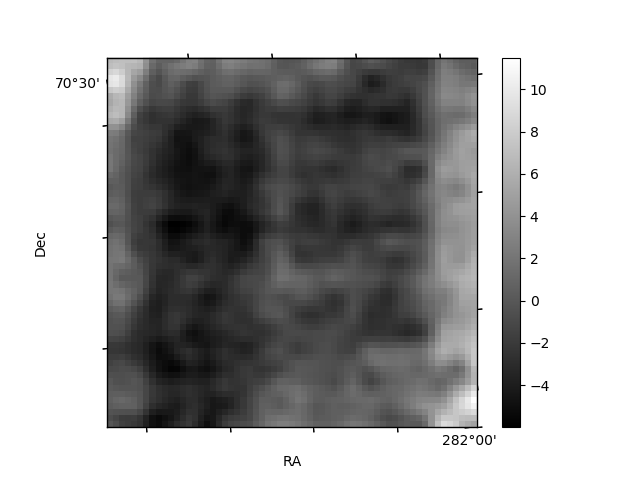
Histogram calculated using DETX and DETY for each event in the final _common_clean file
| Quadrant A | 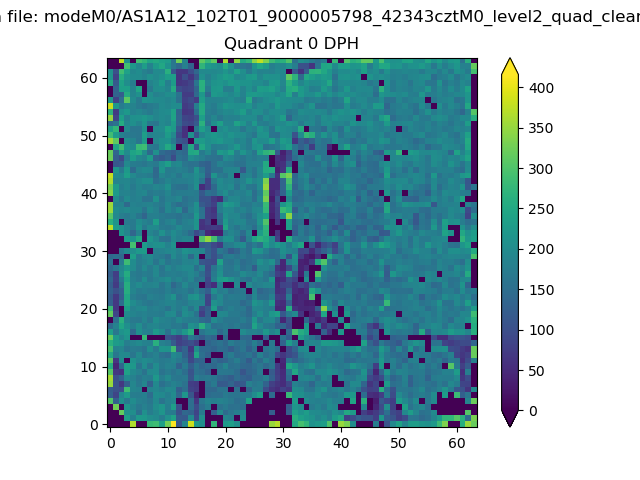 |
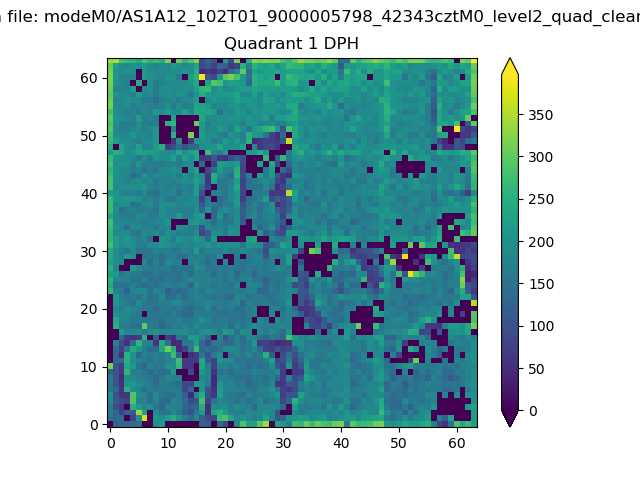 |
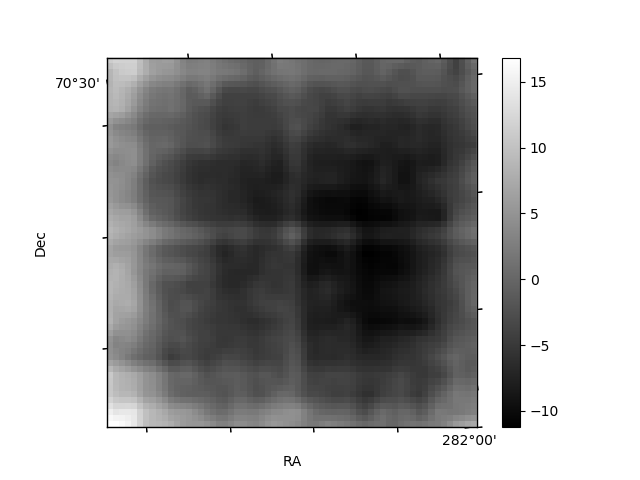
Quadrant B |
|---|---|---|---|
| Quadrant D | 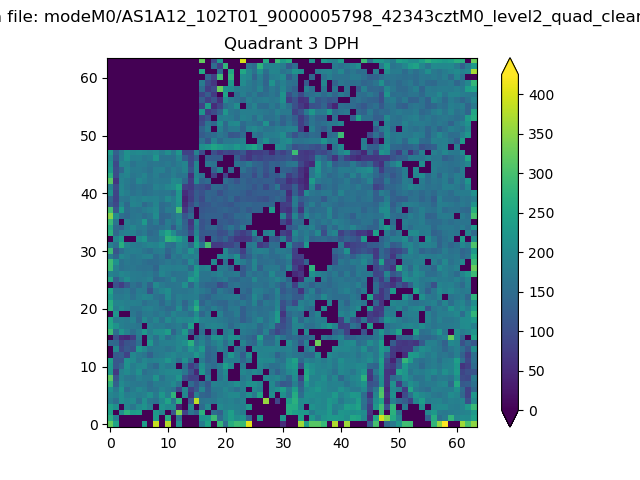 |
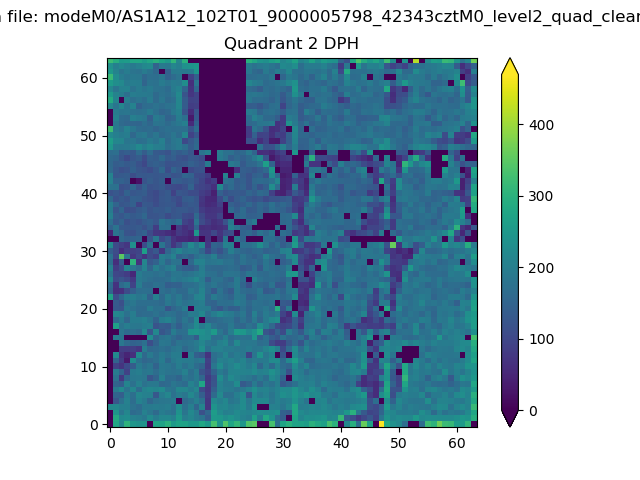 |
Quadrant C |
| Plot type | Count rate plots | Images |
|---|---|---|
| Comparison with Poisson distribution Blue bars denote a histogram of data divided into 1 sec bins. Red curve is a Poisson curve with rate = median count rate of data. |
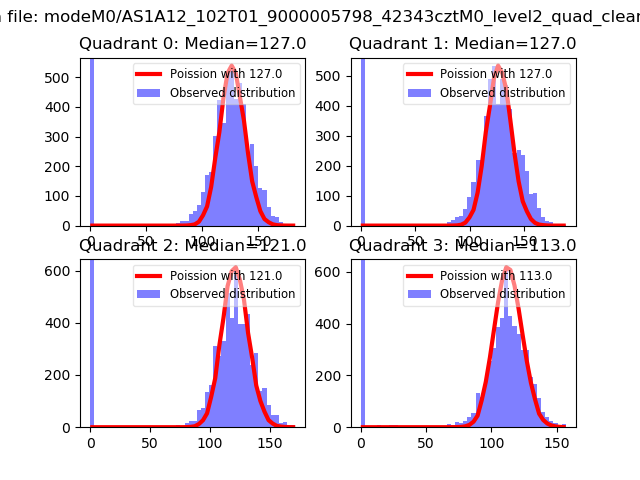 |
 |
| Quadrant-wise count rates Data is divided into 100 sec bins |
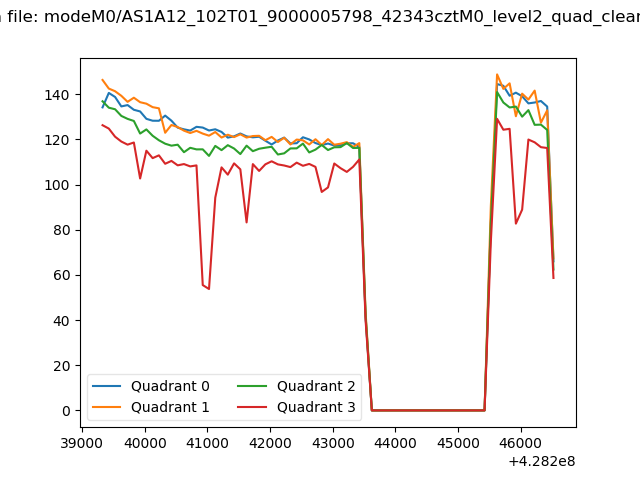 |
|
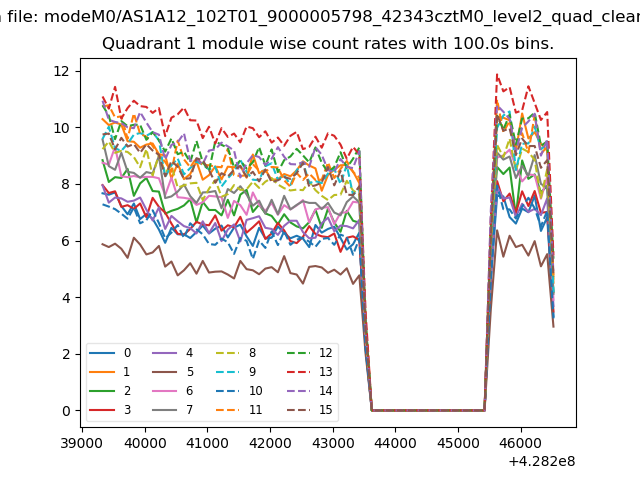
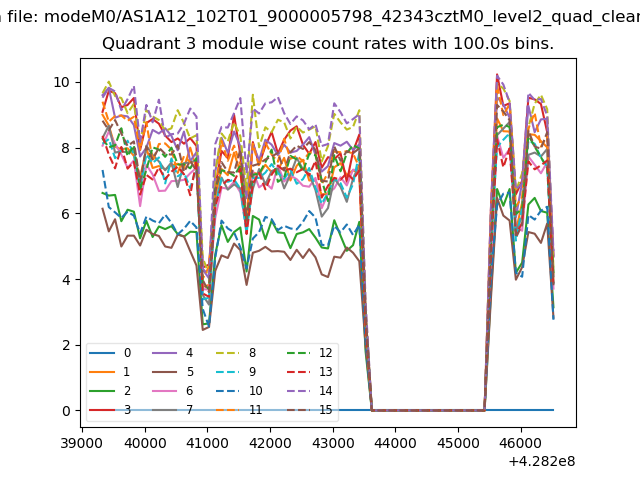
| Module-wise count rates for Quadrant A Data is divided into 100 sec bins |
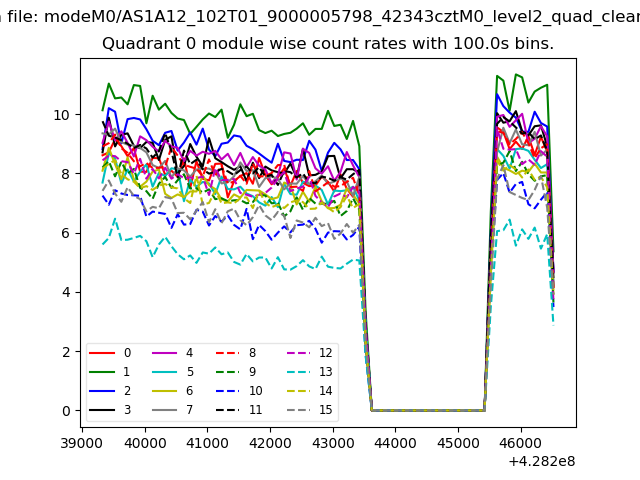 |
 |
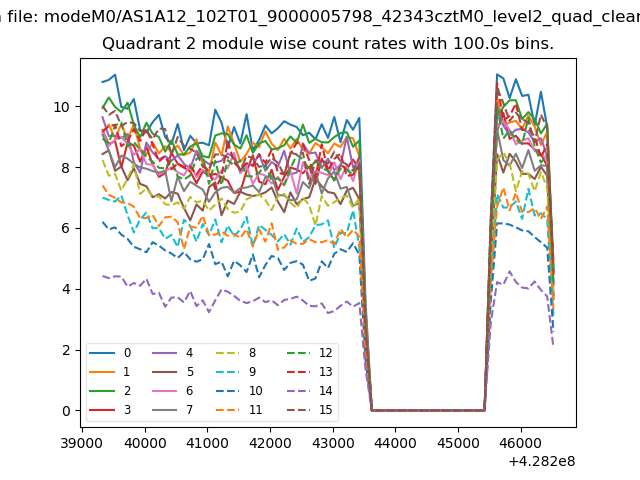
| Module-wise count rates for Quadrant B Data is divided into 100 sec bins |
 |
 |
| Module-wise count rates for Quadrant C Data is divided into 100 sec bins |
 |
 |
| Module-wise count rates for Quadrant D Data is divided into 100 sec bins |
 |
 |
| Parameter | Plot |
|---|---|
| CZT HV Monitor | 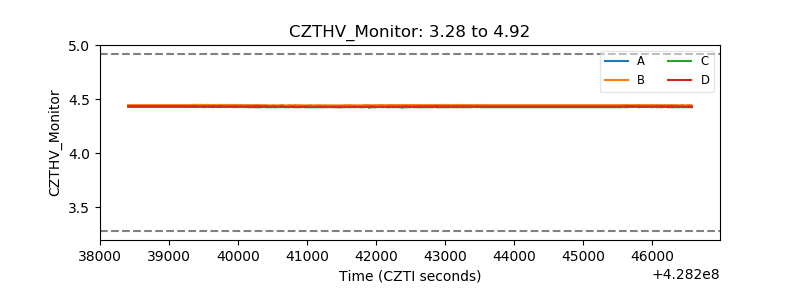 |
| D_VDD | 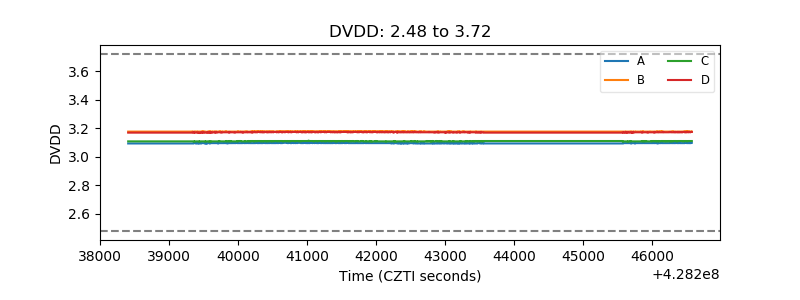 |
| Temperature 1 | 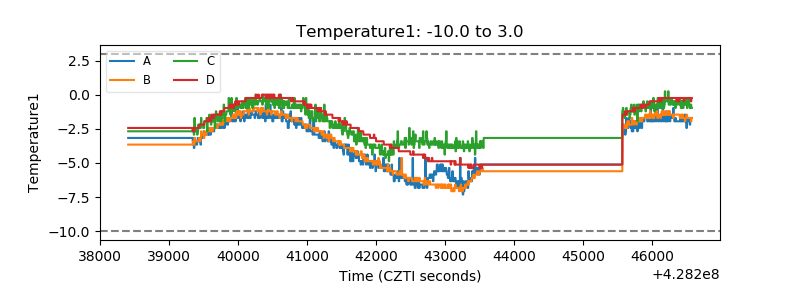 |
| Veto HV Monitor | 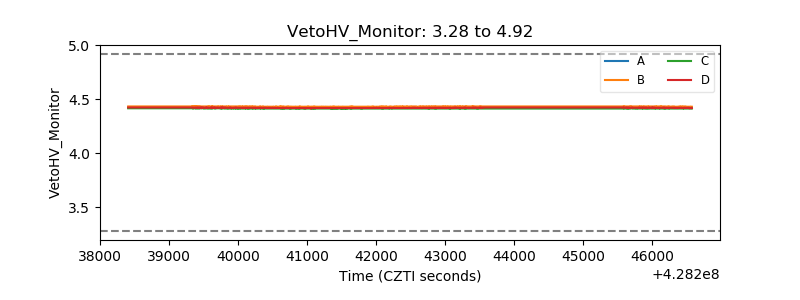 |
| Veto LLD |  |
| Alpha Counter | 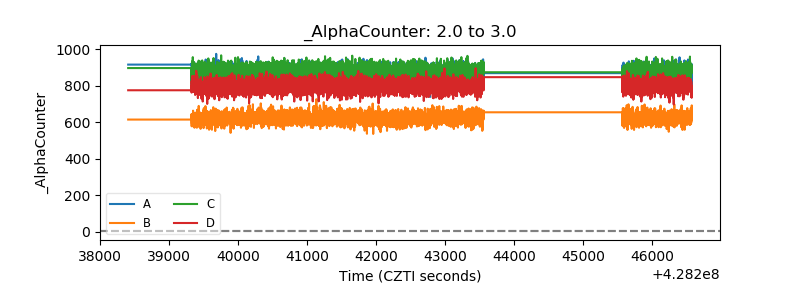 |
| _CPM_Rate | 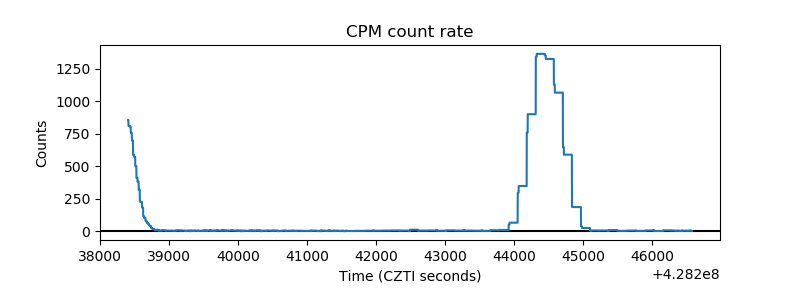 |
| CZT Counter | 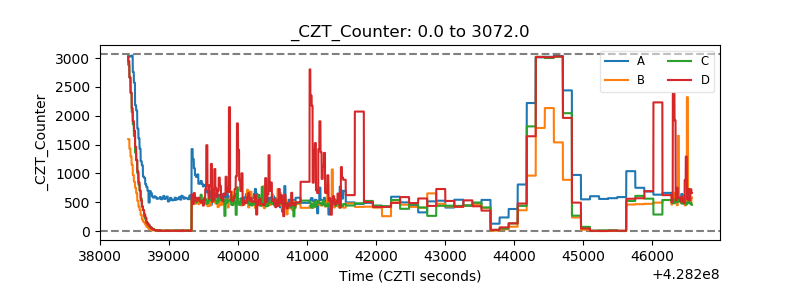 |
| +2.5 Volts monitor | 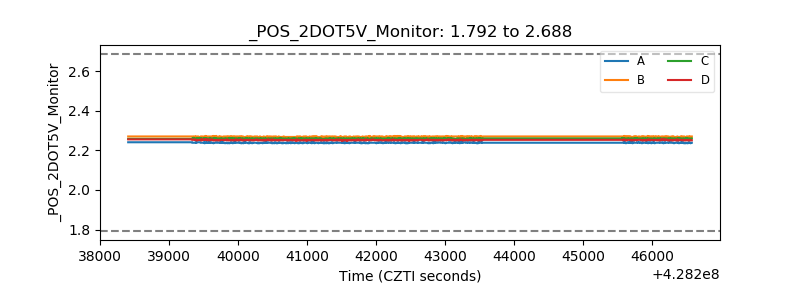 |
| +5 Volts monitor | 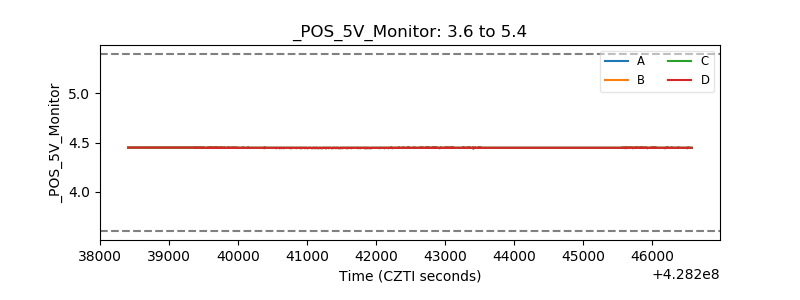 |
| _ROLL_ROT | 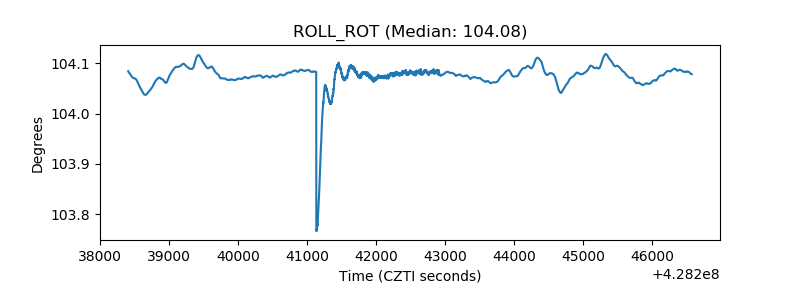 |
| _Roll_DEC | 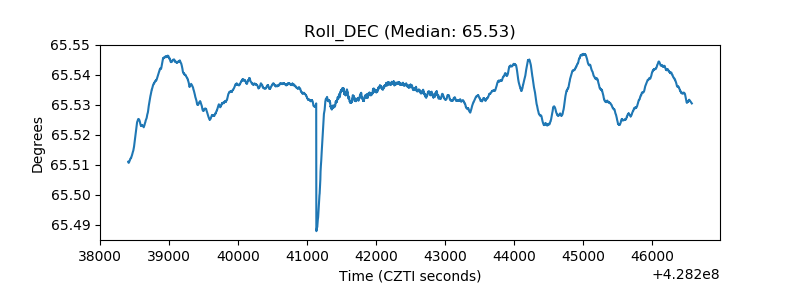 |
| _Roll_RA | 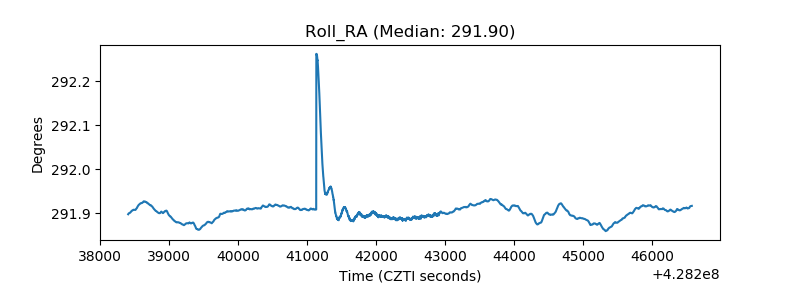 |
| Veto Counter | 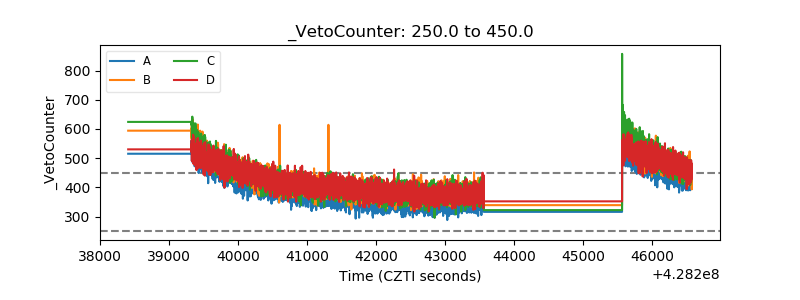 |