| Param | Original file | Final file |
|---|---|---|
| Filename | modeM0/AS1A12_102T01_9000005798_42344cztM0_level2.fits | modeM0/AS1A12_102T01_9000005798_42344cztM0_level2_quad_clean.evt |
| Size (bytes) | 332,821,440 | 95,800,320 |
| Size | 317.4 MB | 91.4 MB |
| Events in quadrant A | 3,032,940 | 663,519 |
| Events in quadrant B | 2,753,851 | 662,467 |
| Events in quadrant C | 2,545,380 | 639,264 |
| Events in quadrant D | 3,582,241 | 571,257 |
| Mode M9 | |||
|---|---|---|---|
| Quadrant | BADHDUFLAG | Total packets | Discarded packets |
| A | 0 | 21 | 0 |
| B | 0 | 21 | 0 |
| C | 0 | 22 | 0 |
| D | 0 | 22 | 0 |
| Mode SS | |||
|---|---|---|---|
| Quadrant | BADHDUFLAG | Total packets | Discarded packets |
| A | 0 | 106 | 0 |
| B | 0 | 106 | 0 |
| C | 0 | 106 | 0 |
| D | 0 | 106 | 0 |
| Mode M0 | |||
|---|---|---|---|
| Quadrant | BADHDUFLAG | Total packets | Discarded packets |
| A | 0 | 12270 | 2 |
| B | 0 | 11511 | 2 |
| C | 0 | 10581 | 2 |
| D | 0 | 14164 | 4 |
| Quadrant | Total seconds | Saturated seconds | Saturation percentage |
|---|---|---|---|
| A | 5207 | 26 | 0.499328% |
| B | 5207 | 70 | 1.344344% |
| C | 5207 | 2 | 0.038410% |
| D | 5206 | 263 | 5.051863% |
Noise dominated data is calculated using 1-second bins in cleaned event files. If a bin has >2000 counts, and if more than 50% of those come from <1% of pixels, then it is considered to be noise-dominated and hence unusable.
| Quadrant | # 1 sec bins | Bins with >0 counts | Bins with >2000 counts | High rate bins dominated by noise | Noise dominated (total time) | Noise dominated (detector-on time) | Marked lightcurve |
|---|---|---|---|---|---|---|---|
| A | 7300 | 5208 | 10 | 10 | 0.14% | 0.19% | 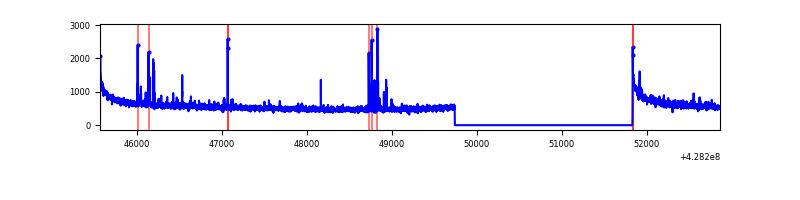 |
| B | 7300 | 5208 | 42 | 42 | 0.58% | 0.81% | 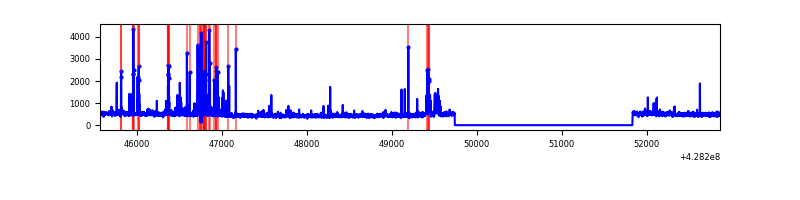 |
| C | 7300 | 5208 | 1 | 1 | 0.01% | 0.02% | 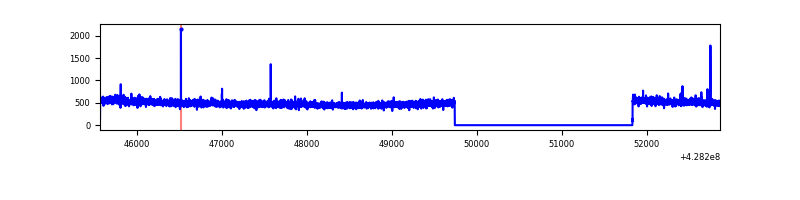 |
| D | 7299 | 5207 | 224 | 224 | 3.07% | 4.30% | 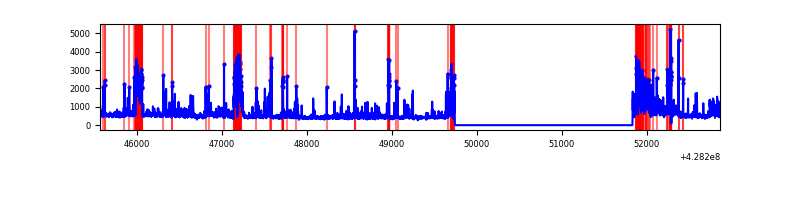 |
Top three noisy pixels from each quadrant. If the there are fewer than three noisy pixels in the level2.evt file, extra rows are filled as -1
| Pixel properties | Quadrant properties | ||||||
|---|---|---|---|---|---|---|---|
| Quadrant | DetID | PixID | Counts | Sigma | Mean | Median | Sigma |
| A | 10 | 83 | 586380 | 4774.0 | 605 | 595 | 122.7 |
| A | 13 | 248 | 60815 | 490.78 | 605 | 595 | 122.7 |
| A | 2 | 79 | 29102 | 232.32 | 605 | 595 | 122.7 |
| B | 4 | 81 | 208151 | 1861.16 | 593 | 579 | 111.5 |
| B | 5 | 172 | 82847 | 737.64 | 593 | 579 | 111.5 |
| B | 0 | 230 | 38335 | 338.53 | 593 | 579 | 111.5 |
| C | 15 | 214 | 220104 | 1617.99 | 592 | 598 | 135.7 |
| C | 15 | 111 | 6806 | 45.76 | 592 | 598 | 135.7 |
| C | 12 | 251 | 4694 | 30.19 | 592 | 598 | 135.7 |
| D | 12 | 233 | 448654 | 3198.98 | 583 | 569 | 140.1 |
| D | 5 | 222 | 237701 | 1692.94 | 583 | 569 | 140.1 |
| D | 1 | 52 | 206042 | 1466.92 | 583 | 569 | 140.1 |
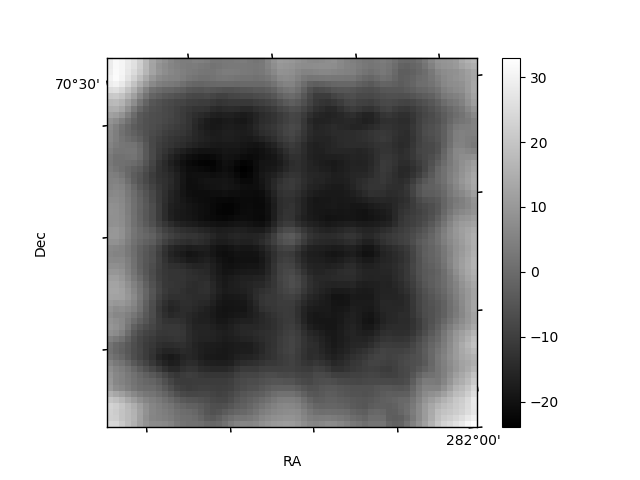
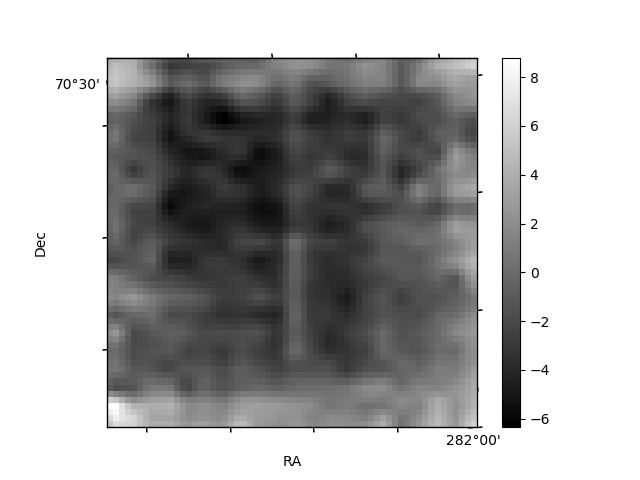
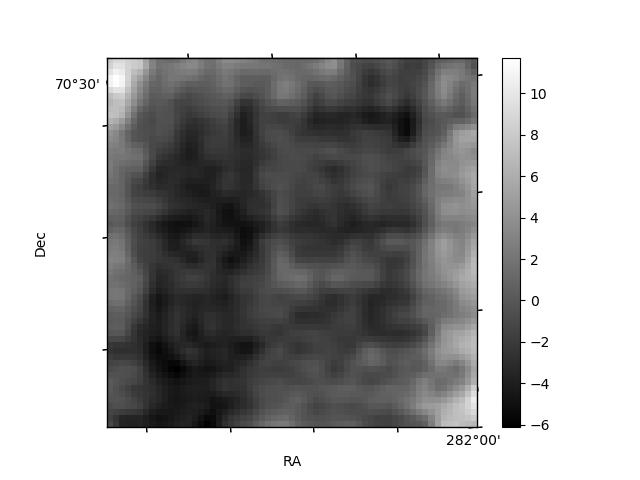
Histogram calculated using DETX and DETY for each event in the final _common_clean file
| Quadrant A | 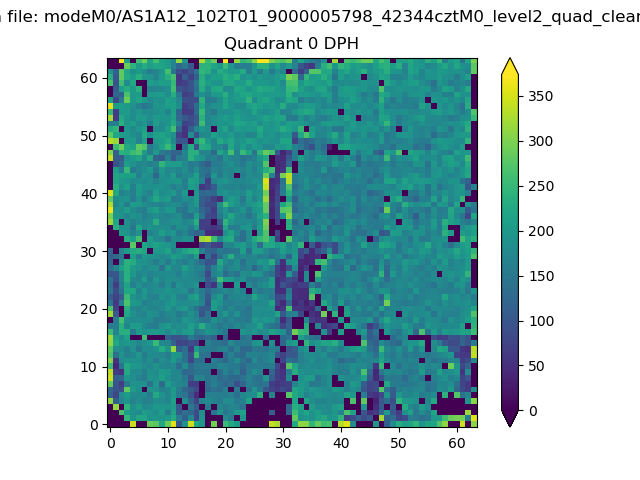 |
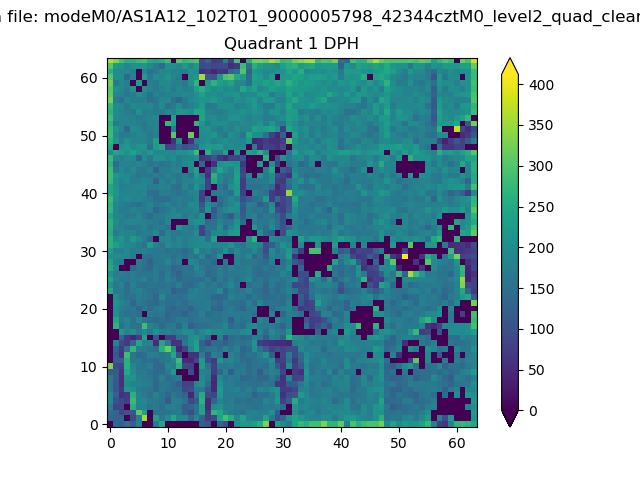 |
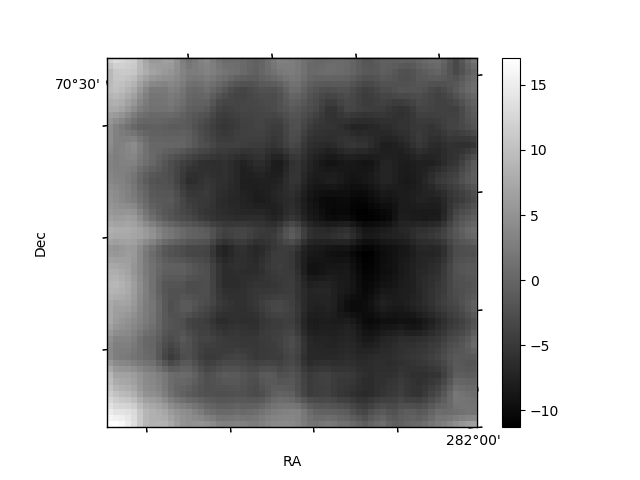
Quadrant B |
|---|---|---|---|
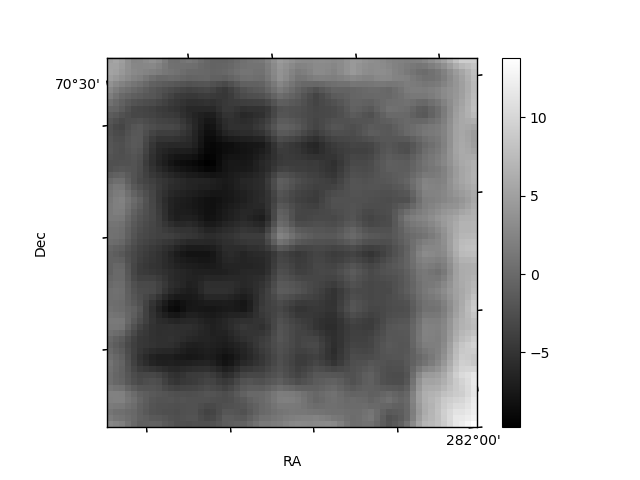
| Quadrant D | 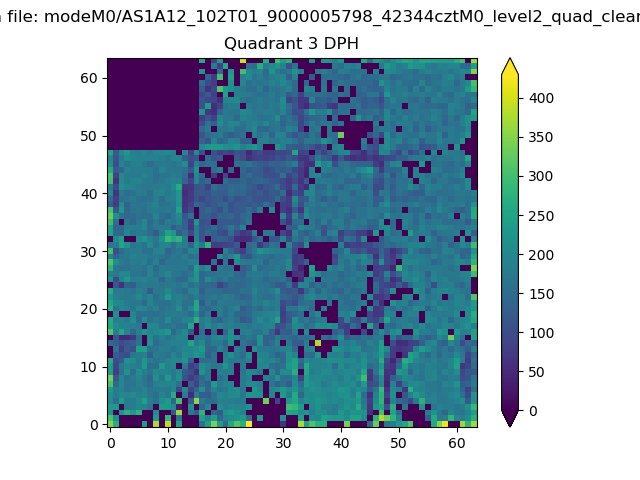 |
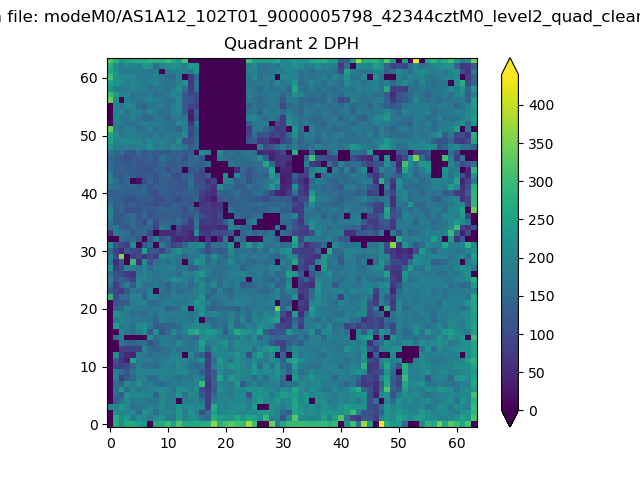 |
Quadrant C |
| Plot type | Count rate plots | Images |
|---|---|---|
| Comparison with Poisson distribution Blue bars denote a histogram of data divided into 1 sec bins. Red curve is a Poisson curve with rate = median count rate of data. |
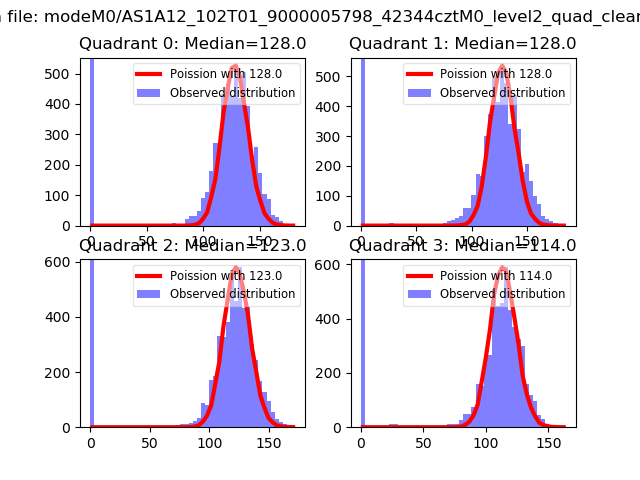 |
 |
| Quadrant-wise count rates Data is divided into 100 sec bins |
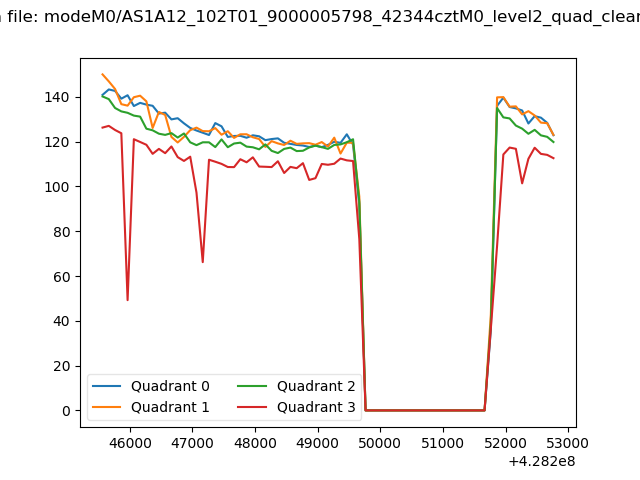 |
|
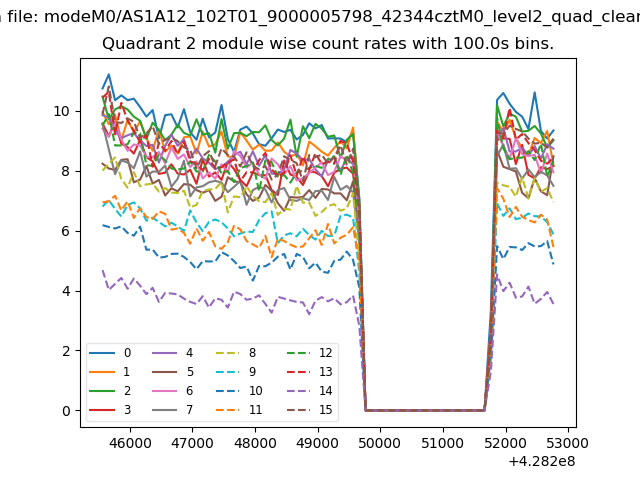
| Module-wise count rates for Quadrant A Data is divided into 100 sec bins |
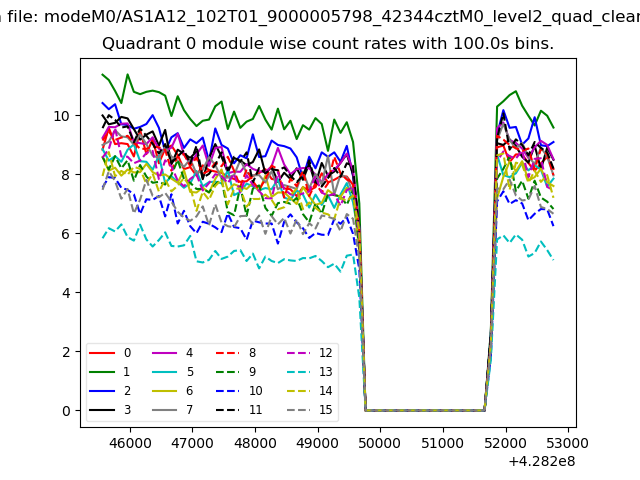 |
 |
| Module-wise count rates for Quadrant B Data is divided into 100 sec bins |
 |
 |
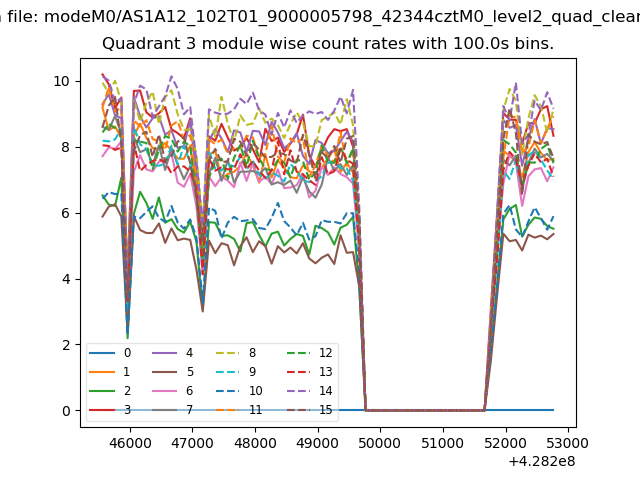
| Module-wise count rates for Quadrant C Data is divided into 100 sec bins |
 |
 |
| Module-wise count rates for Quadrant D Data is divided into 100 sec bins |
 |
 |
| Parameter | Plot |
|---|---|
| CZT HV Monitor | 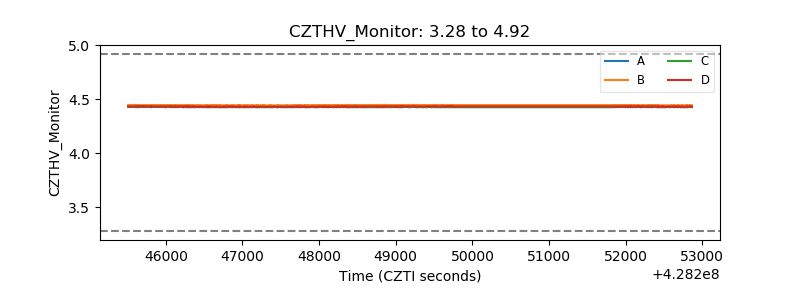 |
| D_VDD | 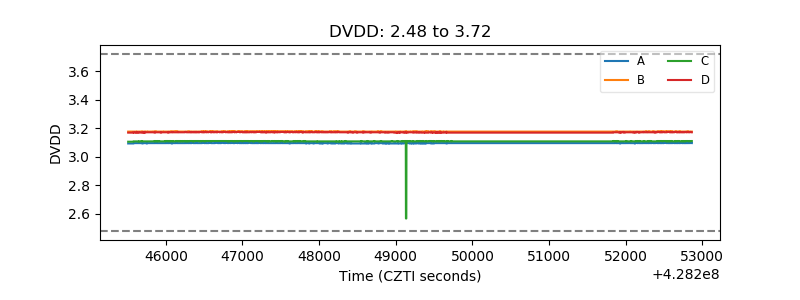 |
| Temperature 1 | 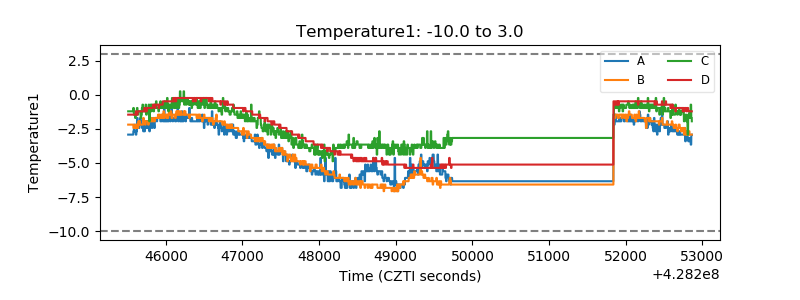 |
| Veto HV Monitor | 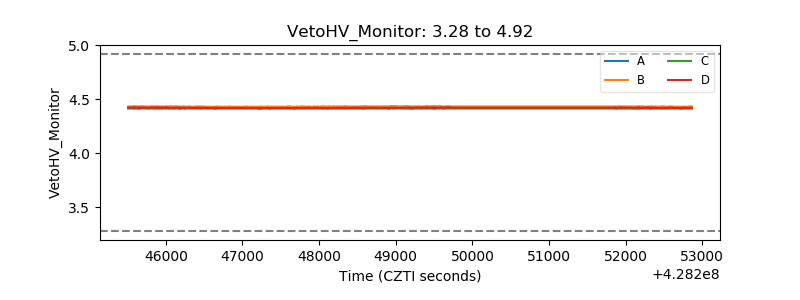 |
| Veto LLD | 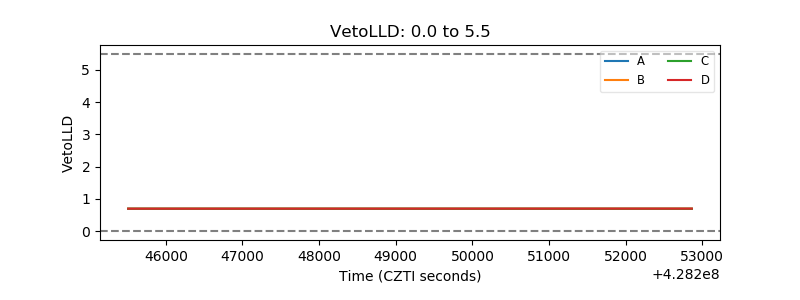 |
| Alpha Counter | 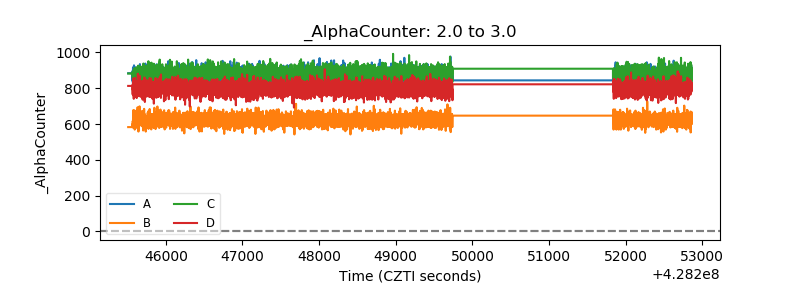 |
| _CPM_Rate | 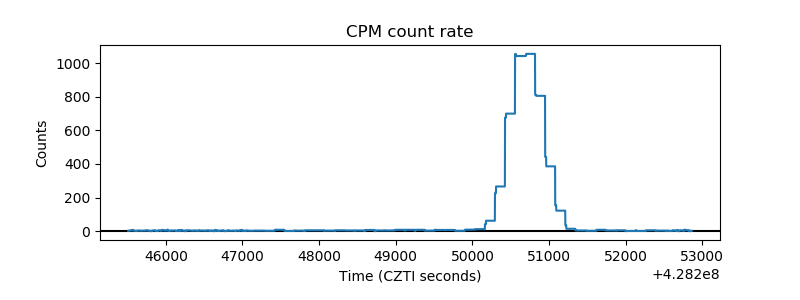 |
| CZT Counter | 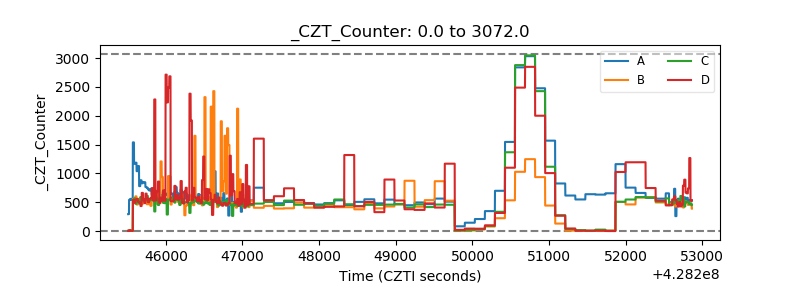 |
| +2.5 Volts monitor | 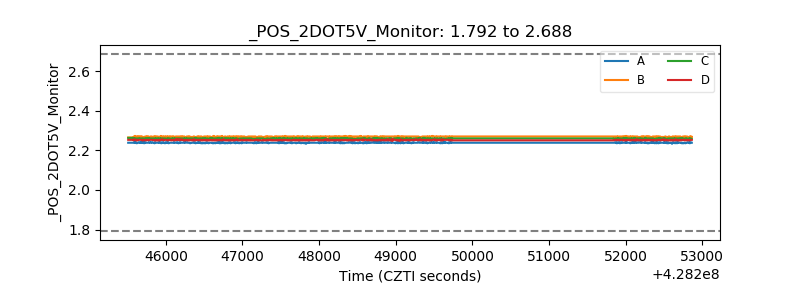 |
| +5 Volts monitor |  |
| _ROLL_ROT | 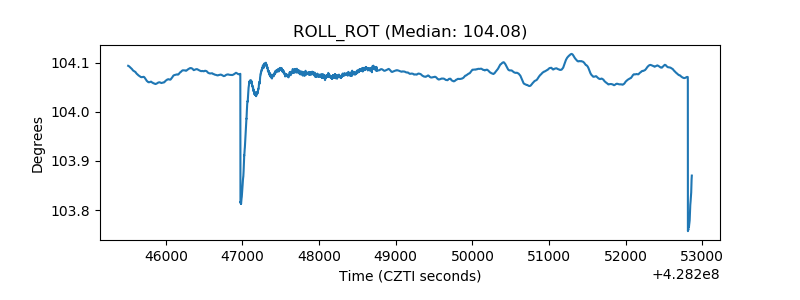 |
| _Roll_DEC | 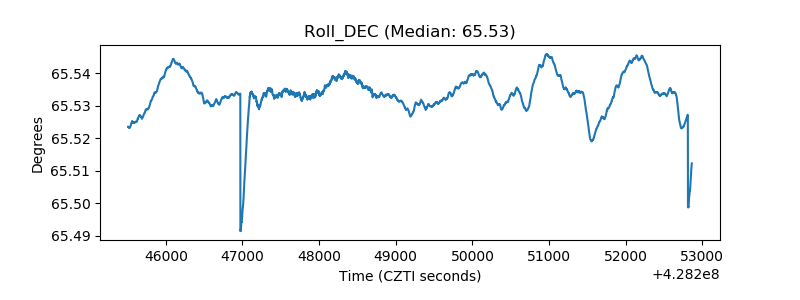 |
| _Roll_RA | 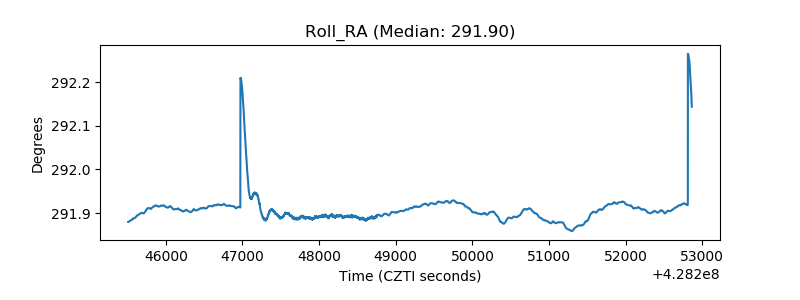 |
| Veto Counter | 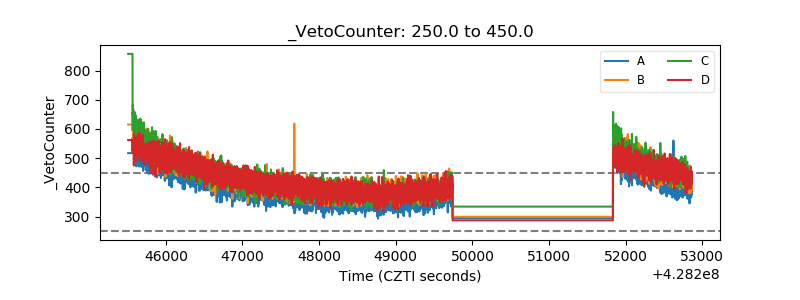 |