| Param | Original file | Final file |
|---|---|---|
| Filename | modeM0/AS1A12_102T01_9000005798_42345cztM0_level2.fits | modeM0/AS1A12_102T01_9000005798_42345cztM0_level2_quad_clean.evt |
| Size (bytes) | 310,605,120 | 88,539,840 |
| Size | 296.2 MB | 84.4 MB |
| Events in quadrant A | 2,747,615 | 605,987 |
| Events in quadrant B | 2,301,555 | 611,494 |
| Events in quadrant C | 2,373,091 | 591,184 |
| Events in quadrant D | 3,687,667 | 523,790 |
| Mode M9 | |||
|---|---|---|---|
| Quadrant | BADHDUFLAG | Total packets | Discarded packets |
| A | 0 | 23 | 0 |
| B | 0 | 23 | 0 |
| C | 0 | 24 | 0 |
| D | 0 | 24 | 0 |
| Mode SS | |||
|---|---|---|---|
| Quadrant | BADHDUFLAG | Total packets | Discarded packets |
| A | 0 | 102 | 0 |
| B | 0 | 102 | 0 |
| C | 0 | 102 | 0 |
| D | 0 | 102 | 0 |
| Mode M0 | |||
|---|---|---|---|
| Quadrant | BADHDUFLAG | Total packets | Discarded packets |
| A | 0 | 11305 | 3 |
| B | 0 | 10213 | 2 |
| C | 0 | 10061 | 2 |
| D | 0 | 14432 | 2 |
| Quadrant | Total seconds | Saturated seconds | Saturation percentage |
|---|---|---|---|
| A | 4971 | 15 | 0.301750% |
| B | 4971 | 15 | 0.301750% |
| C | 4971 | 3 | 0.060350% |
| D | 4971 | 324 | 6.517803% |
Noise dominated data is calculated using 1-second bins in cleaned event files. If a bin has >2000 counts, and if more than 50% of those come from <1% of pixels, then it is considered to be noise-dominated and hence unusable.
| Quadrant | # 1 sec bins | Bins with >0 counts | Bins with >2000 counts | High rate bins dominated by noise | Noise dominated (total time) | Noise dominated (detector-on time) | Marked lightcurve |
|---|---|---|---|---|---|---|---|
| A | 7095 | 4972 | 4 | 4 | 0.06% | 0.08% | 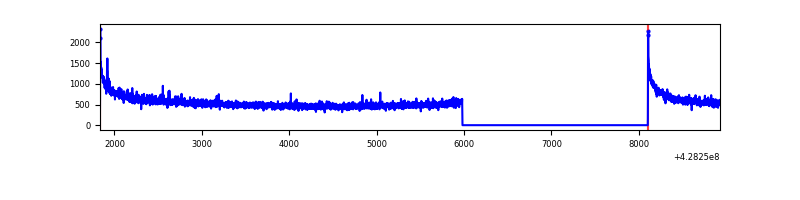 |
| B | 7095 | 4972 | 6 | 6 | 0.08% | 0.12% | 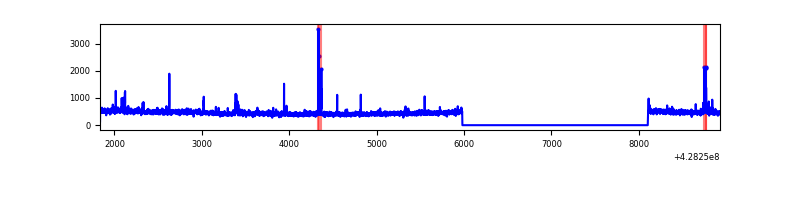 |
| C | 7095 | 4972 | 0 | 0 | 0.00% | 0.00% | 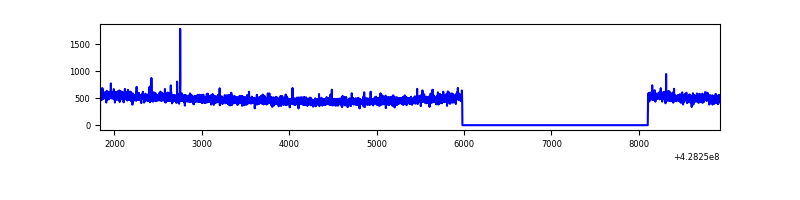 |
| D | 7095 | 4972 | 281 | 281 | 3.96% | 5.65% | 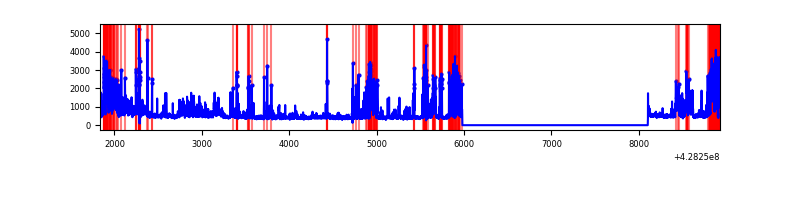 |
Top three noisy pixels from each quadrant. If the there are fewer than three noisy pixels in the level2.evt file, extra rows are filled as -1
| Pixel properties | Quadrant properties | ||||||
|---|---|---|---|---|---|---|---|
| Quadrant | DetID | PixID | Counts | Sigma | Mean | Median | Sigma |
| A | 10 | 83 | 559588 | 4929.65 | 557 | 547 | 113.4 |
| A | 13 | 248 | 15780 | 134.33 | 557 | 547 | 113.4 |
| A | 13 | 6 | 12662 | 106.83 | 557 | 547 | 113.4 |
| B | 0 | 230 | 34790 | 326.17 | 552 | 539 | 105.0 |
| B | 5 | 172 | 32011 | 299.7 | 552 | 539 | 105.0 |
| B | 15 | 85 | 21709 | 201.6 | 552 | 539 | 105.0 |
| C | 15 | 214 | 208528 | 1634.69 | 550 | 553 | 127.2 |
| C | 7 | 247 | 6467 | 46.48 | 550 | 553 | 127.2 |
| C | 15 | 111 | 4213 | 28.77 | 550 | 553 | 127.2 |
| D | 12 | 233 | 670328 | 5154.99 | 537 | 523 | 129.9 |
| D | 12 | 6 | 507114 | 3898.86 | 537 | 523 | 129.9 |
| D | 1 | 52 | 168136 | 1289.99 | 537 | 523 | 129.9 |
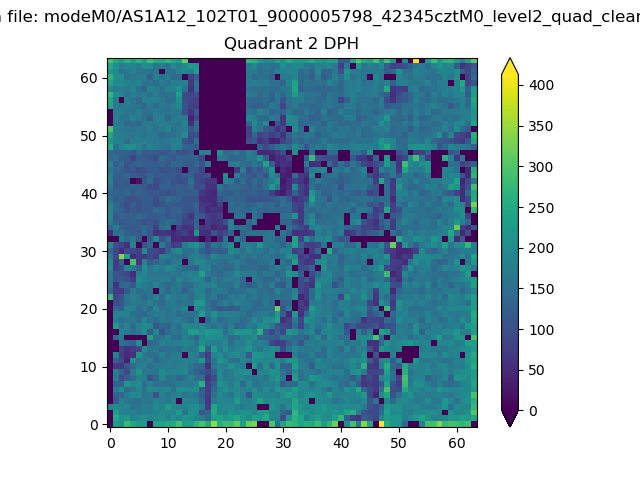
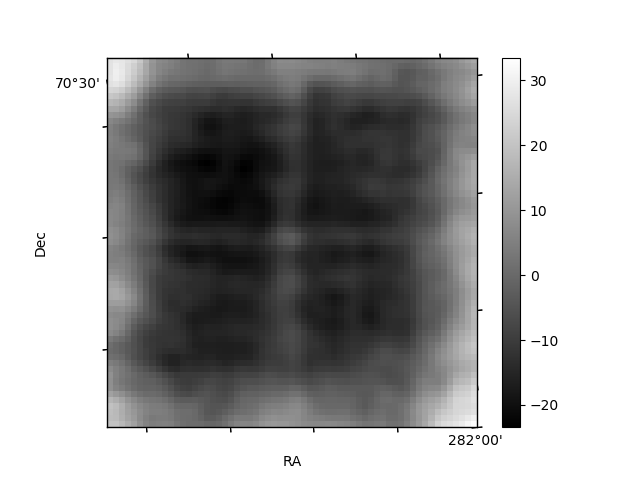
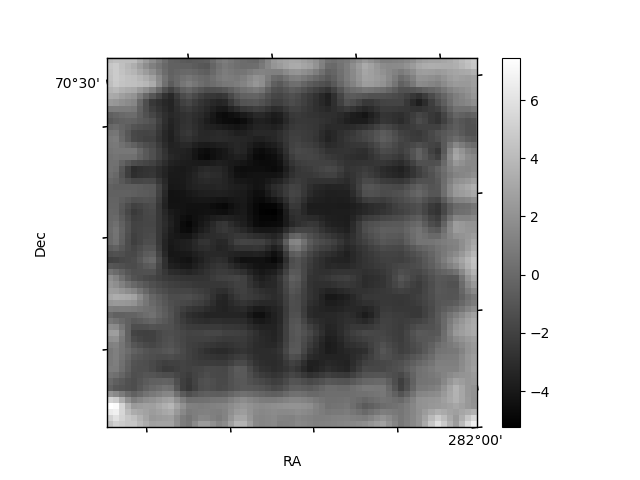
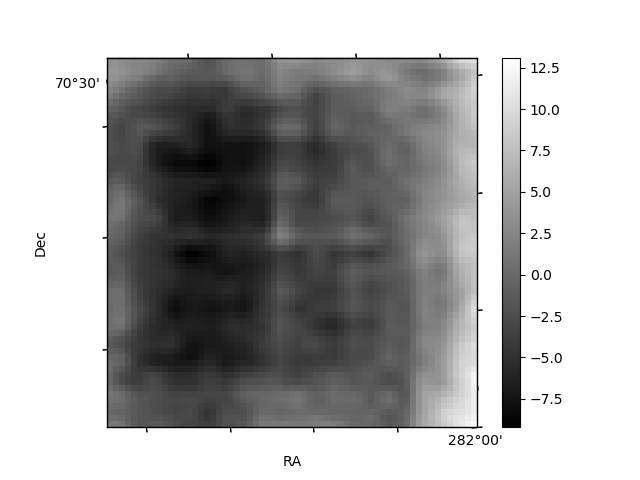
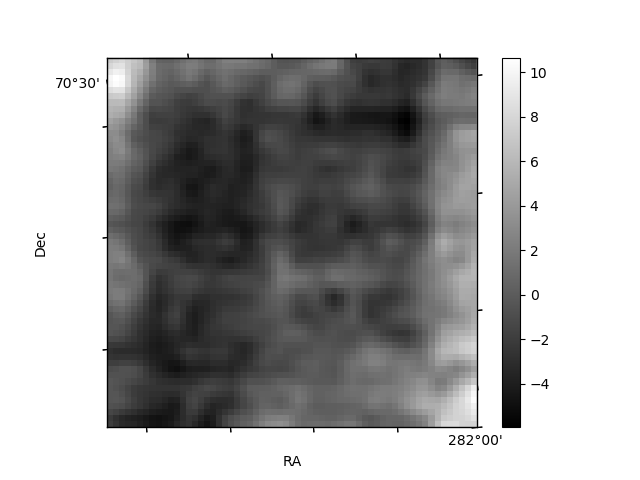
Histogram calculated using DETX and DETY for each event in the final _common_clean file
| Quadrant A | 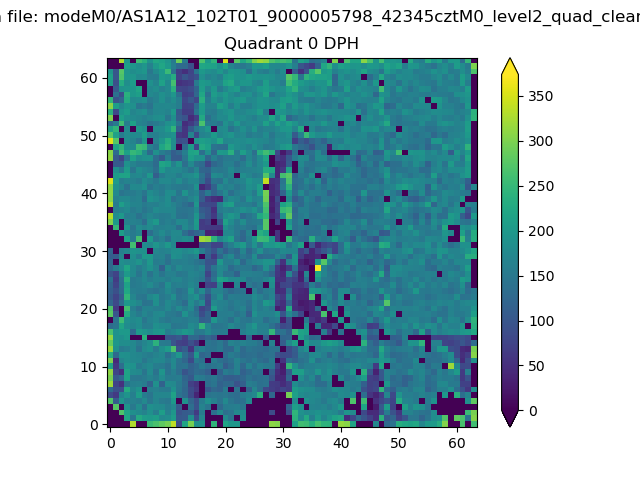 |
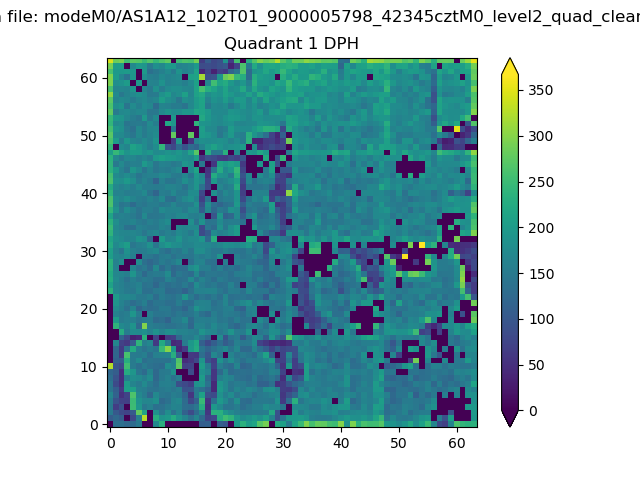 |
Quadrant B |
|---|---|---|---|
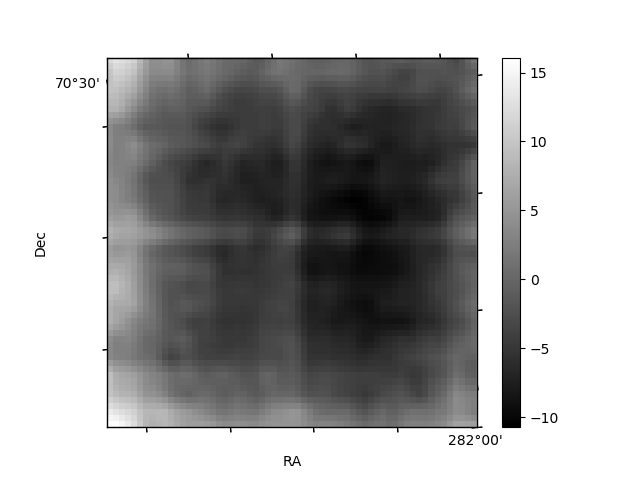
| Quadrant D | 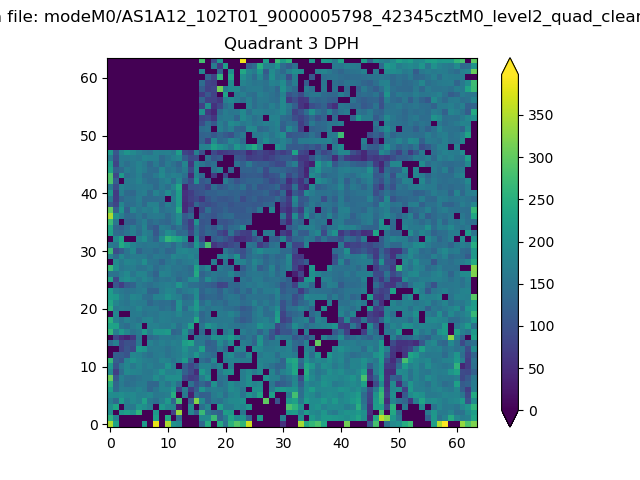 |
 |
Quadrant C |
| Plot type | Count rate plots | Images |
|---|---|---|
| Comparison with Poisson distribution Blue bars denote a histogram of data divided into 1 sec bins. Red curve is a Poisson curve with rate = median count rate of data. |
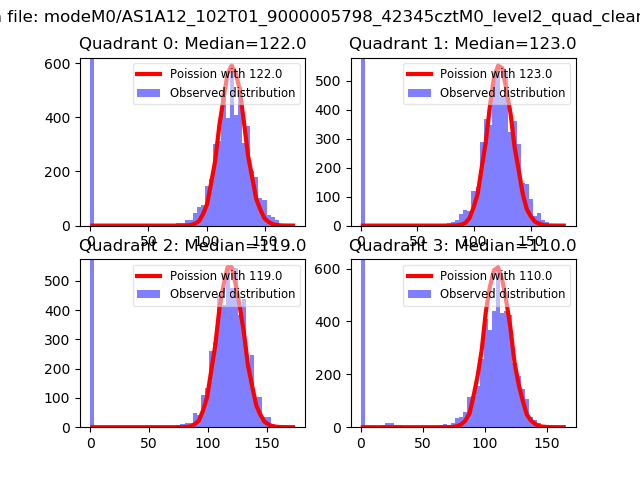 |
 |
| Quadrant-wise count rates Data is divided into 100 sec bins |
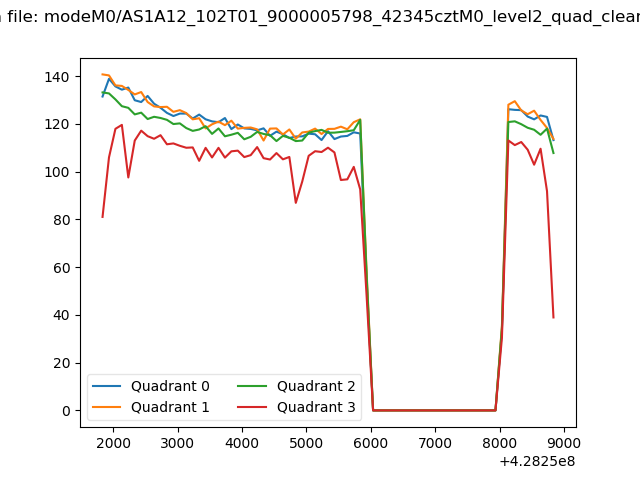 |
|
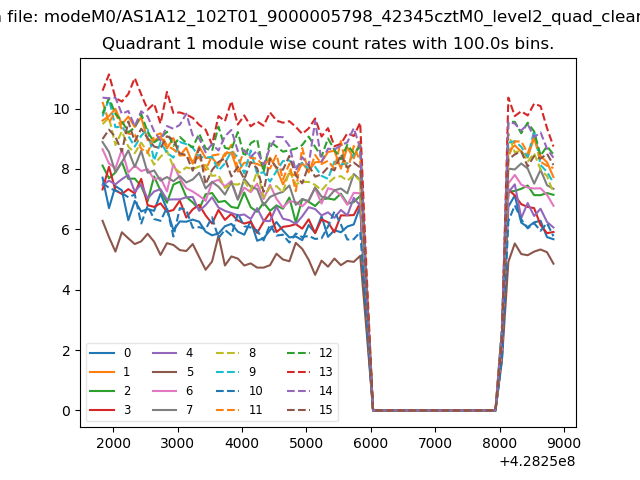
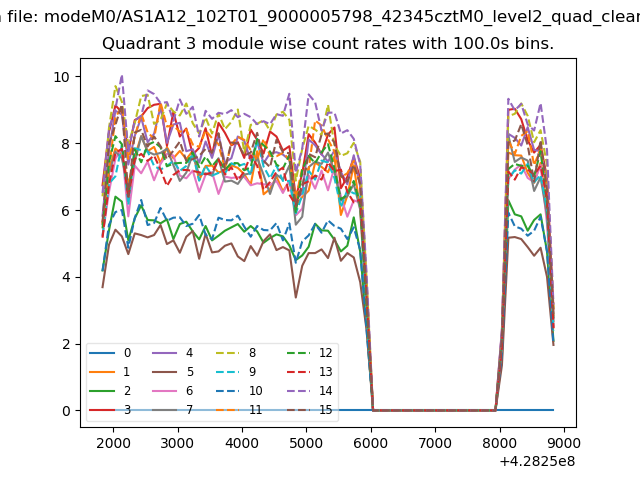
| Module-wise count rates for Quadrant A Data is divided into 100 sec bins |
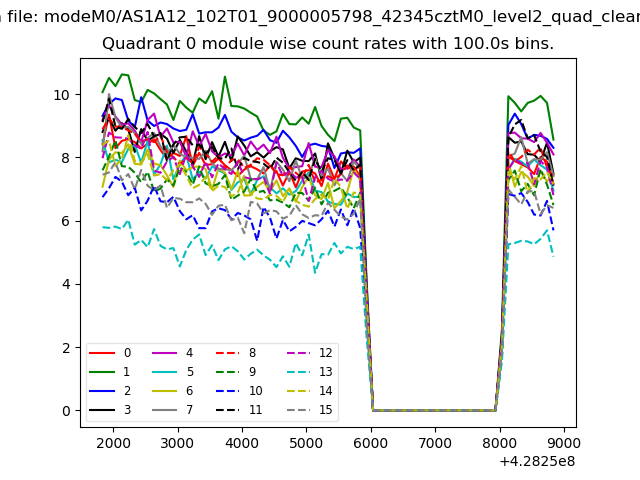 |
 |
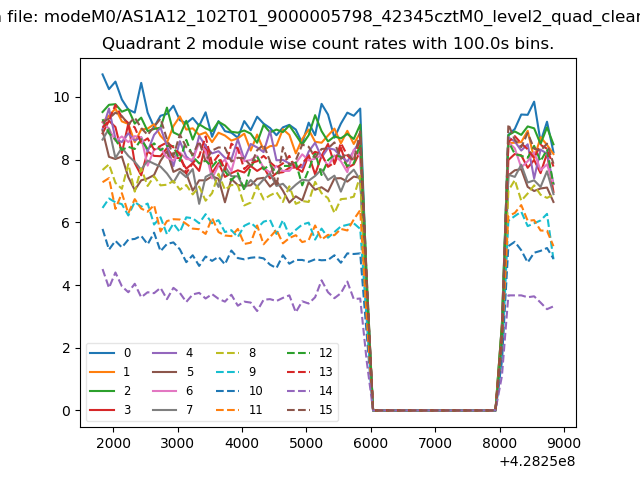
| Module-wise count rates for Quadrant B Data is divided into 100 sec bins |
 |
 |
| Module-wise count rates for Quadrant C Data is divided into 100 sec bins |
 |
 |
| Module-wise count rates for Quadrant D Data is divided into 100 sec bins |
 |
 |
| Parameter | Plot |
|---|---|
| CZT HV Monitor | 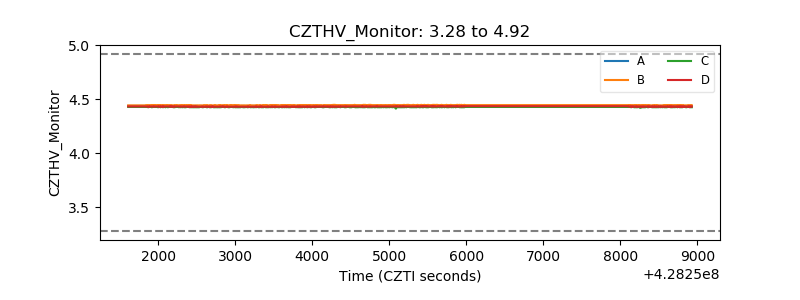 |
| D_VDD | 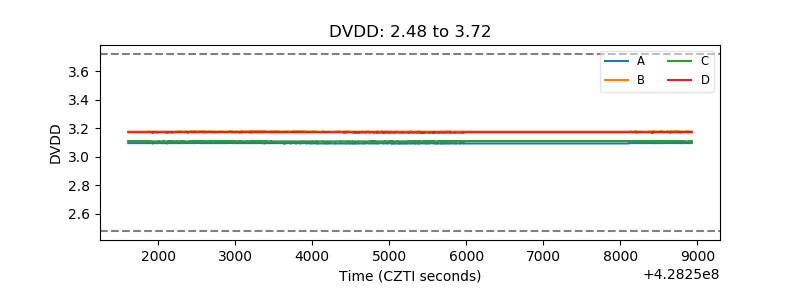 |
| Temperature 1 | 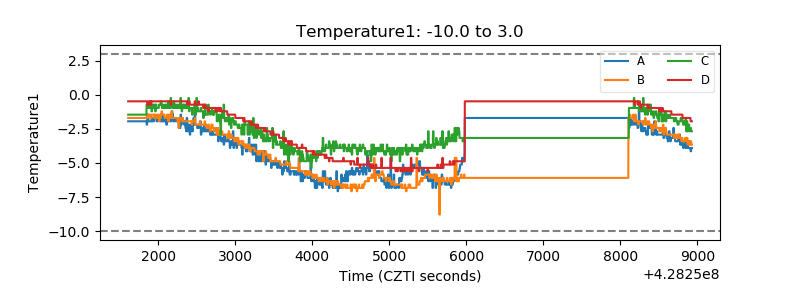 |
| Veto HV Monitor | 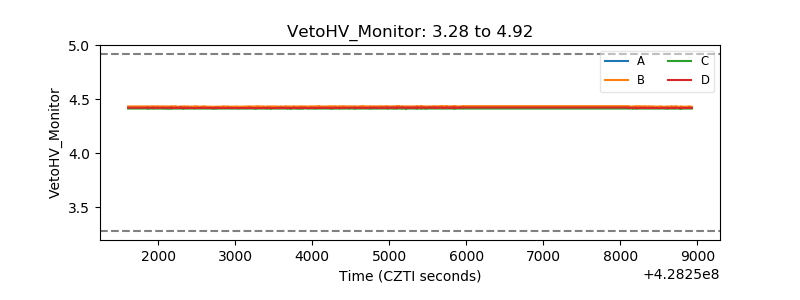 |
| Veto LLD | 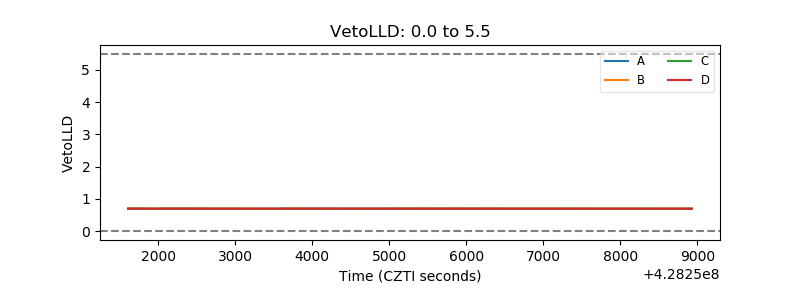 |
| Alpha Counter | 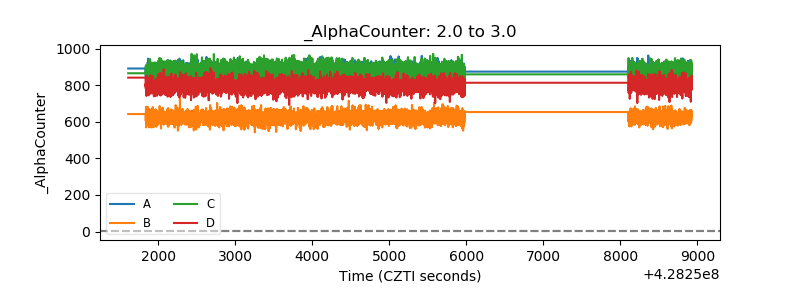 |
| _CPM_Rate | 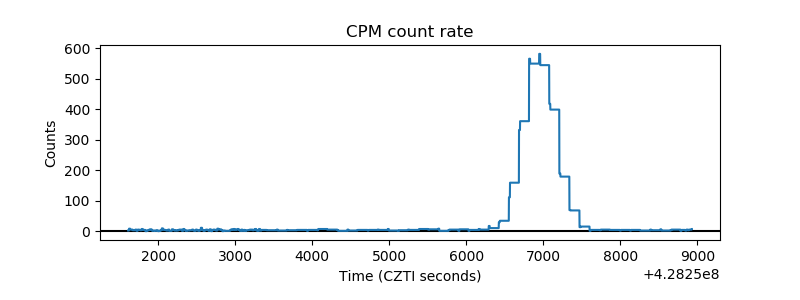 |
| CZT Counter | 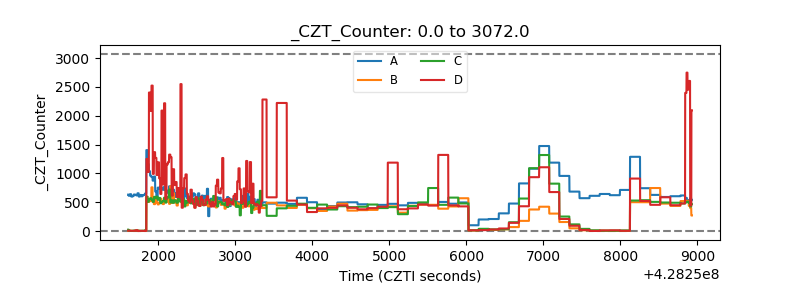 |
| +2.5 Volts monitor | 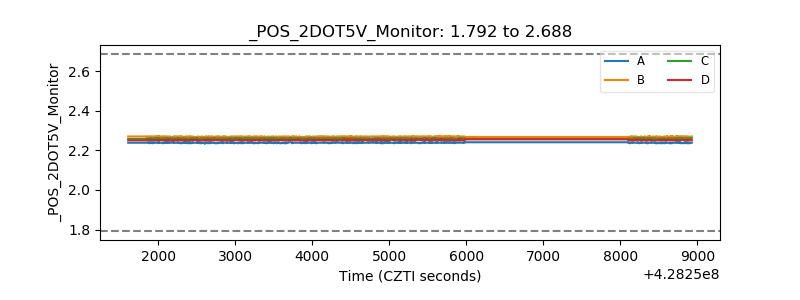 |
| +5 Volts monitor | 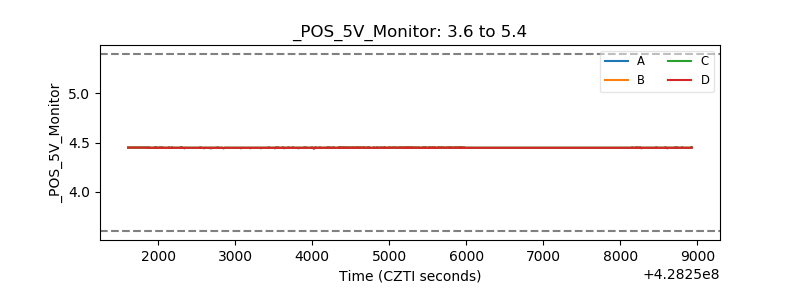 |
| _ROLL_ROT | 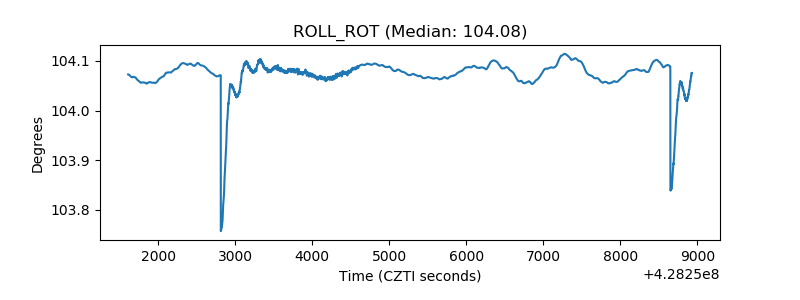 |
| _Roll_DEC | 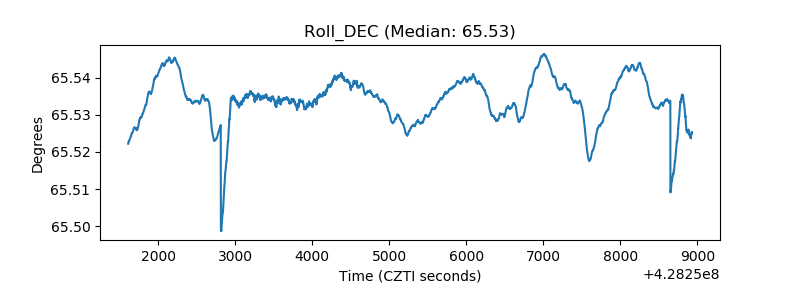 |
| _Roll_RA | 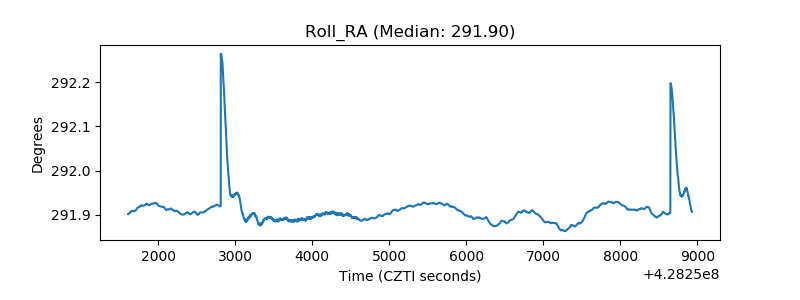 |
| Veto Counter | 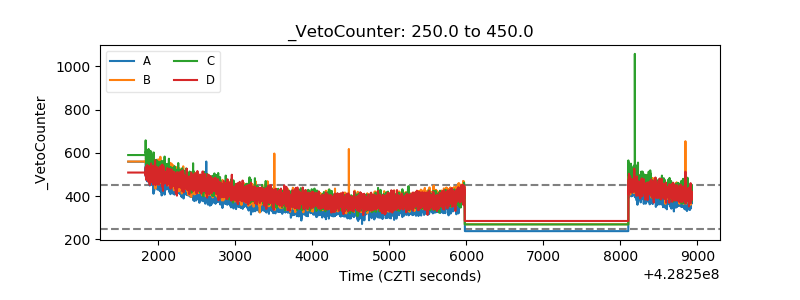 |