| Param | Original file | Final file |
|---|---|---|
| Filename | modeM0/AS1A12_102T01_9000005798_42346cztM0_level2.fits | modeM0/AS1A12_102T01_9000005798_42346cztM0_level2_quad_clean.evt |
| Size (bytes) | 291,726,720 | 86,189,760 |
| Size | 278.2 MB | 82.2 MB |
| Events in quadrant A | 2,699,331 | 581,178 |
| Events in quadrant B | 2,429,136 | 580,402 |
| Events in quadrant C | 2,328,028 | 571,320 |
| Events in quadrant D | 2,947,204 | 521,564 |
| Mode M9 | |||
|---|---|---|---|
| Quadrant | BADHDUFLAG | Total packets | Discarded packets |
| A | 0 | 21 | 0 |
| B | 0 | 21 | 0 |
| C | 0 | 22 | 0 |
| D | 0 | 22 | 0 |
| Mode SS | |||
|---|---|---|---|
| Quadrant | BADHDUFLAG | Total packets | Discarded packets |
| A | 0 | 106 | 0 |
| B | 0 | 106 | 0 |
| C | 0 | 106 | 0 |
| D | 0 | 106 | 0 |
| Mode M0 | |||
|---|---|---|---|
| Quadrant | BADHDUFLAG | Total packets | Discarded packets |
| A | 0 | 11223 | 2 |
| B | 0 | 10885 | 2 |
| C | 0 | 10177 | 2 |
| D | 0 | 12334 | 2 |
| Quadrant | Total seconds | Saturated seconds | Saturation percentage |
|---|---|---|---|
| A | 5062 | 15 | 0.296326% |
| B | 5062 | 70 | 1.382853% |
| C | 5061 | 4 | 0.079036% |
| D | 5061 | 144 | 2.845287% |
Noise dominated data is calculated using 1-second bins in cleaned event files. If a bin has >2000 counts, and if more than 50% of those come from <1% of pixels, then it is considered to be noise-dominated and hence unusable.
| Quadrant | # 1 sec bins | Bins with >0 counts | Bins with >2000 counts | High rate bins dominated by noise | Noise dominated (total time) | Noise dominated (detector-on time) | Marked lightcurve |
|---|---|---|---|---|---|---|---|
| A | 7125 | 5063 | 7 | 7 | 0.10% | 0.14% | 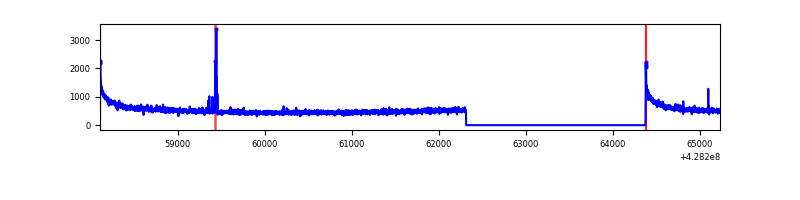 |
| B | 7125 | 5063 | 49 | 49 | 0.69% | 0.97% | 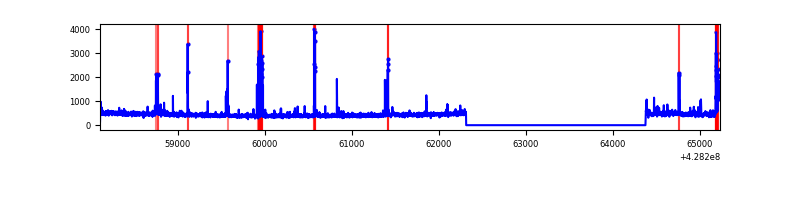 |
| C | 7124 | 5062 | 0 | 0 | 0.00% | 0.00% | 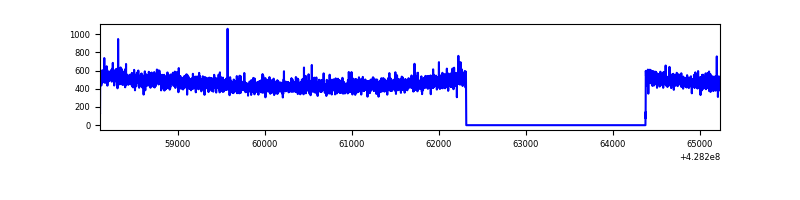 |
| D | 7124 | 5062 | 121 | 121 | 1.70% | 2.39% | 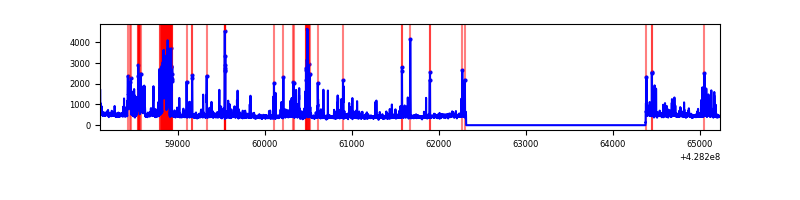 |
Top three noisy pixels from each quadrant. If the there are fewer than three noisy pixels in the level2.evt file, extra rows are filled as -1
| Pixel properties | Quadrant properties | ||||||
|---|---|---|---|---|---|---|---|
| Quadrant | DetID | PixID | Counts | Sigma | Mean | Median | Sigma |
| A | 10 | 83 | 558976 | 5038.32 | 542 | 533 | 110.8 |
| A | 10 | 255 | 18576 | 162.79 | 542 | 533 | 110.8 |
| A | 13 | 6 | 12172 | 105.01 | 542 | 533 | 110.8 |
| B | 5 | 255 | 94851 | 914.65 | 538 | 524 | 103.1 |
| B | 5 | 172 | 84280 | 812.15 | 538 | 524 | 103.1 |
| B | 4 | 81 | 64460 | 619.96 | 538 | 524 | 103.1 |
| C | 15 | 214 | 210307 | 1671.29 | 538 | 541 | 125.5 |
| C | 9 | 54 | 11857 | 90.16 | 538 | 541 | 125.5 |
| C | 7 | 247 | 8388 | 62.52 | 538 | 541 | 125.5 |
| D | 12 | 233 | 419452 | 3254.65 | 531 | 516 | 128.7 |
| D | 12 | 6 | 106774 | 825.5 | 531 | 516 | 128.7 |
| D | 10 | 255 | 96245 | 743.7 | 531 | 516 | 128.7 |
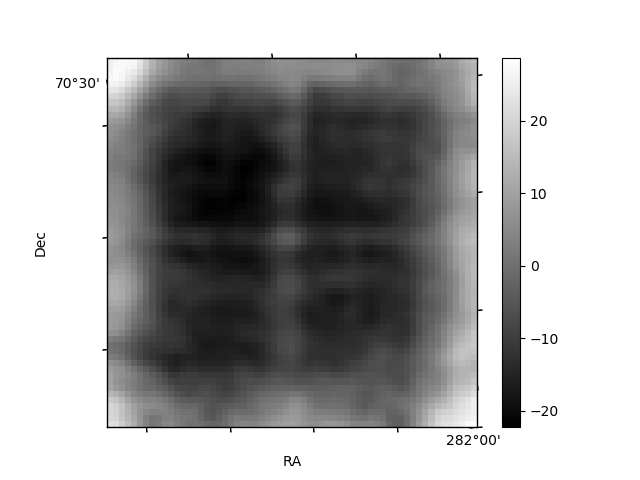
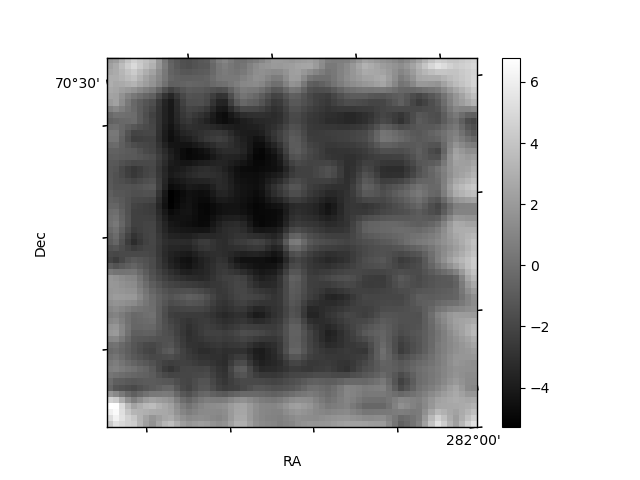
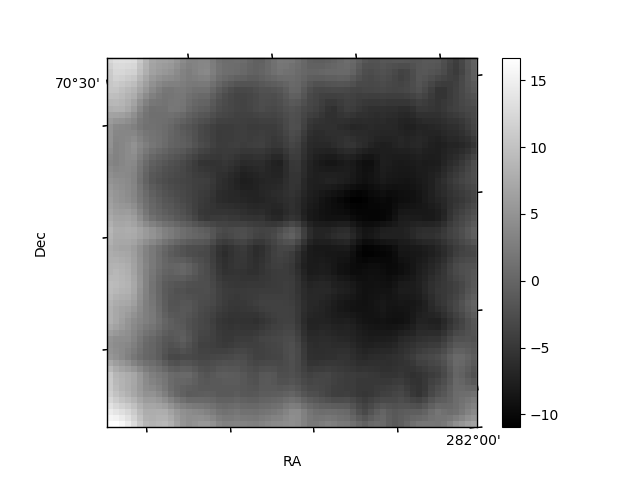
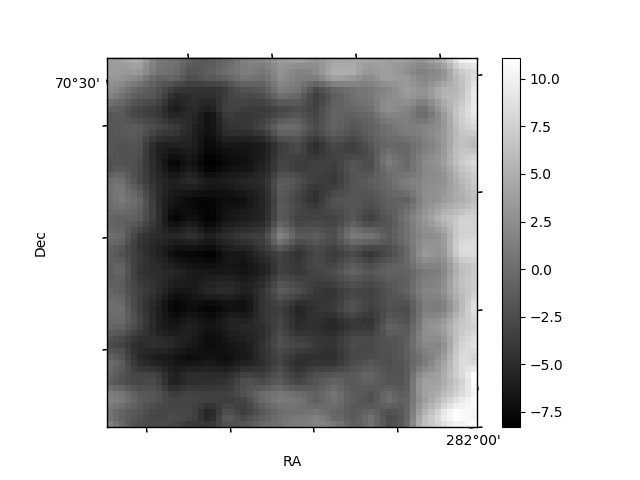
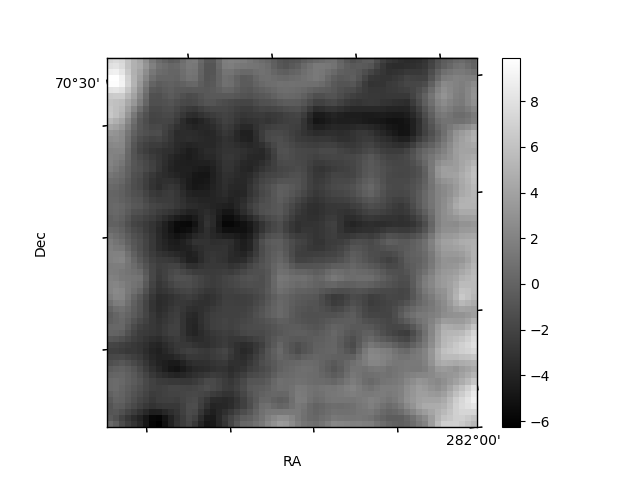
Histogram calculated using DETX and DETY for each event in the final _common_clean file
| Quadrant A | 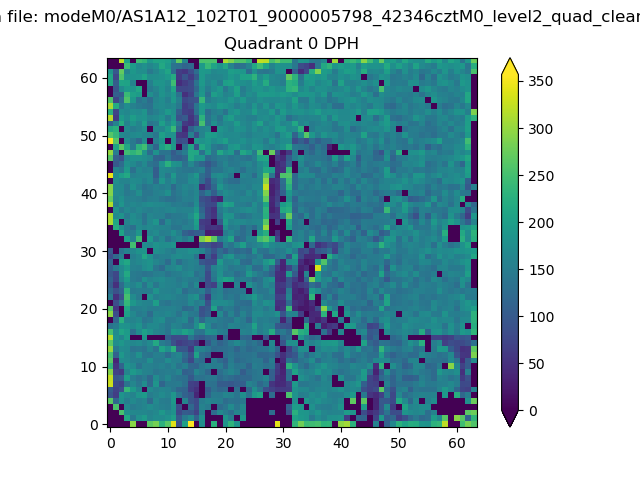 |
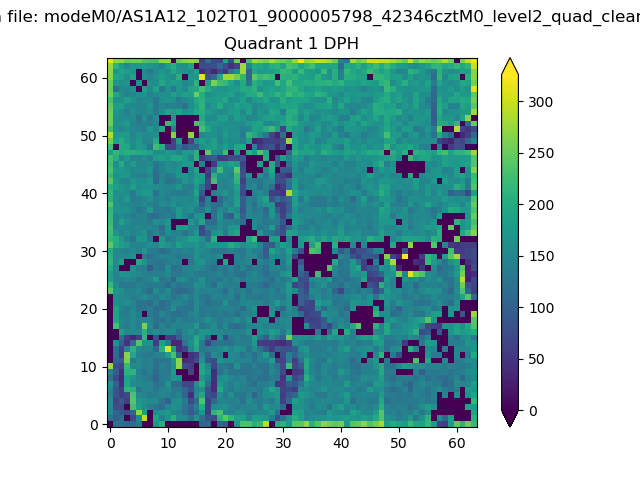 |
Quadrant B |
|---|---|---|---|
| Quadrant D | 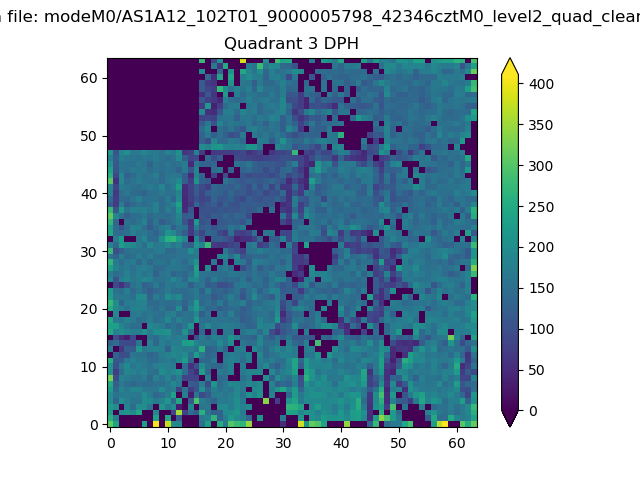 |
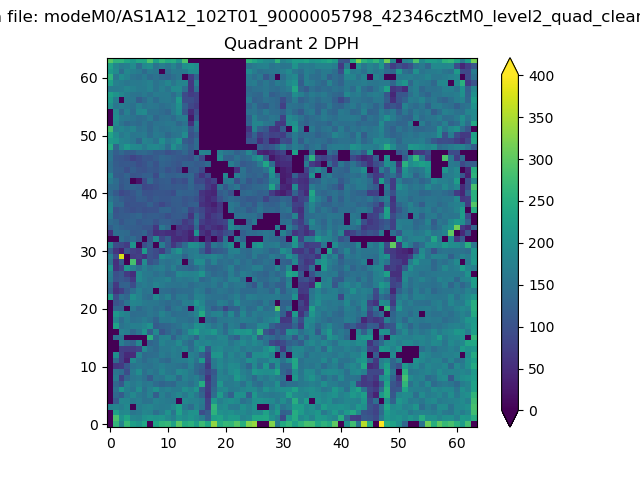 |
Quadrant C |
| Plot type | Count rate plots | Images |
|---|---|---|
| Comparison with Poisson distribution Blue bars denote a histogram of data divided into 1 sec bins. Red curve is a Poisson curve with rate = median count rate of data. |
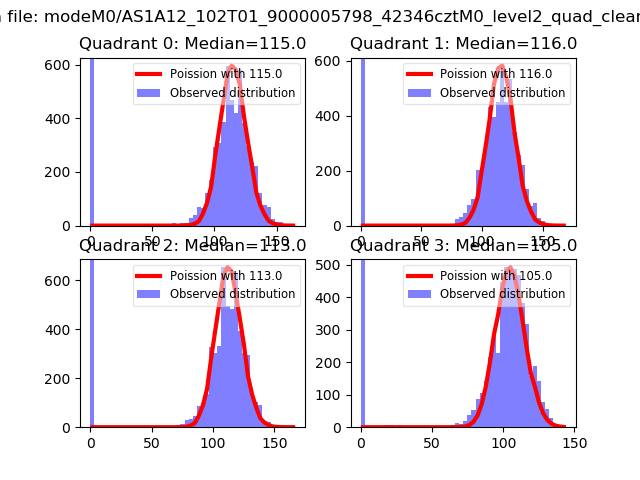 |
 |
| Quadrant-wise count rates Data is divided into 100 sec bins |
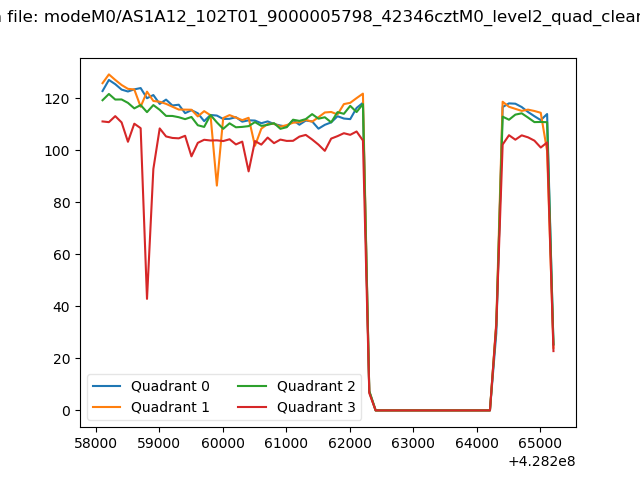 |
|
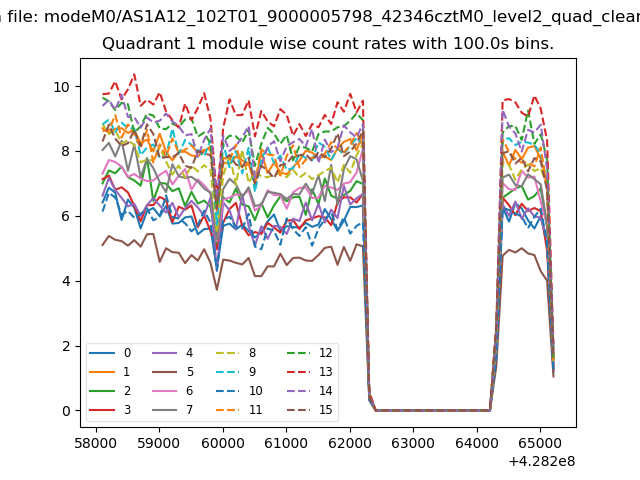
| Module-wise count rates for Quadrant A Data is divided into 100 sec bins |
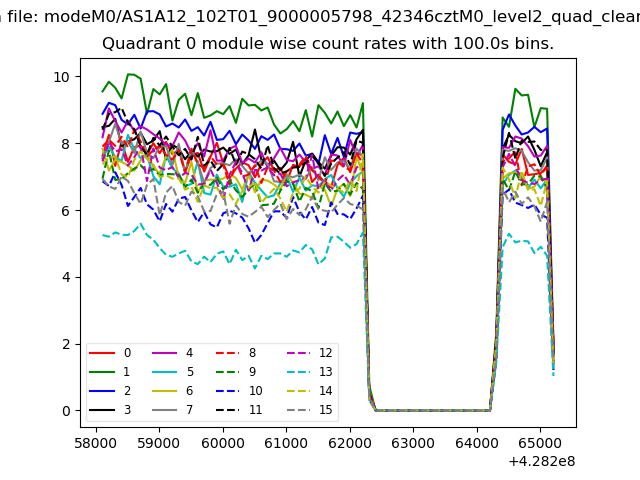 |
 |
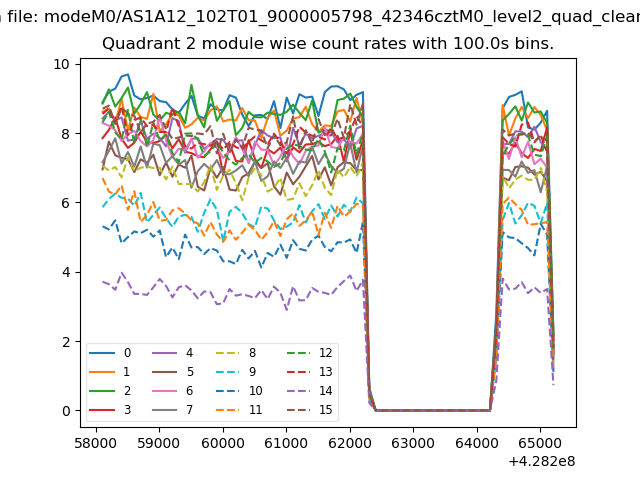
| Module-wise count rates for Quadrant B Data is divided into 100 sec bins |
 |
 |
| Module-wise count rates for Quadrant C Data is divided into 100 sec bins |
 |
 |
| Module-wise count rates for Quadrant D Data is divided into 100 sec bins |
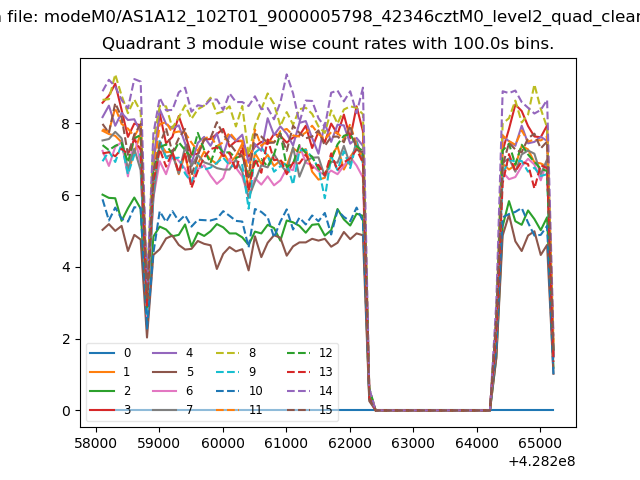 |
 |
| Parameter | Plot |
|---|---|
| CZT HV Monitor | 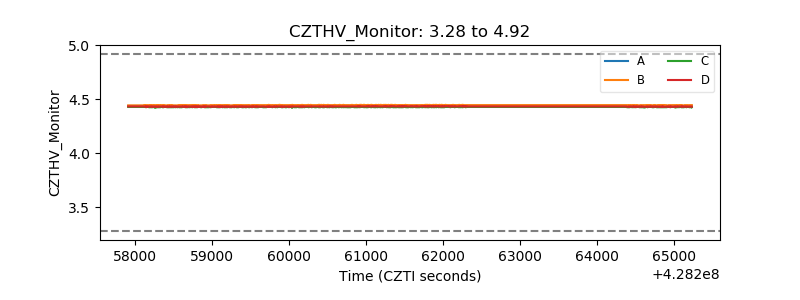 |
| D_VDD | 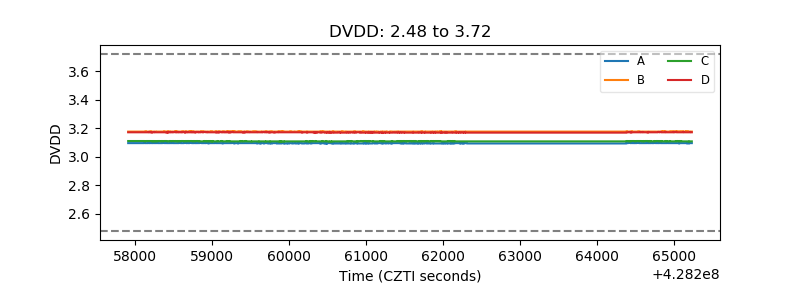 |
| Temperature 1 | 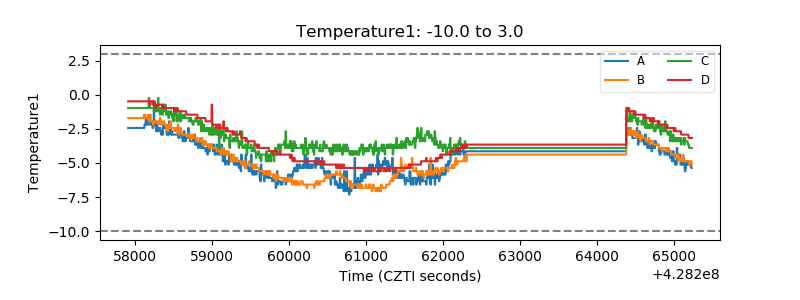 |
| Veto HV Monitor | 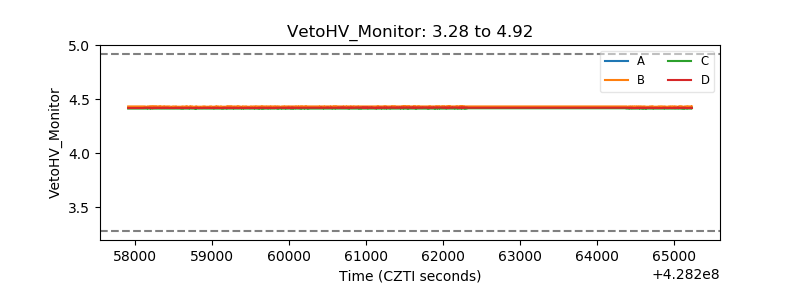 |
| Veto LLD | 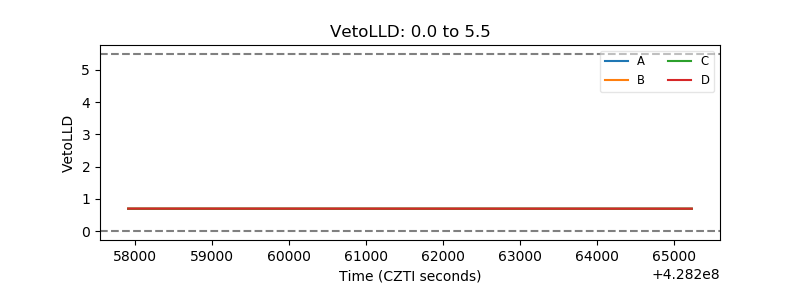 |
| Alpha Counter | 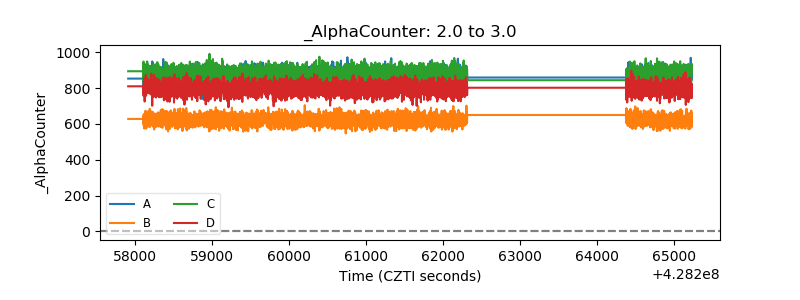 |
| _CPM_Rate | 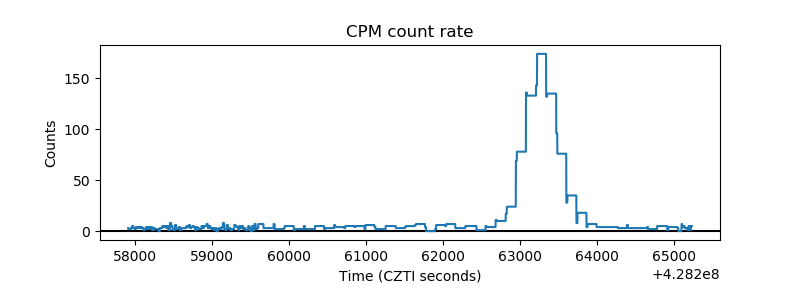 |
| CZT Counter | 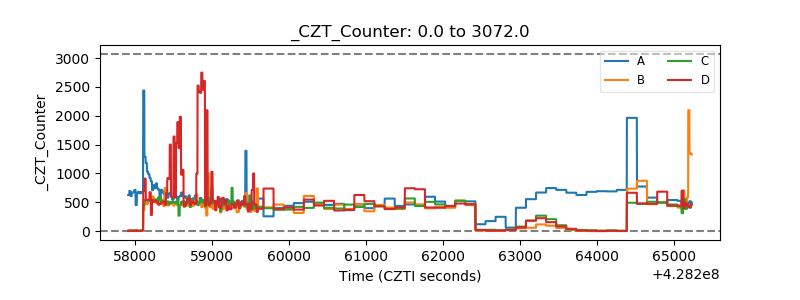 |
| +2.5 Volts monitor | 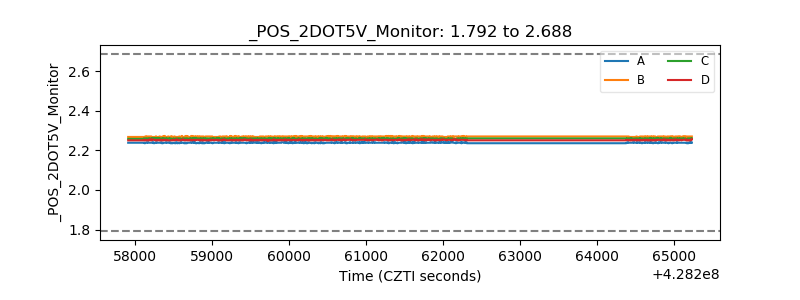 |
| +5 Volts monitor |  |
| _ROLL_ROT | 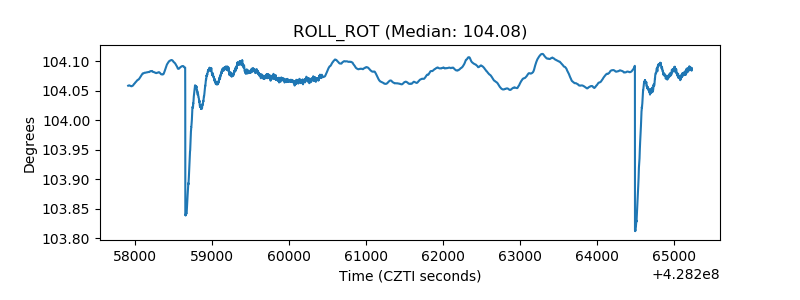 |
| _Roll_DEC | 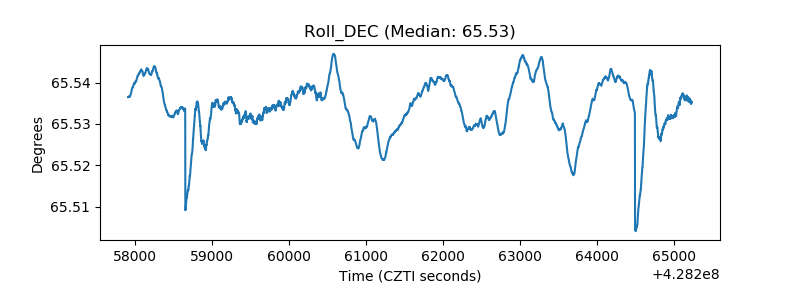 |
| _Roll_RA | 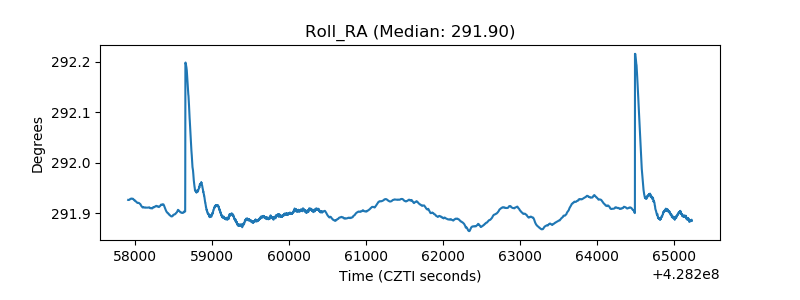 |
| Veto Counter | 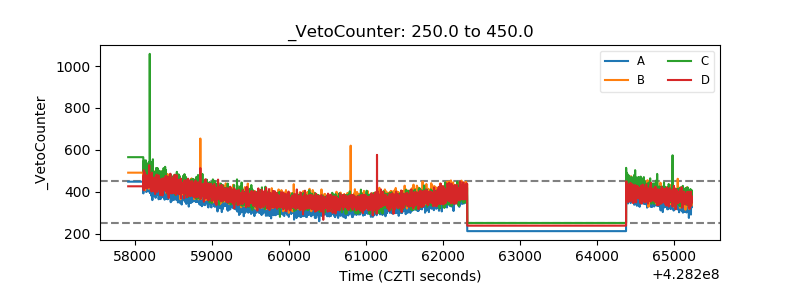 |