| Param | Original file | Final file |
|---|---|---|
| Filename | modeM0/AS1A12_102T01_9000005798_42347cztM0_level2.fits | modeM0/AS1A12_102T01_9000005798_42347cztM0_level2_quad_clean.evt |
| Size (bytes) | 284,345,280 | 87,050,880 |
| Size | 271.2 MB | 83.0 MB |
| Events in quadrant A | 2,707,419 | 578,603 |
| Events in quadrant B | 2,397,395 | 583,956 |
| Events in quadrant C | 2,372,313 | 573,729 |
| Events in quadrant D | 2,638,048 | 531,222 |
| Mode M9 | |||
|---|---|---|---|
| Quadrant | BADHDUFLAG | Total packets | Discarded packets |
| A | 0 | 30 | 0 |
| B | 0 | 31 | 0 |
| C | 0 | 31 | 0 |
| D | 0 | 31 | 0 |
| Mode SS | |||
|---|---|---|---|
| Quadrant | BADHDUFLAG | Total packets | Discarded packets |
| A | 0 | 108 | 0 |
| B | 0 | 108 | 0 |
| C | 0 | 108 | 0 |
| D | 0 | 108 | 0 |
| Mode M0 | |||
|---|---|---|---|
| Quadrant | BADHDUFLAG | Total packets | Discarded packets |
| A | 0 | 11409 | 2 |
| B | 0 | 11013 | 2 |
| C | 0 | 10583 | 2 |
| D | 0 | 11689 | 2 |
| Quadrant | Total seconds | Saturated seconds | Saturation percentage |
|---|---|---|---|
| A | 5259 | 16 | 0.304240% |
| B | 5259 | 35 | 0.665526% |
| C | 5259 | 5 | 0.095075% |
| D | 5259 | 42 | 0.798631% |
Noise dominated data is calculated using 1-second bins in cleaned event files. If a bin has >2000 counts, and if more than 50% of those come from <1% of pixels, then it is considered to be noise-dominated and hence unusable.
| Quadrant | # 1 sec bins | Bins with >0 counts | Bins with >2000 counts | High rate bins dominated by noise | Noise dominated (total time) | Noise dominated (detector-on time) | Marked lightcurve |
|---|---|---|---|---|---|---|---|
| A | 7052 | 5260 | 5 | 5 | 0.07% | 0.10% | 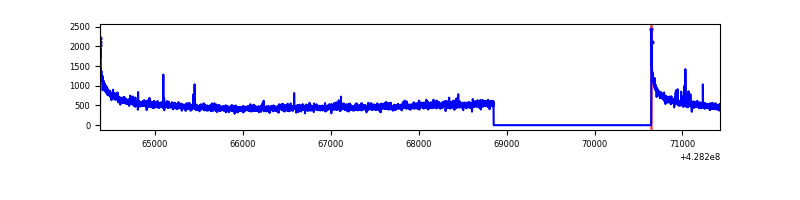 |
| B | 7052 | 5260 | 24 | 24 | 0.34% | 0.46% | 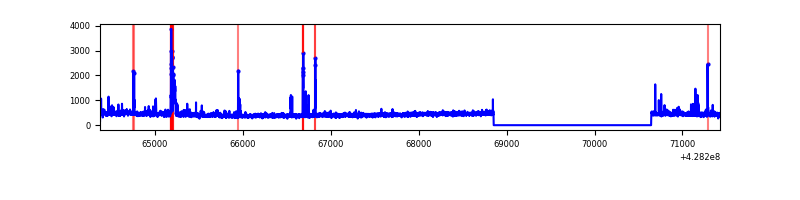 |
| C | 7052 | 5260 | 2 | 2 | 0.03% | 0.04% | 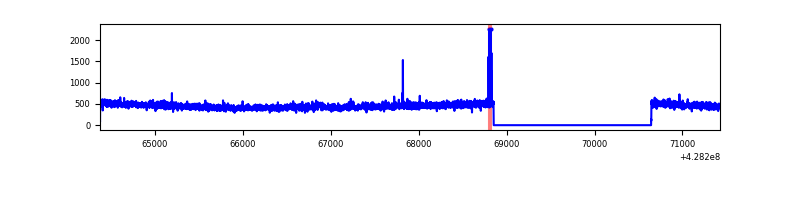 |
| D | 7052 | 5260 | 30 | 30 | 0.43% | 0.57% | 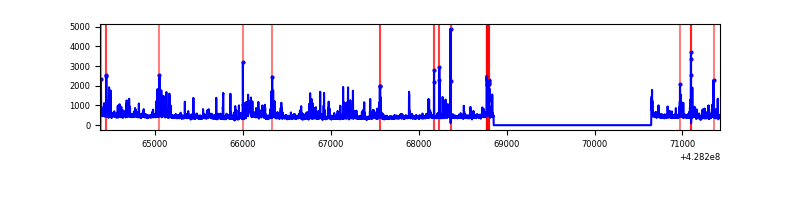 |
Top three noisy pixels from each quadrant. If the there are fewer than three noisy pixels in the level2.evt file, extra rows are filled as -1
| Pixel properties | Quadrant properties | ||||||
|---|---|---|---|---|---|---|---|
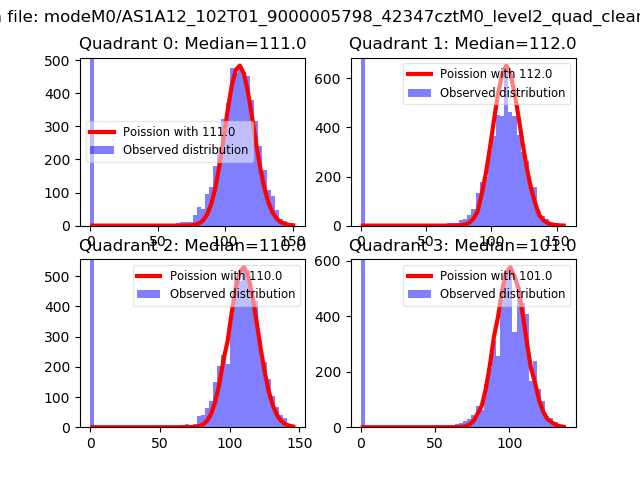
| Quadrant | DetID | PixID | Counts | Sigma | Mean | Median | Sigma |
| A | 10 | 83 | 550316 | 4856.07 | 550 | 538 | 113.2 |
| A | 13 | 248 | 12997 | 110.05 | 550 | 538 | 113.2 |
| A | 13 | 6 | 10316 | 86.37 | 550 | 538 | 113.2 |
| B | 5 | 255 | 100976 | 954.21 | 548 | 532 | 105.3 |
| B | 5 | 172 | 49053 | 460.94 | 548 | 532 | 105.3 |
| B | 0 | 245 | 47665 | 447.76 | 548 | 532 | 105.3 |
| C | 15 | 214 | 218108 | 1708.81 | 544 | 546 | 127.3 |
| C | 15 | 111 | 24488 | 188.05 | 544 | 546 | 127.3 |
| C | 7 | 247 | 6104 | 43.65 | 544 | 546 | 127.3 |
| D | 5 | 222 | 134156 | 1013.35 | 541 | 525 | 131.9 |
| D | 12 | 6 | 72234 | 543.78 | 541 | 525 | 131.9 |
| D | 13 | 249 | 69076 | 519.84 | 541 | 525 | 131.9 |
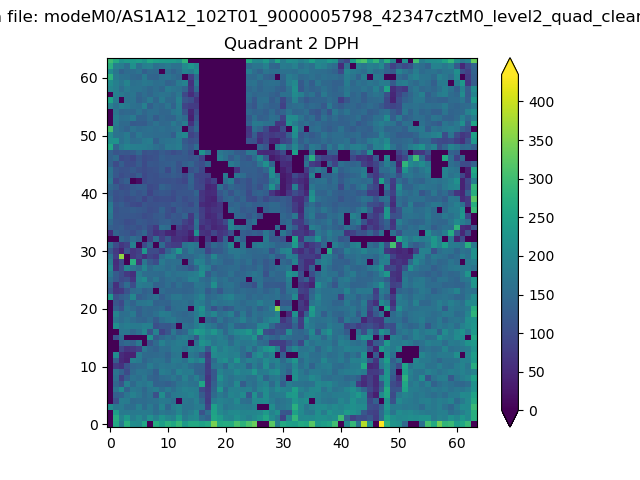
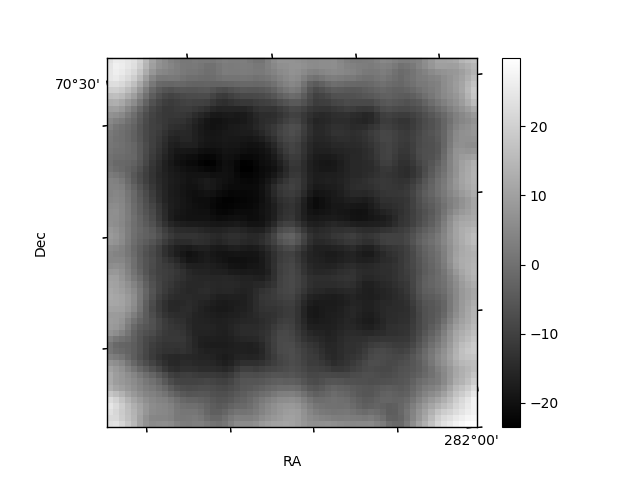
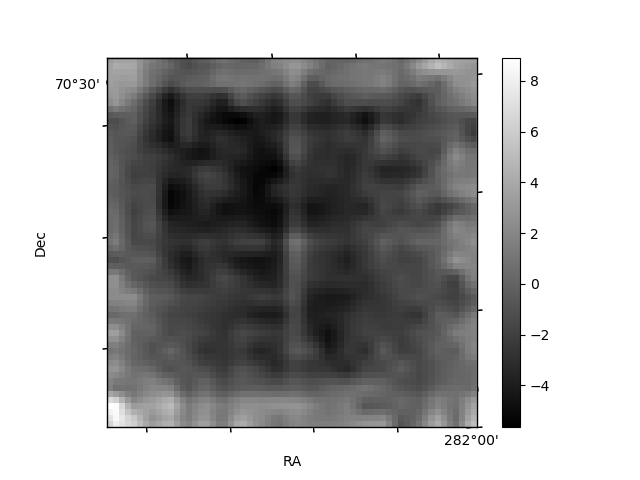
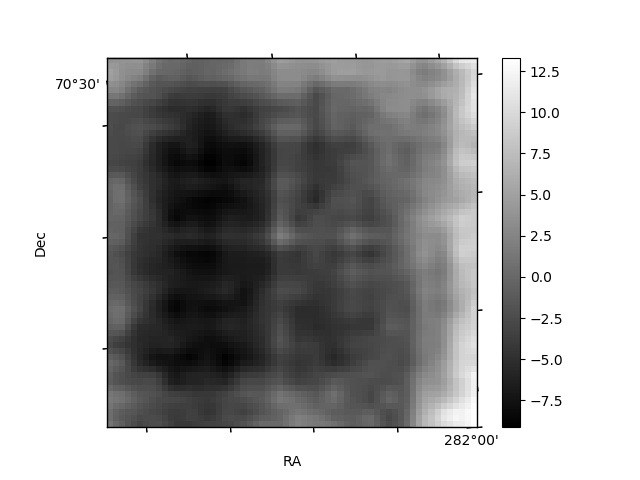
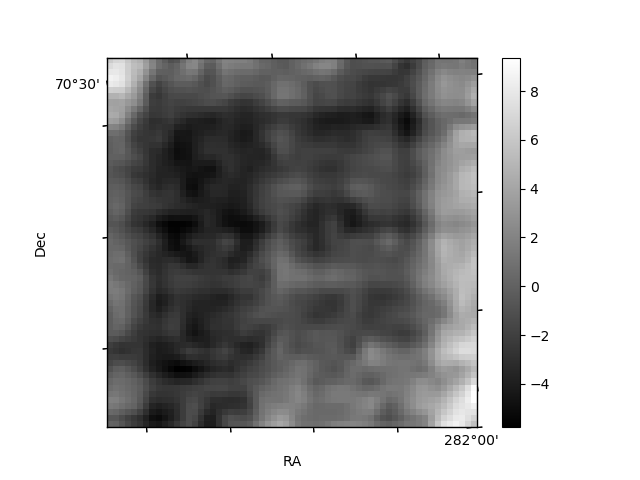
Histogram calculated using DETX and DETY for each event in the final _common_clean file
| Quadrant A | 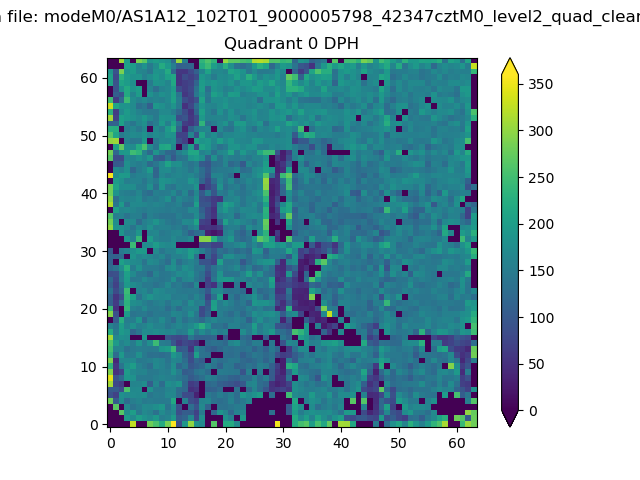 |
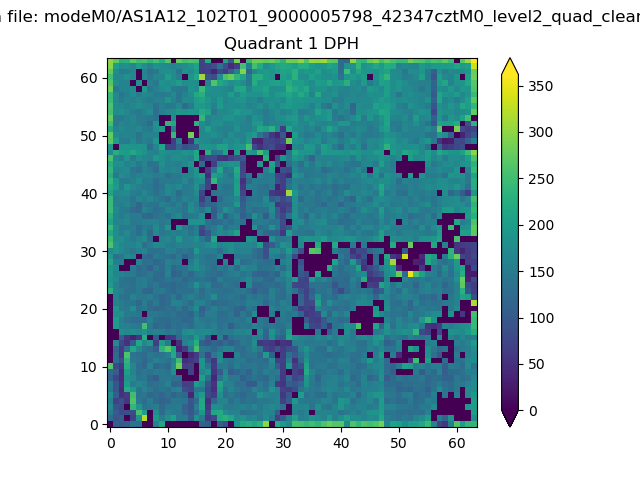 |
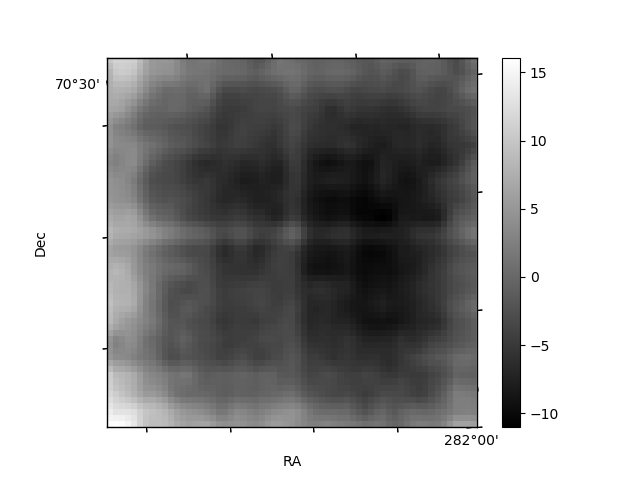
Quadrant B |
|---|---|---|---|
| Quadrant D | 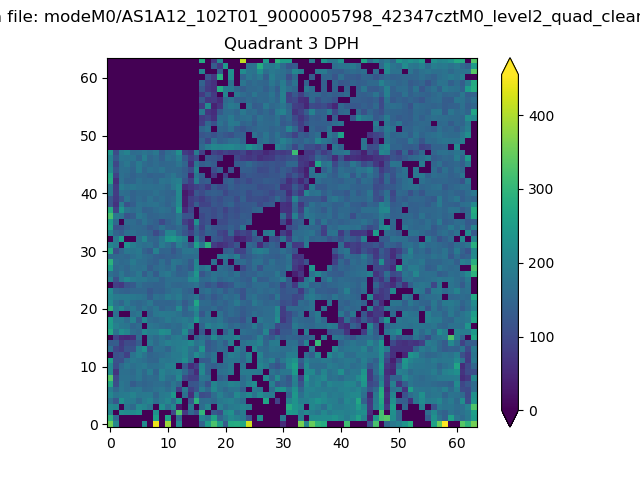 |
 |
Quadrant C |
| Plot type | Count rate plots | Images |
|---|---|---|
| Comparison with Poisson distribution Blue bars denote a histogram of data divided into 1 sec bins. Red curve is a Poisson curve with rate = median count rate of data. |
 |
 |
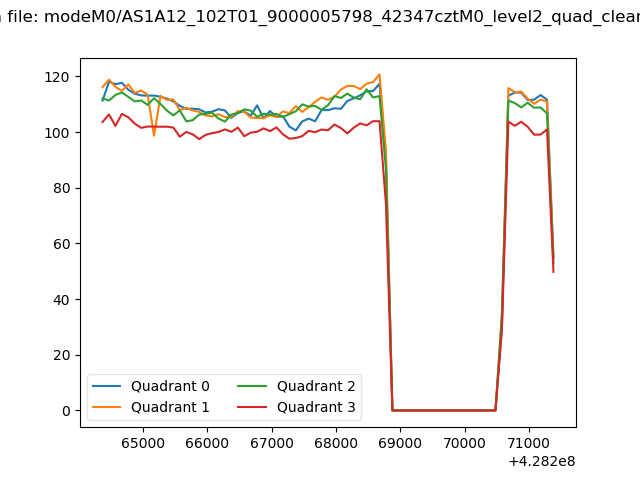
| Quadrant-wise count rates Data is divided into 100 sec bins |
 |
|
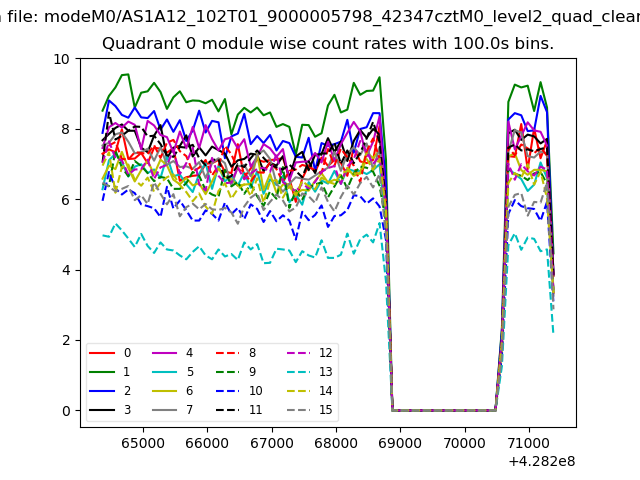
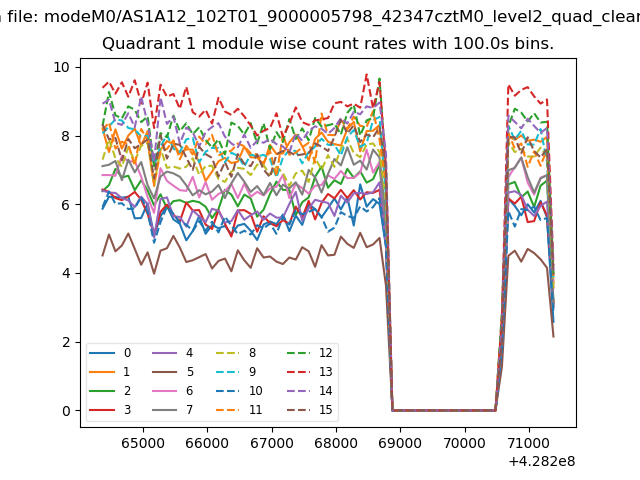
| Module-wise count rates for Quadrant A Data is divided into 100 sec bins |
 |
 |
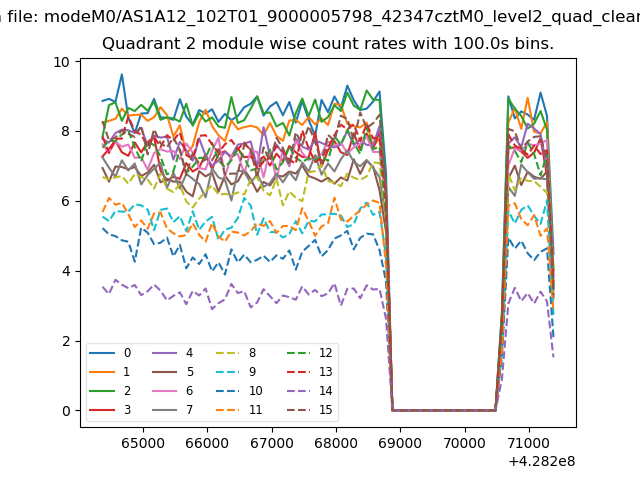
| Module-wise count rates for Quadrant B Data is divided into 100 sec bins |
 |
 |
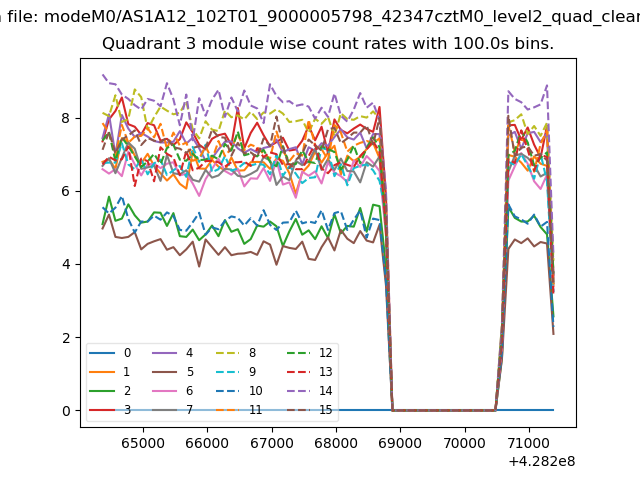
| Module-wise count rates for Quadrant C Data is divided into 100 sec bins |
 |
 |
| Module-wise count rates for Quadrant D Data is divided into 100 sec bins |
 |
 |
| Parameter | Plot |
|---|---|
| CZT HV Monitor | 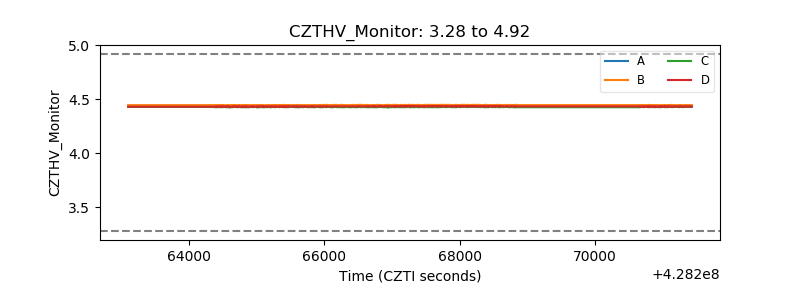 |
| D_VDD | 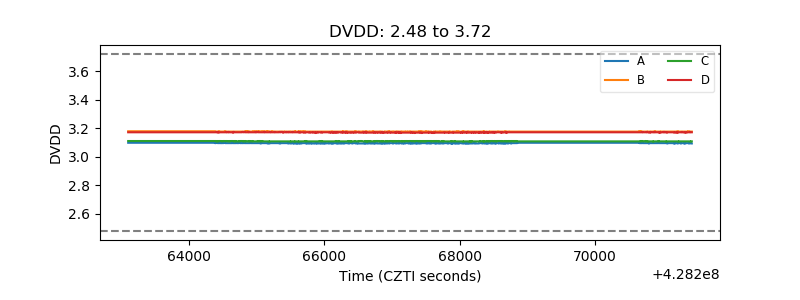 |
| Temperature 1 | 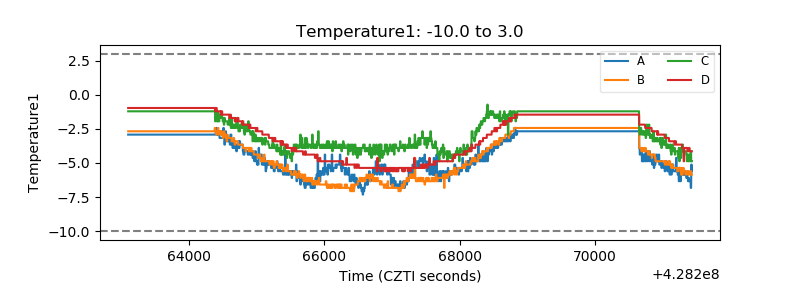 |
| Veto HV Monitor | 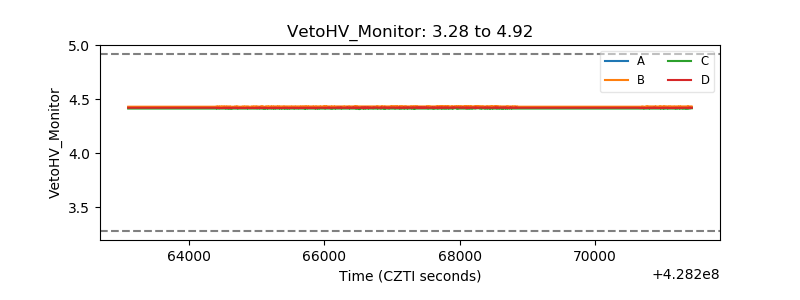 |
| Veto LLD | 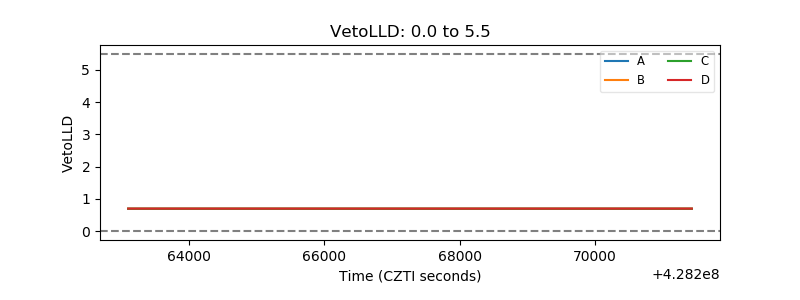 |
| Alpha Counter | 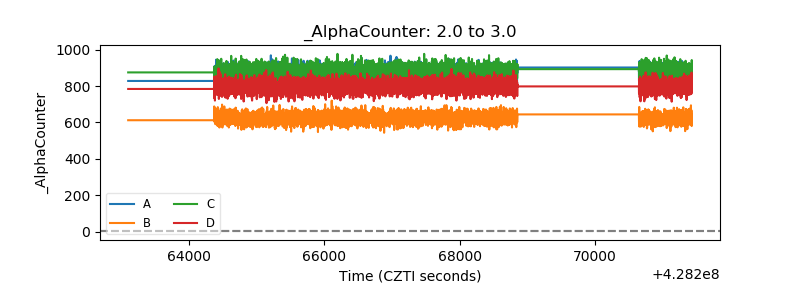 |
| _CPM_Rate | 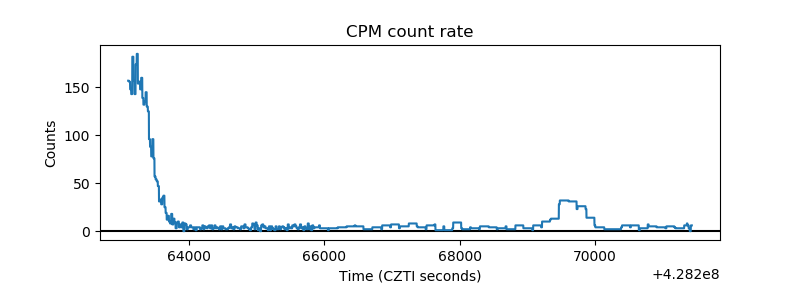 |
| CZT Counter | 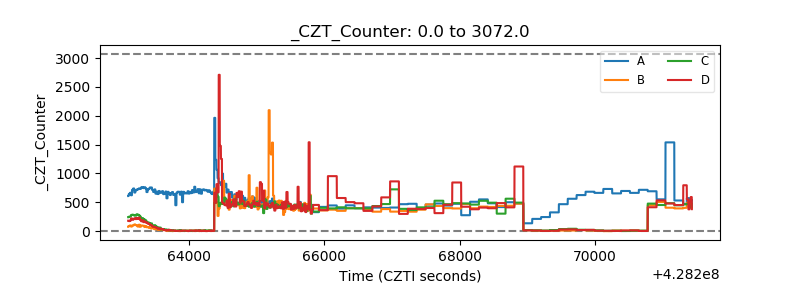 |
| +2.5 Volts monitor | 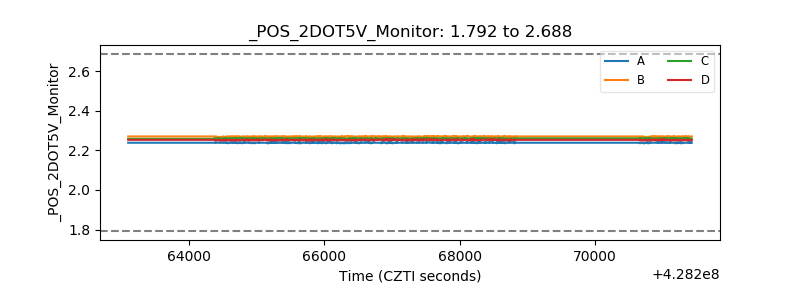 |
| +5 Volts monitor | 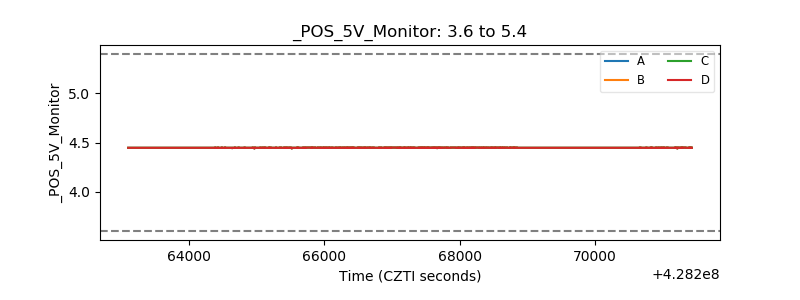 |
| _ROLL_ROT | 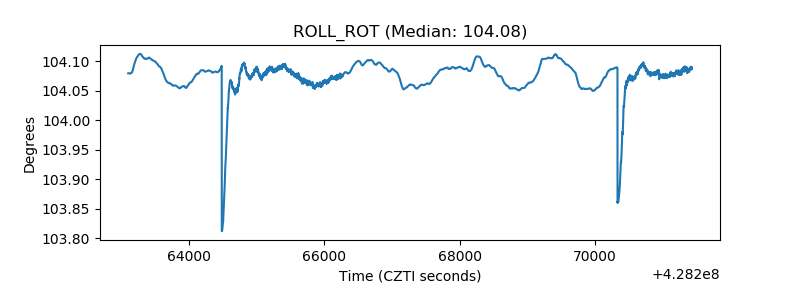 |
| _Roll_DEC | 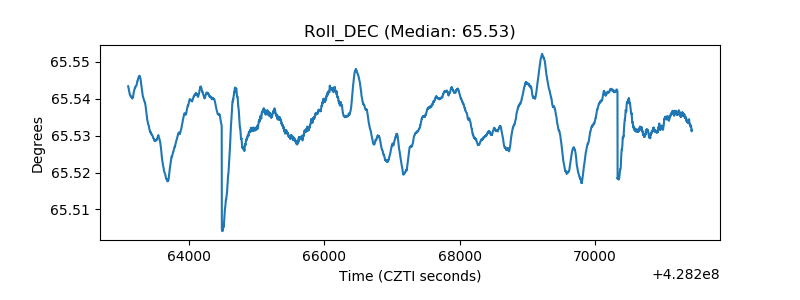 |
| _Roll_RA | 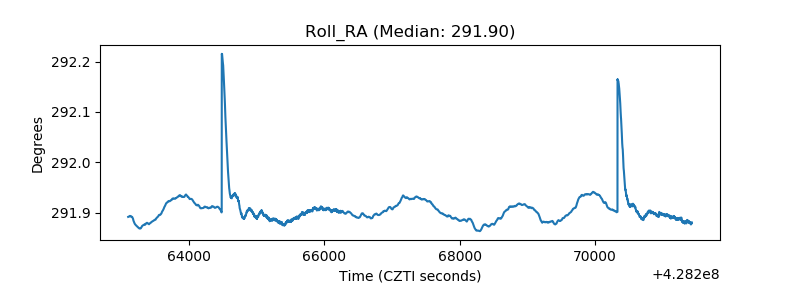 |
| Veto Counter | 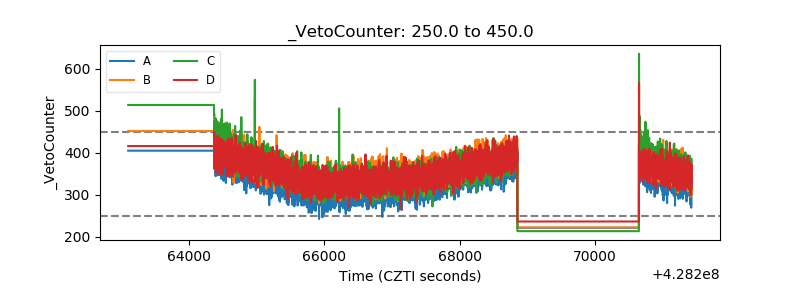 |