| Param | Original file | Final file |
|---|---|---|
| Filename | modeM0/AS1A12_102T01_9000005798_42348cztM0_level2.fits | modeM0/AS1A12_102T01_9000005798_42348cztM0_level2_quad_clean.evt |
| Size (bytes) | 313,819,200 | 93,006,720 |
| Size | 299.3 MB | 88.7 MB |
| Events in quadrant A | 2,904,725 | 618,785 |
| Events in quadrant B | 2,493,673 | 625,652 |
| Events in quadrant C | 2,541,784 | 612,530 |
| Events in quadrant D | 3,232,867 | 561,507 |
| Mode M9 | |||
|---|---|---|---|
| Quadrant | BADHDUFLAG | Total packets | Discarded packets |
| A | 0 | 28 | 0 |
| B | 0 | 28 | 0 |
| C | 0 | 29 | 0 |
| D | 0 | 29 | 0 |
| Mode SS | |||
|---|---|---|---|
| Quadrant | BADHDUFLAG | Total packets | Discarded packets |
| A | 0 | 116 | 0 |
| B | 0 | 116 | 0 |
| C | 0 | 116 | 0 |
| D | 0 | 116 | 0 |
| Mode M0 | |||
|---|---|---|---|
| Quadrant | BADHDUFLAG | Total packets | Discarded packets |
| A | 0 | 12322 | 2 |
| B | 0 | 11662 | 2 |
| C | 0 | 11419 | 2 |
| D | 0 | 13830 | 2 |
| Quadrant | Total seconds | Saturated seconds | Saturation percentage |
|---|---|---|---|
| A | 5687 | 14 | 0.246175% |
| B | 5687 | 15 | 0.263759% |
| C | 5687 | 3 | 0.052752% |
| D | 5687 | 114 | 2.004572% |
Noise dominated data is calculated using 1-second bins in cleaned event files. If a bin has >2000 counts, and if more than 50% of those come from <1% of pixels, then it is considered to be noise-dominated and hence unusable.
| Quadrant | # 1 sec bins | Bins with >0 counts | Bins with >2000 counts | High rate bins dominated by noise | Noise dominated (total time) | Noise dominated (detector-on time) | Marked lightcurve |
|---|---|---|---|---|---|---|---|
| A | 7149 | 5688 | 4 | 4 | 0.06% | 0.07% | 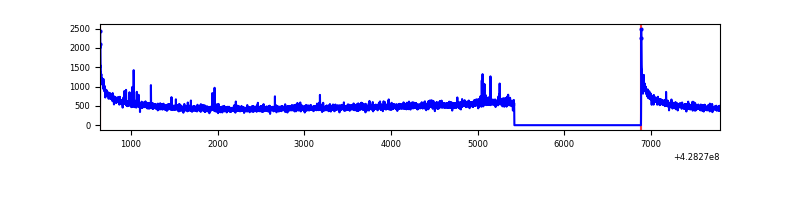 |
| B | 7149 | 5688 | 4 | 4 | 0.06% | 0.07% | 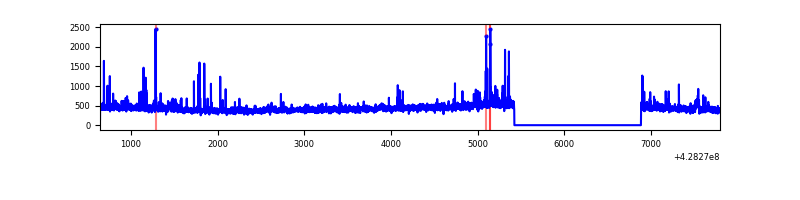 |
| C | 7149 | 5688 | 0 | 0 | 0.00% | 0.00% | 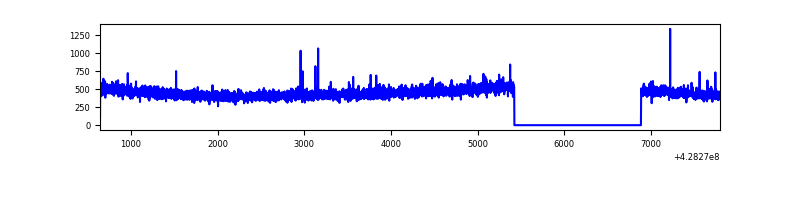 |
| D | 7149 | 5688 | 95 | 95 | 1.33% | 1.67% | 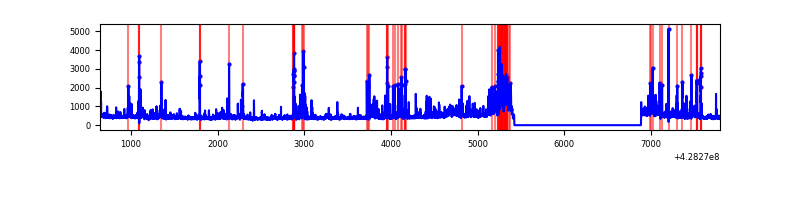 |
Top three noisy pixels from each quadrant. If the there are fewer than three noisy pixels in the level2.evt file, extra rows are filled as -1
| Pixel properties | Quadrant properties | ||||||
|---|---|---|---|---|---|---|---|
| Quadrant | DetID | PixID | Counts | Sigma | Mean | Median | Sigma |
| A | 10 | 83 | 568128 | 4644.94 | 595 | 581 | 122.2 |
| A | 13 | 248 | 23418 | 186.9 | 595 | 581 | 122.2 |
| A | 13 | 254 | 9848 | 75.84 | 595 | 581 | 122.2 |
| B | 5 | 255 | 58188 | 502.03 | 594 | 576 | 114.8 |
| B | 5 | 172 | 39410 | 338.4 | 594 | 576 | 114.8 |
| B | 0 | 245 | 28366 | 242.16 | 594 | 576 | 114.8 |
| C | 15 | 214 | 238291 | 1743.28 | 587 | 590 | 136.4 |
| C | 15 | 111 | 5980 | 39.53 | 587 | 590 | 136.4 |
| C | 7 | 247 | 4492 | 28.62 | 587 | 590 | 136.4 |
| D | 12 | 233 | 224279 | 1579.86 | 581 | 565 | 141.6 |
| D | 1 | 52 | 204557 | 1440.58 | 581 | 565 | 141.6 |
| D | 12 | 6 | 172140 | 1211.65 | 581 | 565 | 141.6 |
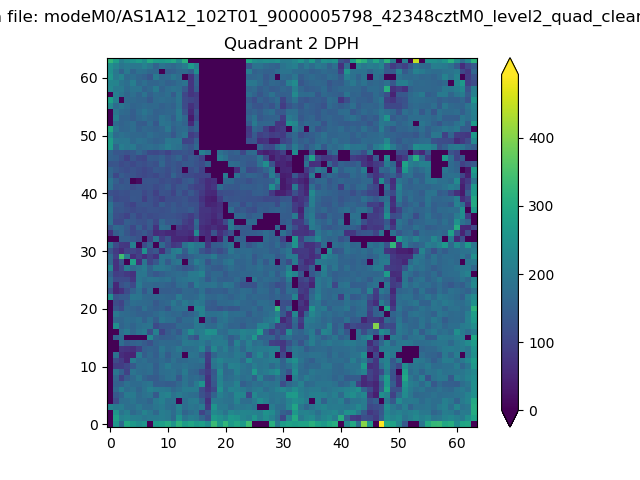
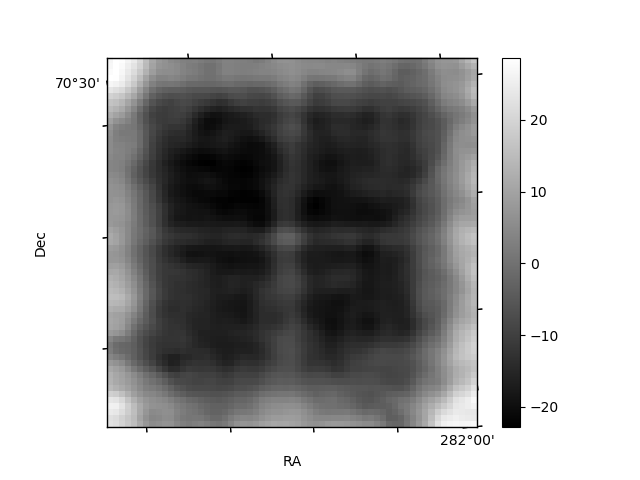
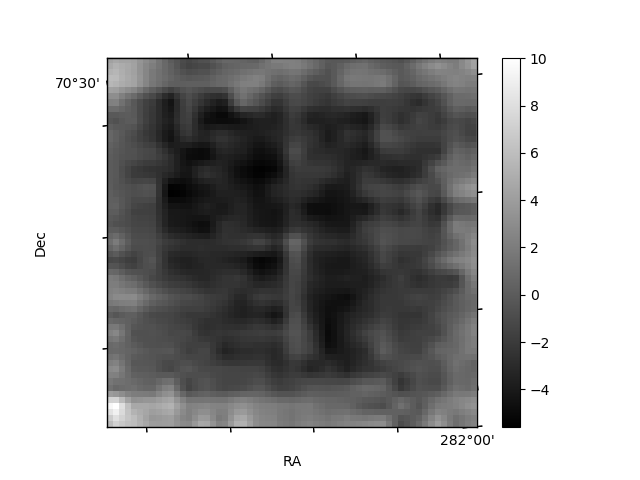
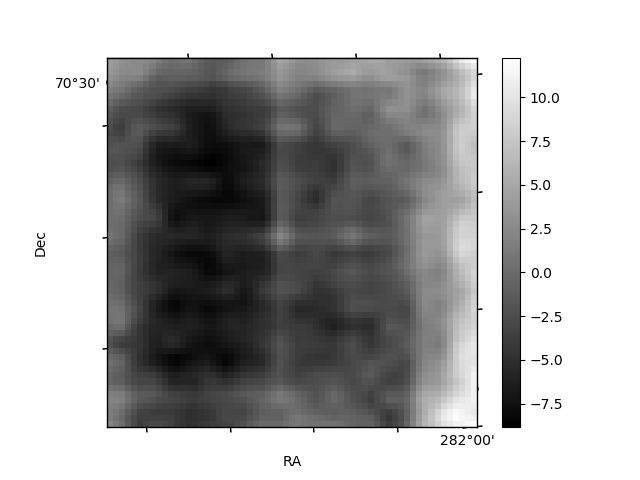
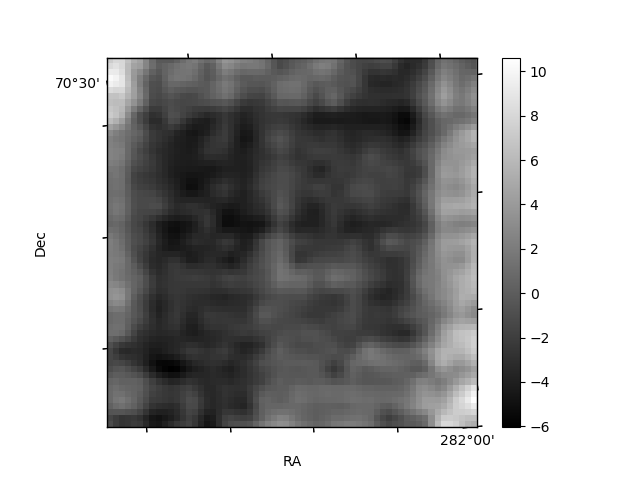
Histogram calculated using DETX and DETY for each event in the final _common_clean file
| Quadrant A | 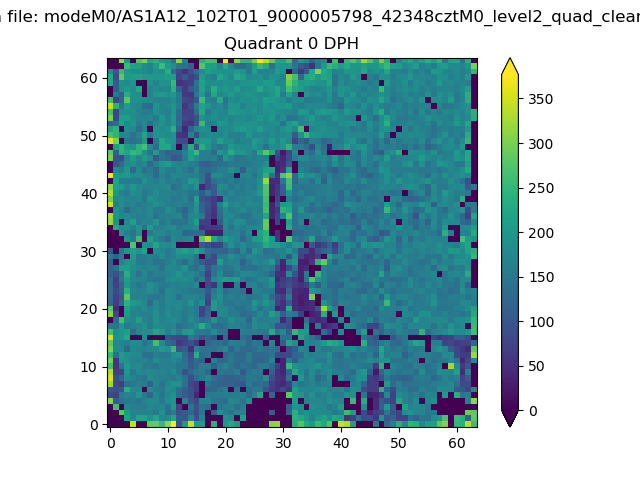 |
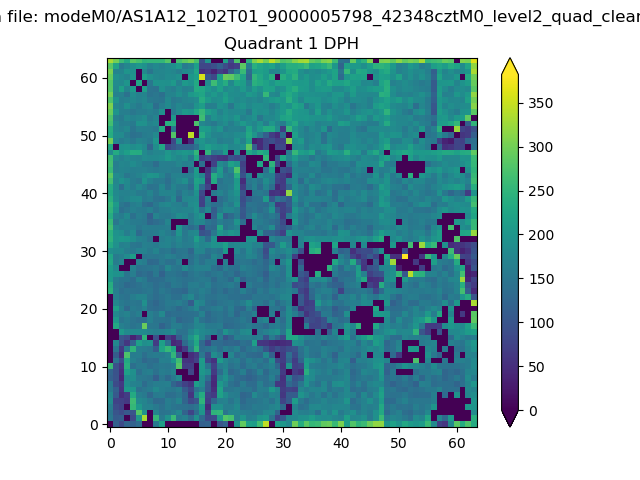 |
Quadrant B |
|---|---|---|---|
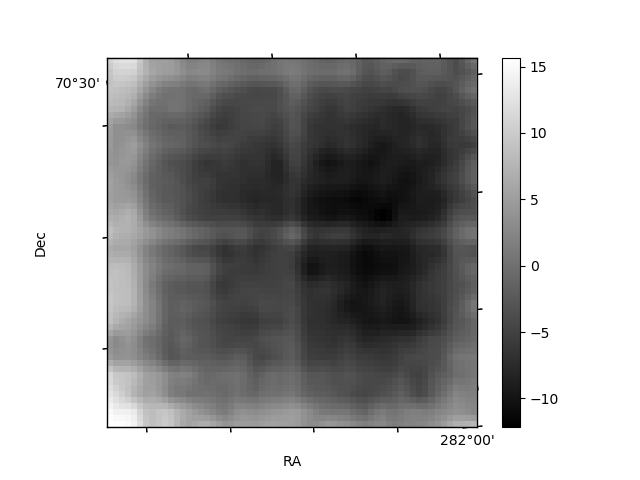
| Quadrant D | 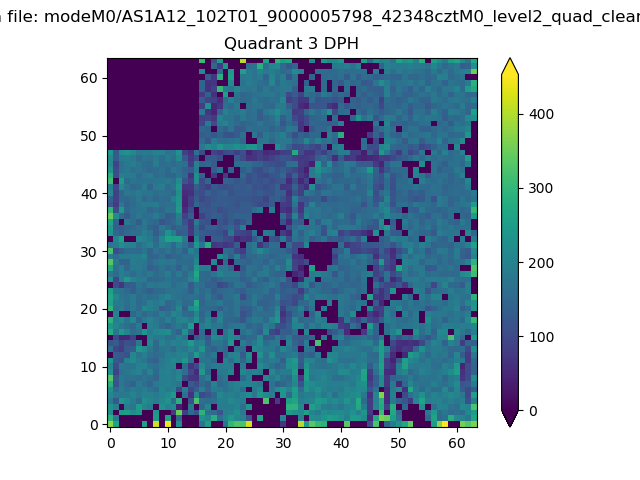 |
 |
Quadrant C |
| Plot type | Count rate plots | Images |
|---|---|---|
| Comparison with Poisson distribution Blue bars denote a histogram of data divided into 1 sec bins. Red curve is a Poisson curve with rate = median count rate of data. |
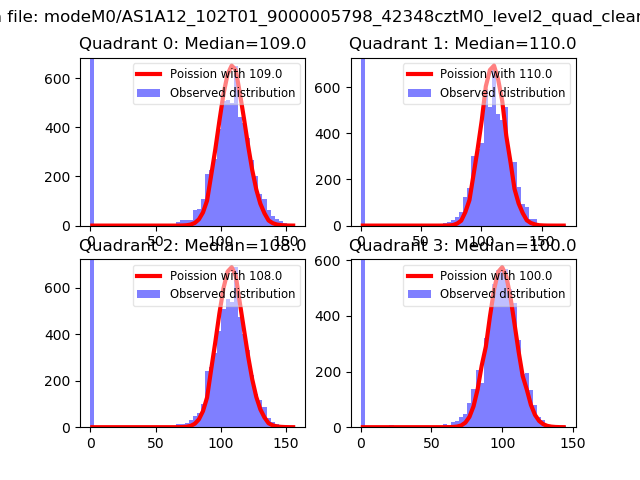 |
 |
| Quadrant-wise count rates Data is divided into 100 sec bins |
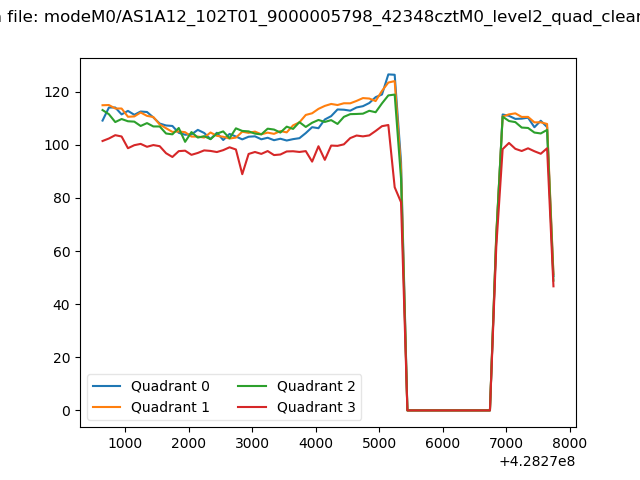 |
|
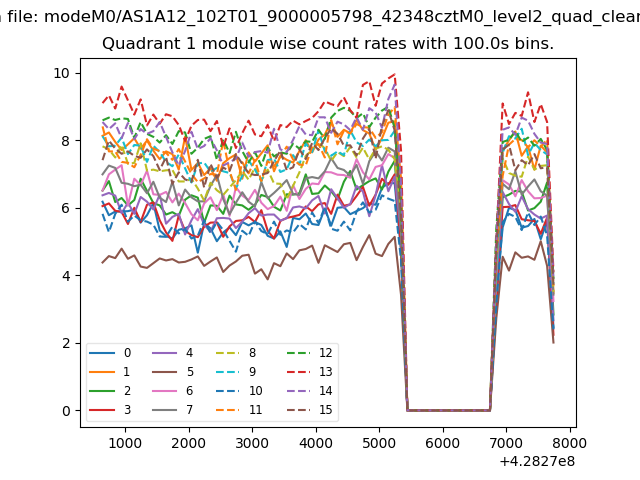
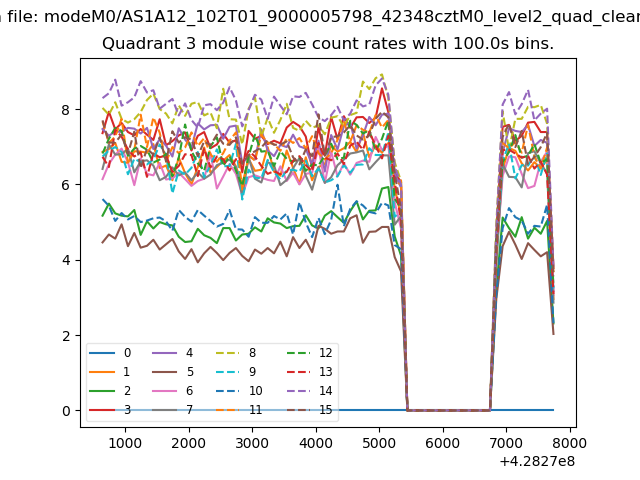
| Module-wise count rates for Quadrant A Data is divided into 100 sec bins |
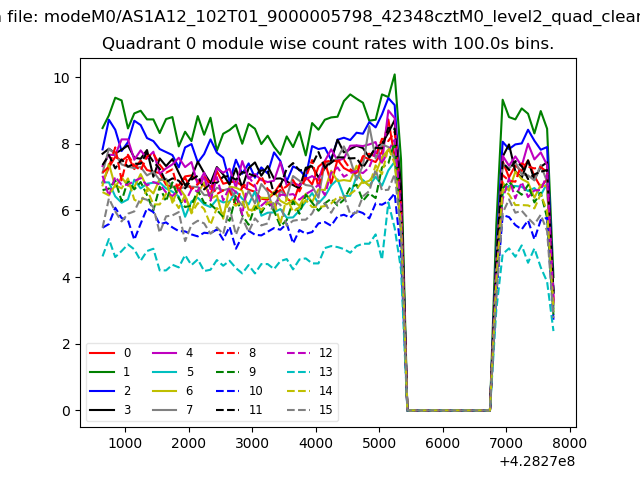 |
 |
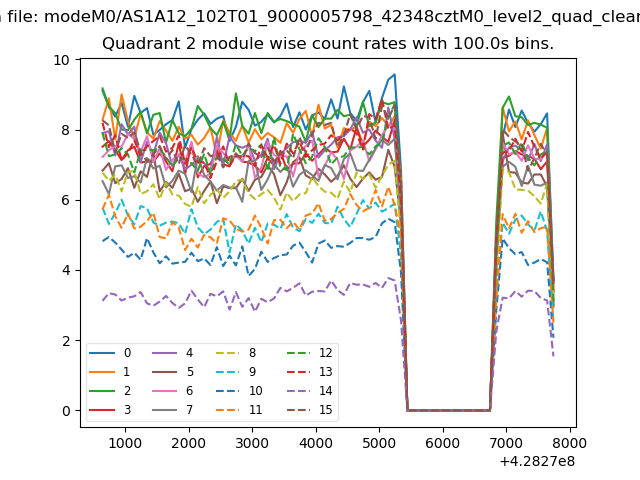
| Module-wise count rates for Quadrant B Data is divided into 100 sec bins |
 |
 |
| Module-wise count rates for Quadrant C Data is divided into 100 sec bins |
 |
 |
| Module-wise count rates for Quadrant D Data is divided into 100 sec bins |
 |
 |
| Parameter | Plot |
|---|---|
| CZT HV Monitor | 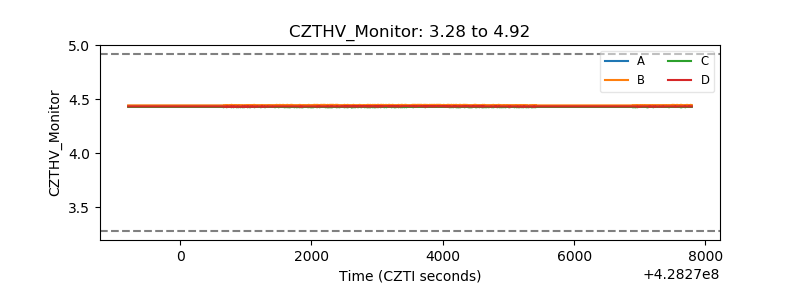 |
| D_VDD | 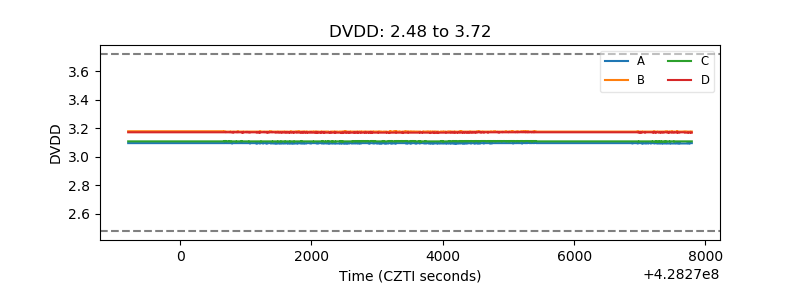 |
| Temperature 1 | 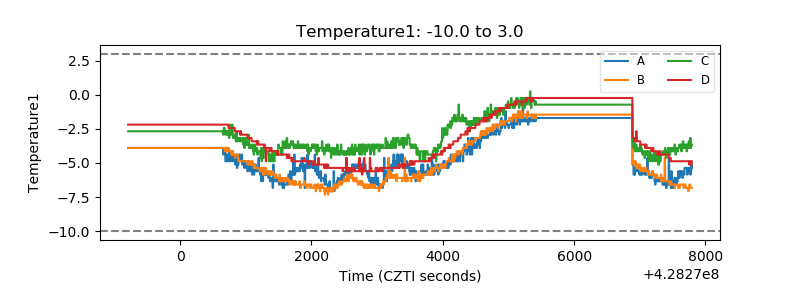 |
| Veto HV Monitor |  |
| Veto LLD | 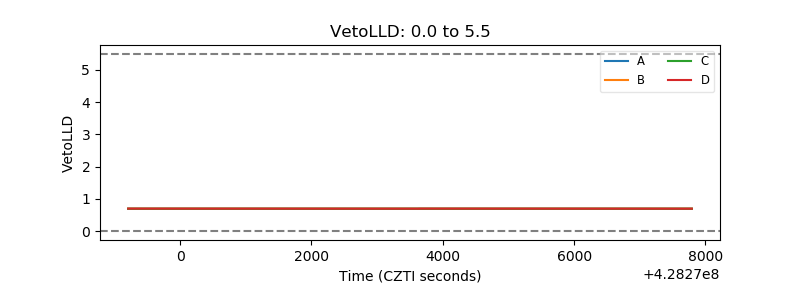 |
| Alpha Counter | 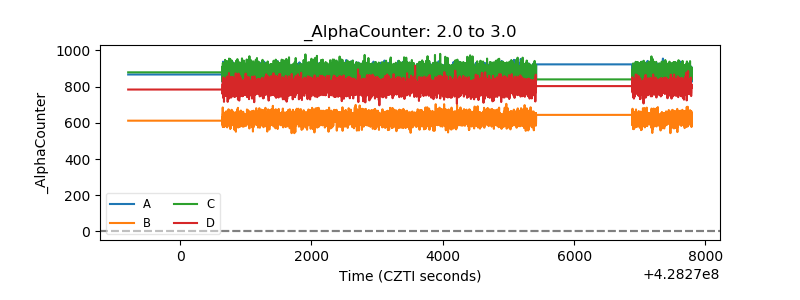 |
| _CPM_Rate | 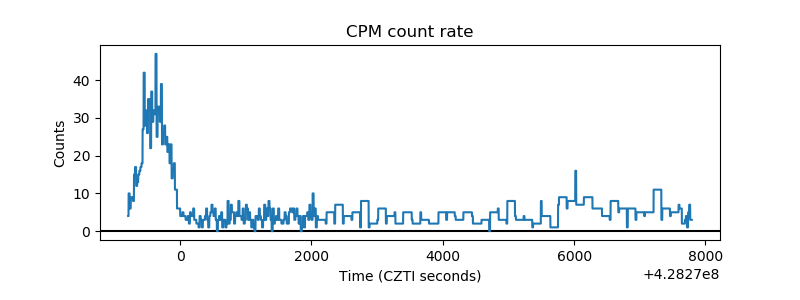 |
| CZT Counter | 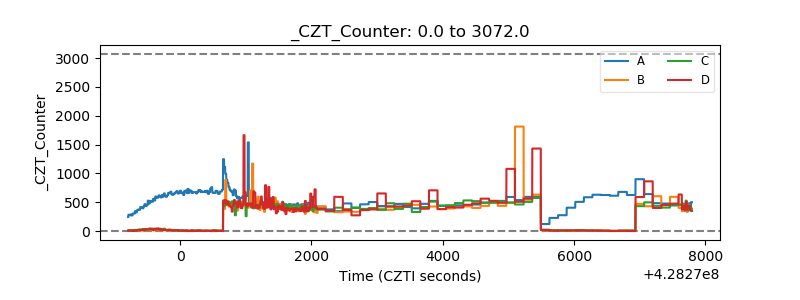 |
| +2.5 Volts monitor | 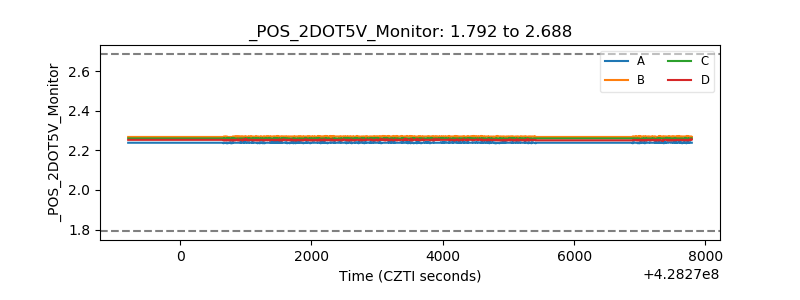 |
| +5 Volts monitor | 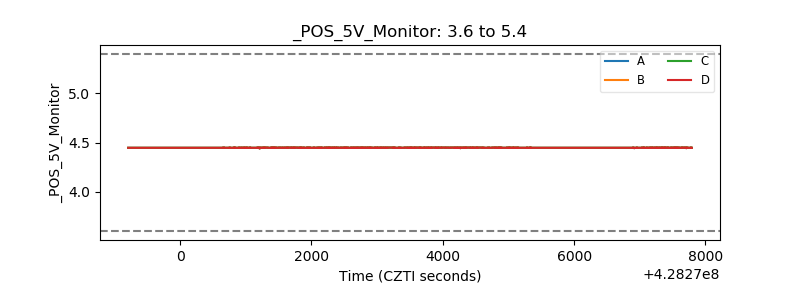 |
| _ROLL_ROT | 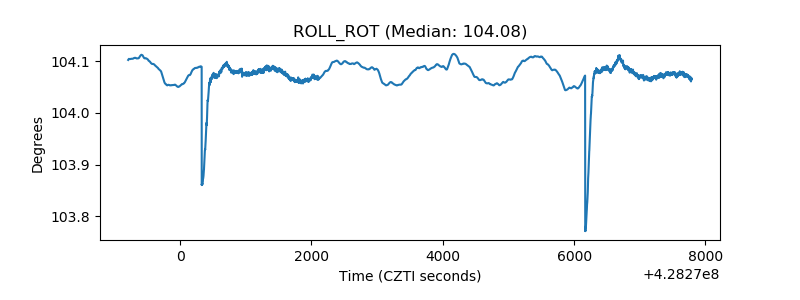 |
| _Roll_DEC | 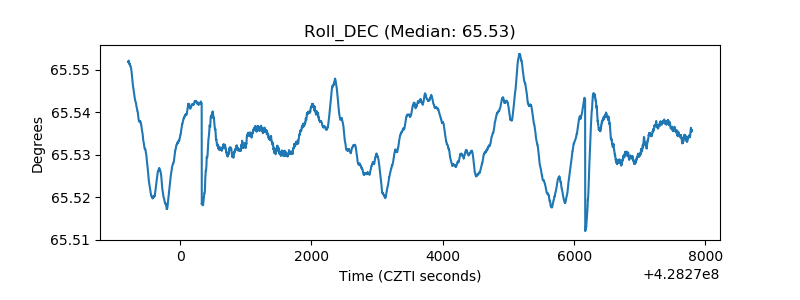 |
| _Roll_RA | 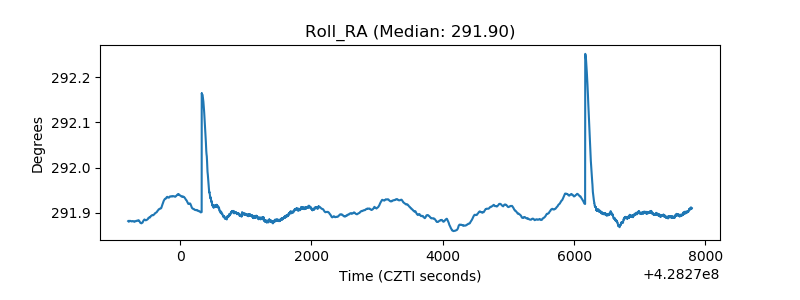 |
| Veto Counter | 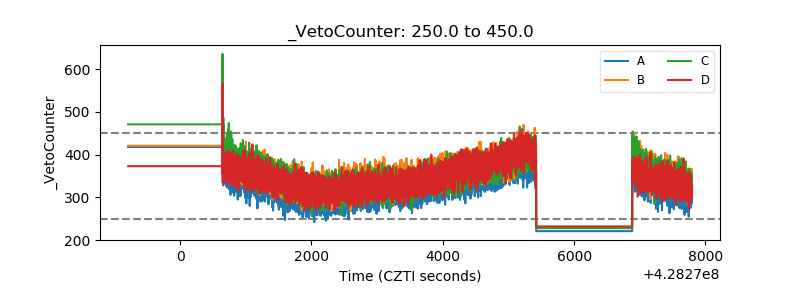 |