| Param | Original file | Final file |
|---|---|---|
| Filename | modeM0/AS1A12_102T01_9000005798_42349cztM0_level2.fits | modeM0/AS1A12_102T01_9000005798_42349cztM0_level2_quad_clean.evt |
| Size (bytes) | 341,781,120 | 96,796,800 |
| Size | 325.9 MB | 92.3 MB |
| Events in quadrant A | 3,063,283 | 644,033 |
| Events in quadrant B | 2,613,037 | 653,921 |
| Events in quadrant C | 2,722,603 | 634,481 |
| Events in quadrant D | 3,786,026 | 579,966 |
| Mode M9 | |||
|---|---|---|---|
| Quadrant | BADHDUFLAG | Total packets | Discarded packets |
| A | 0 | 27 | 0 |
| B | 0 | 27 | 0 |
| C | 0 | 27 | 0 |
| D | 0 | 27 | 0 |
| Mode SS | |||
|---|---|---|---|
| Quadrant | BADHDUFLAG | Total packets | Discarded packets |
| A | 0 | 124 | 0 |
| B | 0 | 124 | 0 |
| C | 0 | 124 | 0 |
| D | 0 | 124 | 0 |
| Mode M0 | |||
|---|---|---|---|
| Quadrant | BADHDUFLAG | Total packets | Discarded packets |
| A | 0 | 12976 | 2 |
| B | 0 | 12225 | 2 |
| C | 0 | 12178 | 2 |
| D | 0 | 15553 | 2 |
| Quadrant | Total seconds | Saturated seconds | Saturation percentage |
|---|---|---|---|
| A | 5989 | 19 | 0.317248% |
| B | 5990 | 18 | 0.300501% |
| C | 5990 | 7 | 0.116861% |
| D | 5990 | 155 | 2.587646% |
Noise dominated data is calculated using 1-second bins in cleaned event files. If a bin has >2000 counts, and if more than 50% of those come from <1% of pixels, then it is considered to be noise-dominated and hence unusable.
| Quadrant | # 1 sec bins | Bins with >0 counts | Bins with >2000 counts | High rate bins dominated by noise | Noise dominated (total time) | Noise dominated (detector-on time) | Marked lightcurve |
|---|---|---|---|---|---|---|---|
| A | 8764 | 5991 | 4 | 4 | 0.05% | 0.07% | 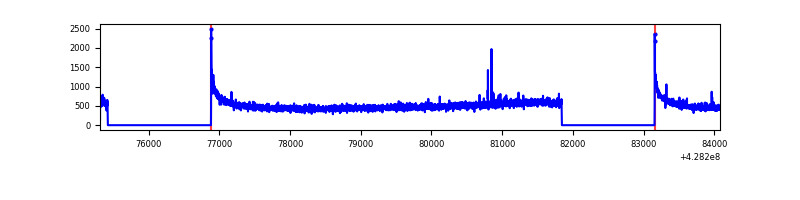 |
| B | 8765 | 5992 | 6 | 6 | 0.07% | 0.10% | 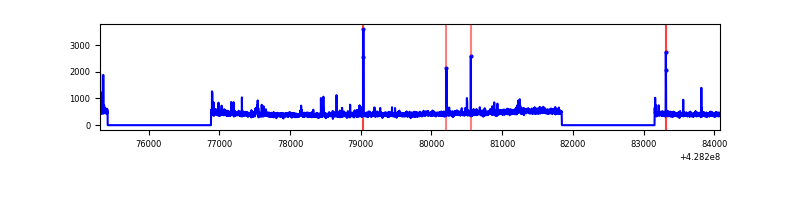 |
| C | 8765 | 5992 | 2 | 2 | 0.02% | 0.03% | 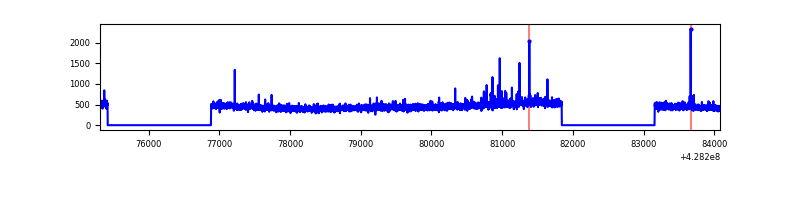 |
| D | 8765 | 5992 | 163 | 163 | 1.86% | 2.72% | 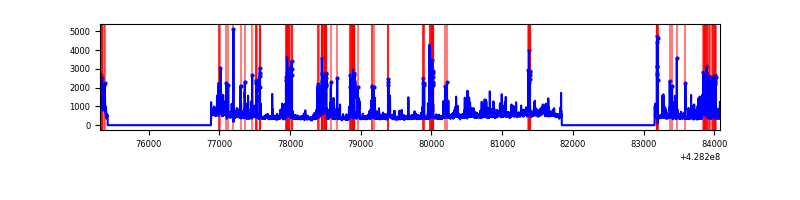 |
Top three noisy pixels from each quadrant. If the there are fewer than three noisy pixels in the level2.evt file, extra rows are filled as -1
| Pixel properties | Quadrant properties | ||||||
|---|---|---|---|---|---|---|---|
| Quadrant | DetID | PixID | Counts | Sigma | Mean | Median | Sigma |
| A | 10 | 83 | 590093 | 4526.25 | 633 | 619 | 130.2 |
| A | 13 | 248 | 11741 | 85.4 | 633 | 619 | 130.2 |
| A | 13 | 254 | 9970 | 71.8 | 633 | 619 | 130.2 |
| B | 5 | 172 | 38412 | 304.3 | 632 | 614 | 124.2 |
| B | 0 | 230 | 25749 | 202.35 | 632 | 614 | 124.2 |
| B | 5 | 255 | 23745 | 186.22 | 632 | 614 | 124.2 |
| C | 15 | 214 | 251062 | 1723.47 | 622 | 627 | 145.3 |
| C | 15 | 111 | 25793 | 173.19 | 622 | 627 | 145.3 |
| C | 5 | 128 | 9992 | 64.45 | 622 | 627 | 145.3 |
| D | 5 | 222 | 598021 | 3962.95 | 614 | 598 | 150.8 |
| D | 12 | 6 | 208904 | 1381.78 | 614 | 598 | 150.8 |
| D | 1 | 52 | 169032 | 1117.29 | 614 | 598 | 150.8 |
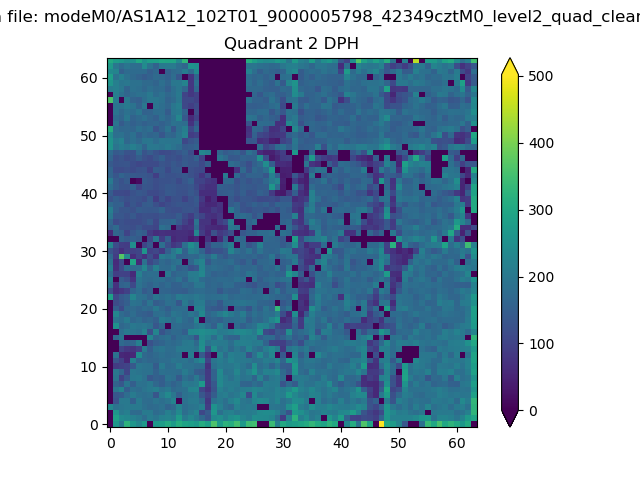
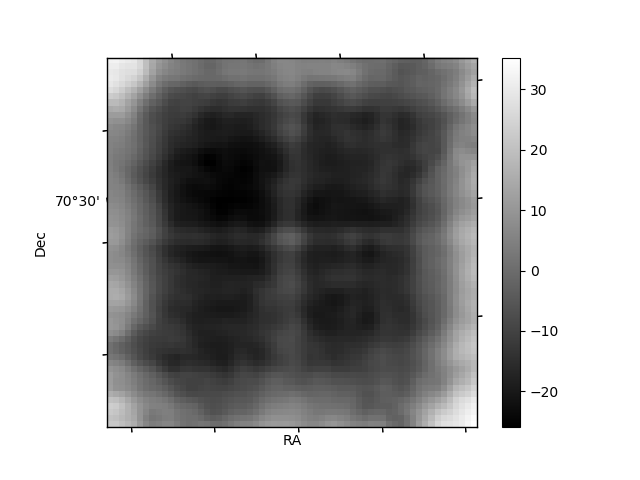
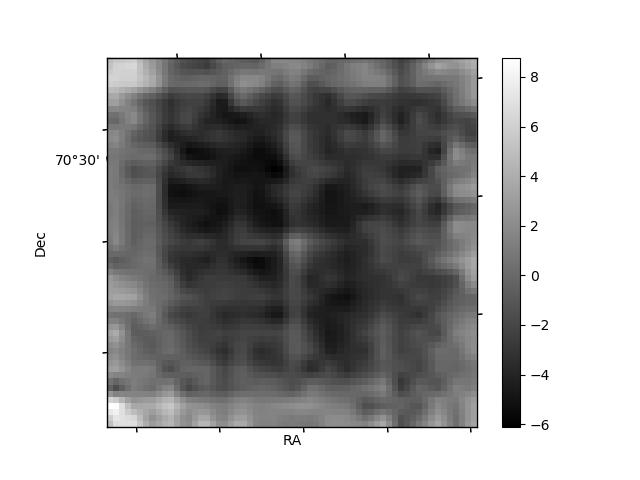
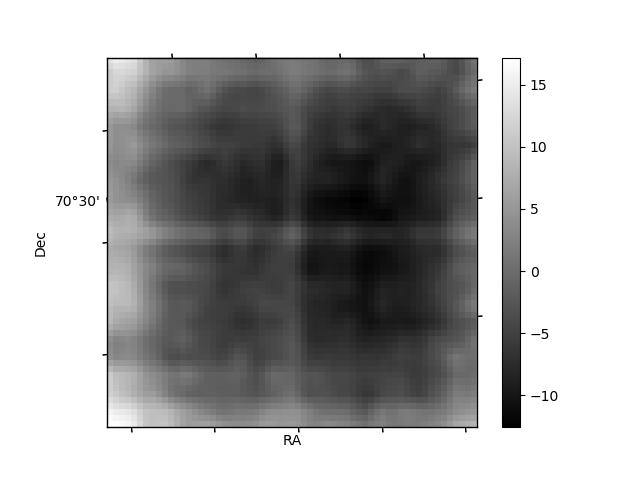
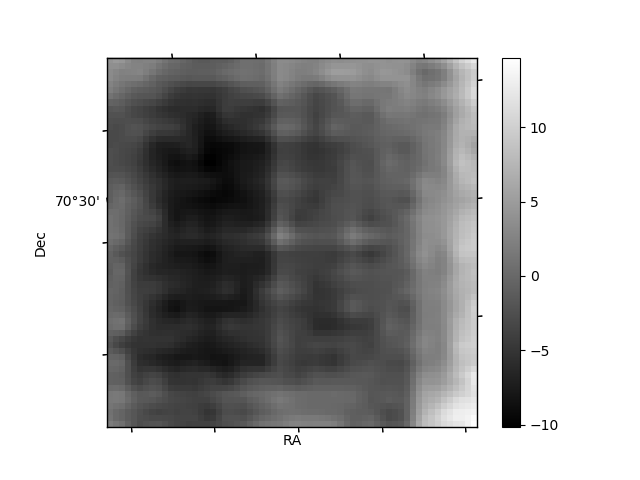
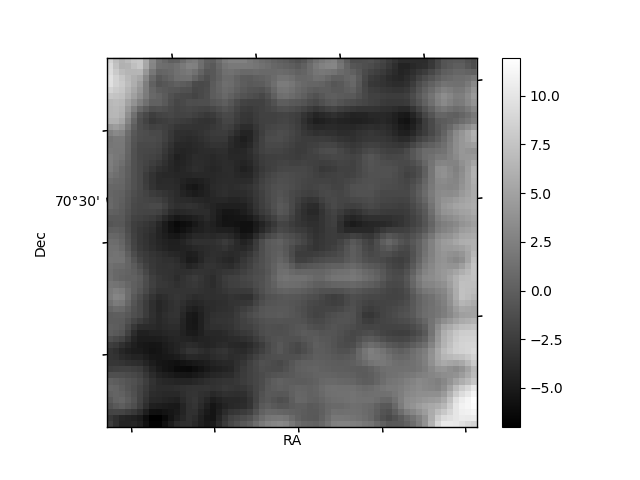
Histogram calculated using DETX and DETY for each event in the final _common_clean file
| Quadrant A | 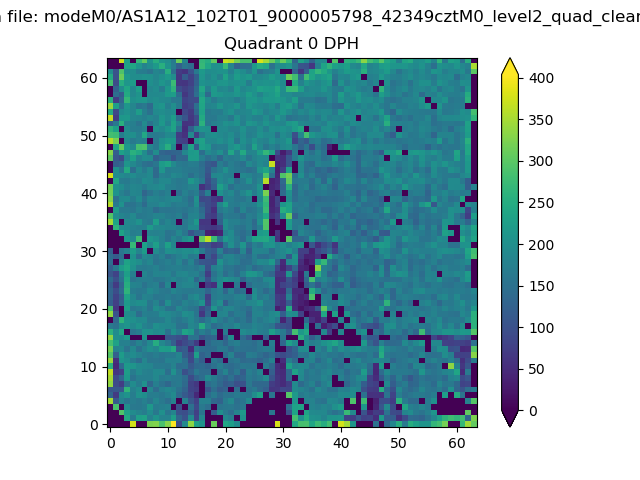 |
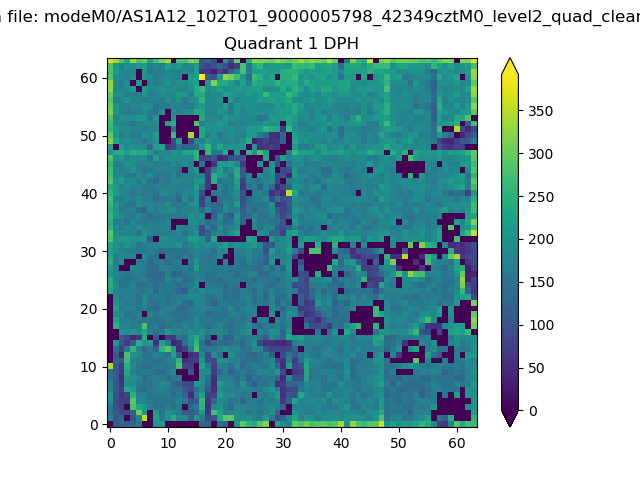 |
Quadrant B |
|---|---|---|---|
| Quadrant D | 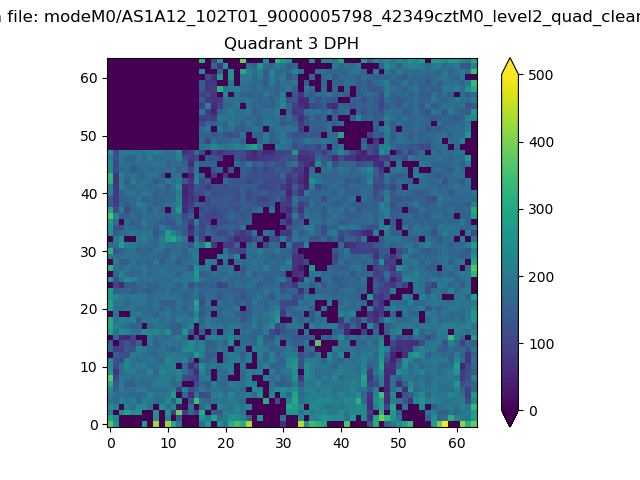 |
 |
Quadrant C |
| Plot type | Count rate plots | Images |
|---|---|---|
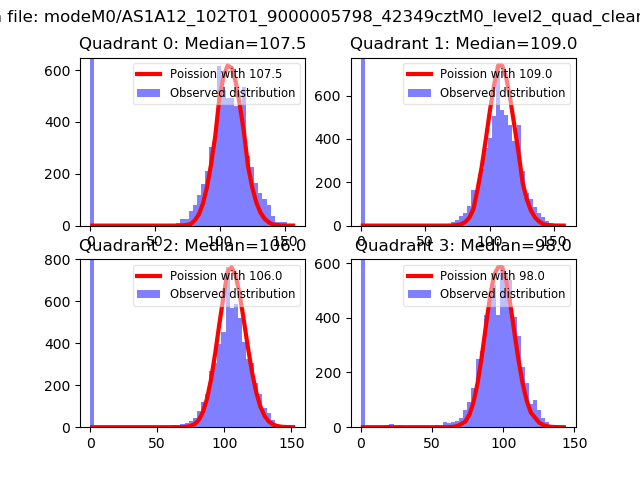
| Comparison with Poisson distribution Blue bars denote a histogram of data divided into 1 sec bins. Red curve is a Poisson curve with rate = median count rate of data. |
 |
 |
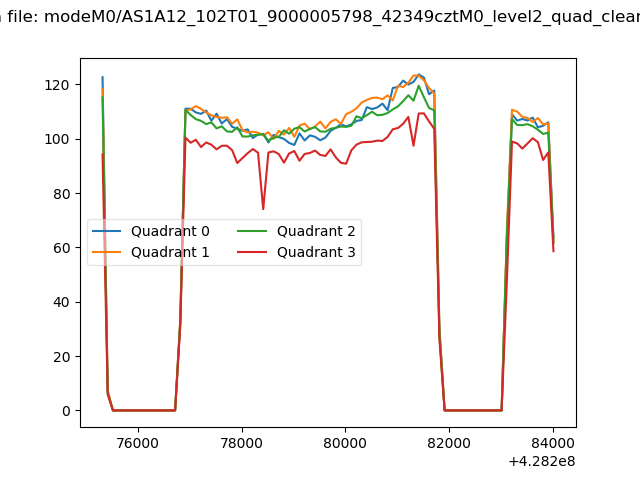
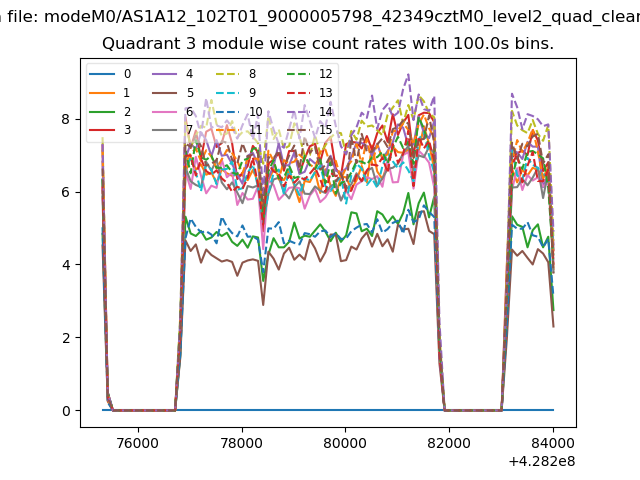
| Quadrant-wise count rates Data is divided into 100 sec bins |
 |
|
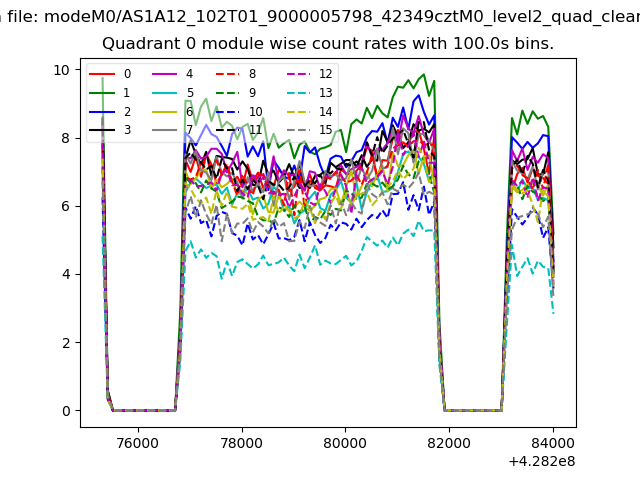
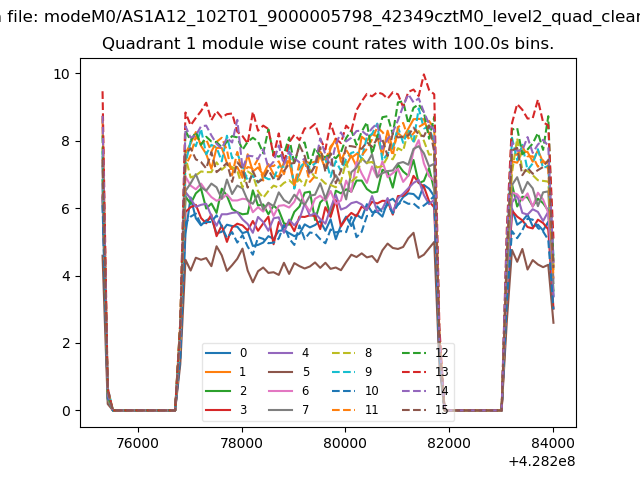
| Module-wise count rates for Quadrant A Data is divided into 100 sec bins |
 |
 |
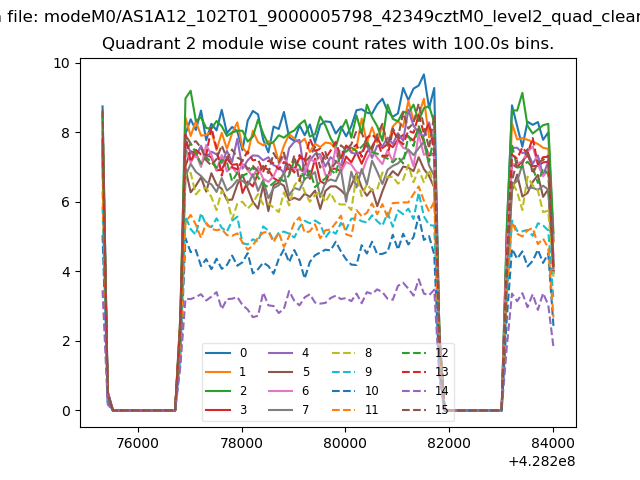
| Module-wise count rates for Quadrant B Data is divided into 100 sec bins |
 |
 |
| Module-wise count rates for Quadrant C Data is divided into 100 sec bins |
 |
 |
| Module-wise count rates for Quadrant D Data is divided into 100 sec bins |
 |
 |
| Parameter | Plot |
|---|---|
| CZT HV Monitor | 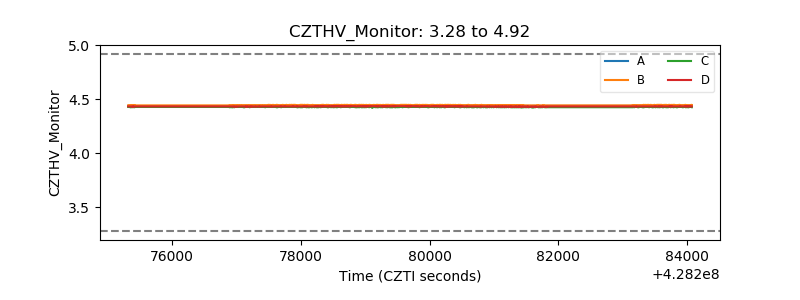 |
| D_VDD | 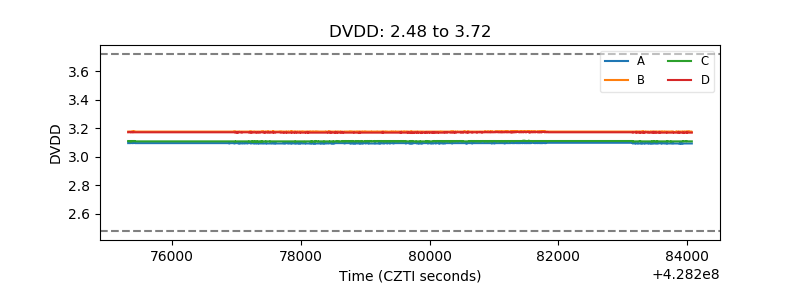 |
| Temperature 1 | 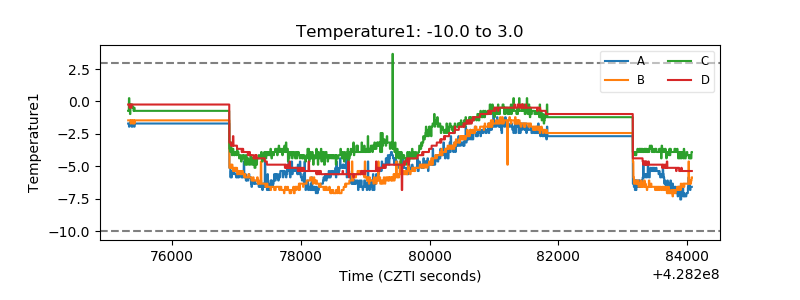 |
| Veto HV Monitor | 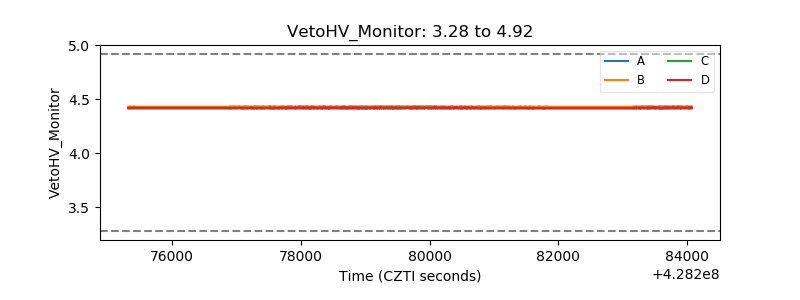 |
| Veto LLD | 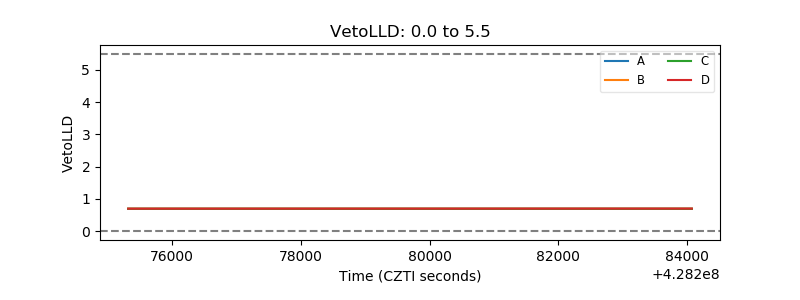 |
| Alpha Counter | 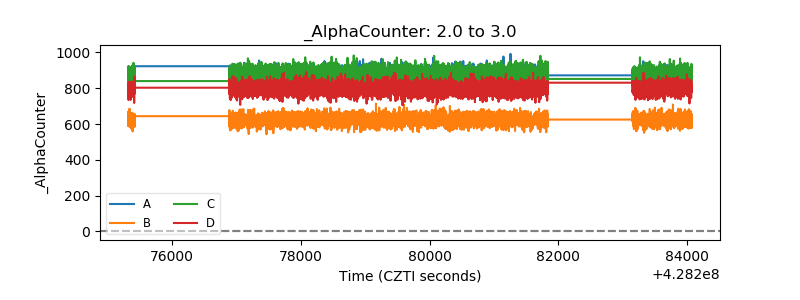 |
| _CPM_Rate | 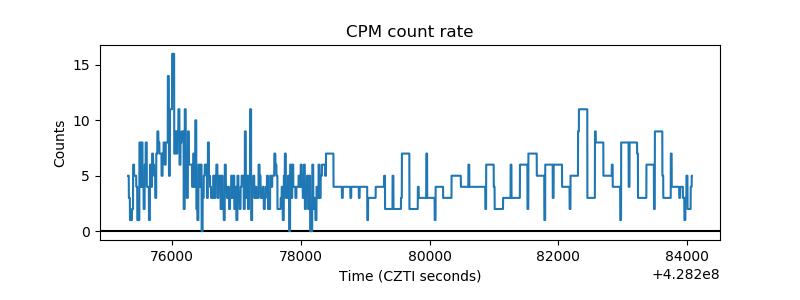 |
| CZT Counter | 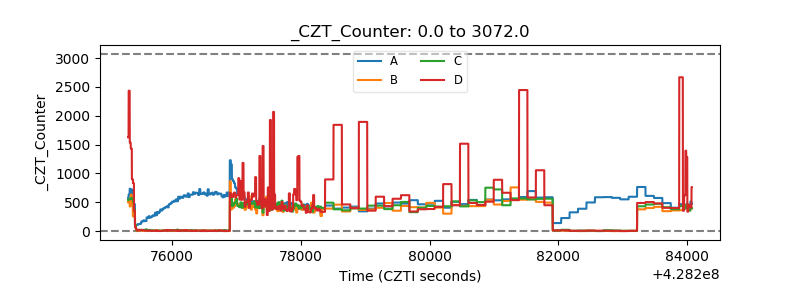 |
| +2.5 Volts monitor | 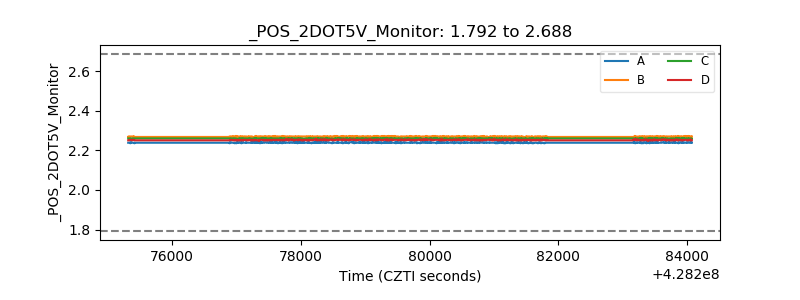 |
| +5 Volts monitor |  |
| _ROLL_ROT | 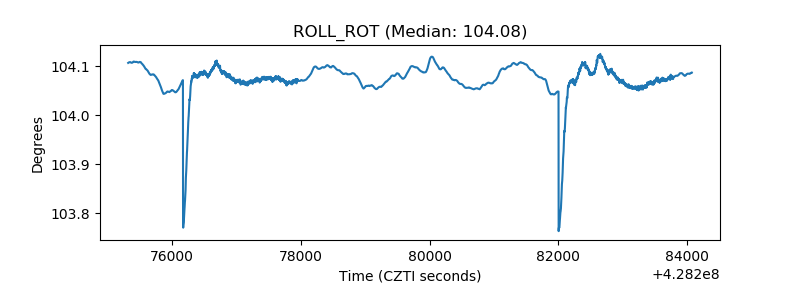 |
| _Roll_DEC | 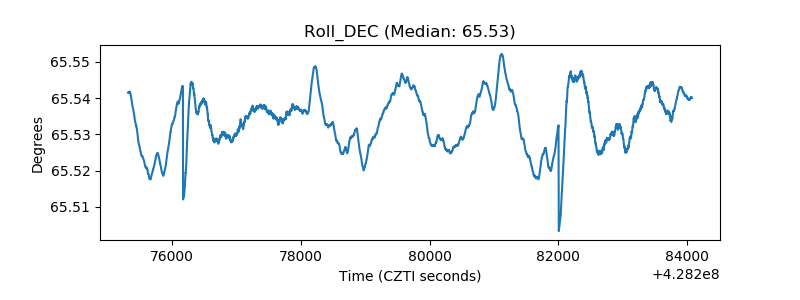 |
| _Roll_RA | 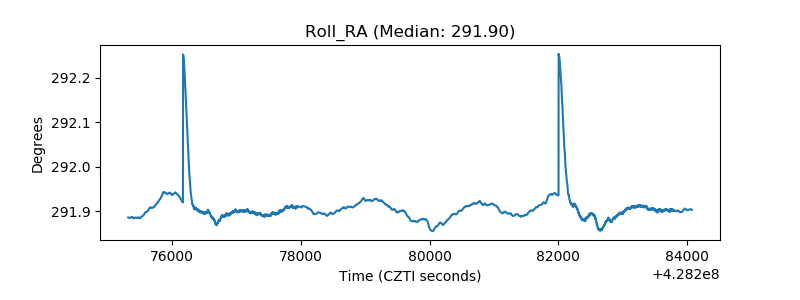 |
| Veto Counter | 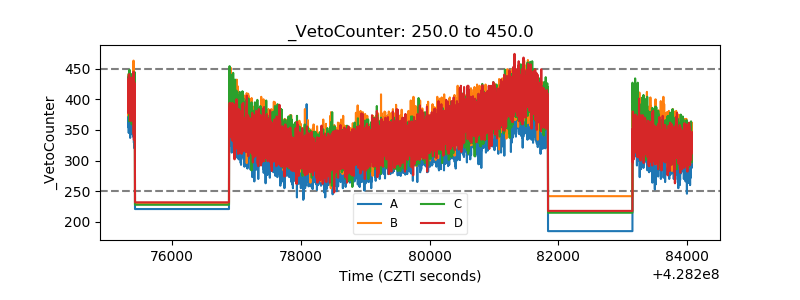 |