| Param | Original file | Final file |
|---|---|---|
| Filename | modeM0/AS1A12_102T01_9000005798_42352cztM0_level2.fits | modeM0/AS1A12_102T01_9000005798_42352cztM0_level2_quad_clean.evt |
| Size (bytes) | 912,271,680 | 254,531,520 |
| Size | 870.0 MB | 242.7 MB |
| Events in quadrant A | 8,267,392 | 1,694,931 |
| Events in quadrant B | 7,308,334 | 1,728,130 |
| Events in quadrant C | 7,360,188 | 1,682,862 |
| Events in quadrant D | 9,592,571 | 1,496,029 |
| Mode M9 | |||
|---|---|---|---|
| Quadrant | BADHDUFLAG | Total packets | Discarded packets |
| A | 0 | 54 | 0 |
| B | 0 | 54 | 0 |
| C | 0 | 54 | 0 |
| D | 0 | 54 | 0 |
| Mode SS | |||
|---|---|---|---|
| Quadrant | BADHDUFLAG | Total packets | Discarded packets |
| A | 0 | 330 | 0 |
| B | 0 | 330 | 0 |
| C | 0 | 330 | 0 |
| D | 0 | 328 | 0 |
| Mode M0 | |||
|---|---|---|---|
| Quadrant | BADHDUFLAG | Total packets | Discarded packets |
| A | 0 | 34302 | 4 |
| B | 0 | 33320 | 4 |
| C | 0 | 32435 | 4 |
| D | 0 | 39852 | 5 |
| Quadrant | Total seconds | Saturated seconds | Saturation percentage |
|---|---|---|---|
| A | 16005 | 31 | 0.193689% |
| B | 16005 | 92 | 0.574820% |
| C | 16005 | 16 | 0.099969% |
| D | 16005 | 449 | 2.805373% |
Noise dominated data is calculated using 1-second bins in cleaned event files. If a bin has >2000 counts, and if more than 50% of those come from <1% of pixels, then it is considered to be noise-dominated and hence unusable.
| Quadrant | # 1 sec bins | Bins with >0 counts | Bins with >2000 counts | High rate bins dominated by noise | Noise dominated (total time) | Noise dominated (detector-on time) | Marked lightcurve |
|---|---|---|---|---|---|---|---|
| A | 21495 | 16009 | 9 | 9 | 0.04% | 0.06% | 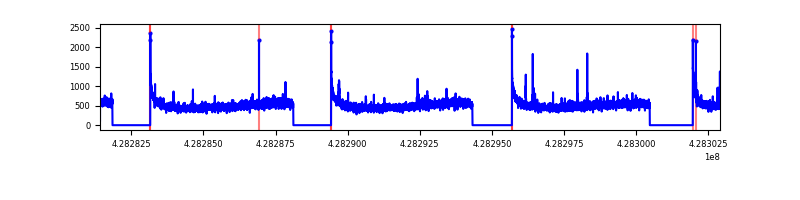 |
| B | 21495 | 16009 | 42 | 42 | 0.20% | 0.26% | 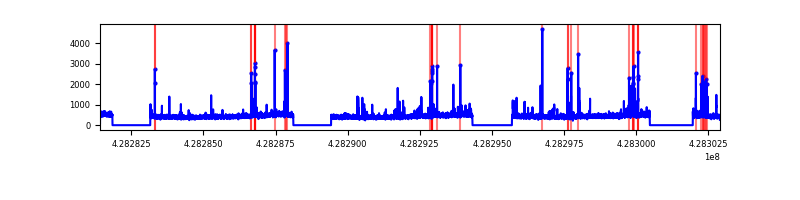 |
| C | 21495 | 16009 | 5 | 5 | 0.02% | 0.03% | 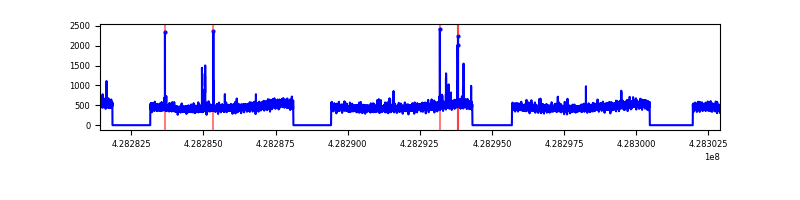 |
| D | 21495 | 16009 | 419 | 419 | 1.95% | 2.62% | 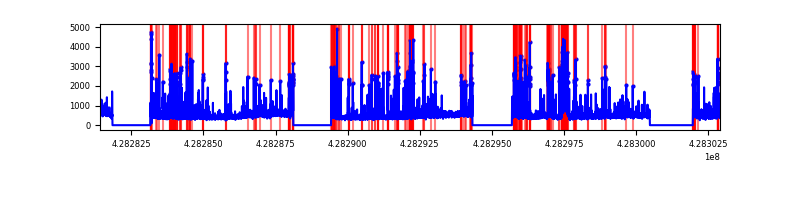 |
Top three noisy pixels from each quadrant. If the there are fewer than three noisy pixels in the level2.evt file, extra rows are filled as -1
| Pixel properties | Quadrant properties | ||||||
|---|---|---|---|---|---|---|---|
| Quadrant | DetID | PixID | Counts | Sigma | Mean | Median | Sigma |
| A | 10 | 83 | 1466537 | 4172.7 | 1733 | 1695 | 351.1 |
| A | 7 | 3 | 45430 | 124.58 | 1733 | 1695 | 351.1 |
| A | 13 | 248 | 27548 | 73.64 | 1733 | 1695 | 351.1 |
| B | 4 | 81 | 188938 | 572.18 | 1714 | 1662 | 327.3 |
| B | 5 | 172 | 150559 | 454.92 | 1714 | 1662 | 327.3 |
| B | 3 | 112 | 80491 | 240.85 | 1714 | 1662 | 327.3 |
| C | 15 | 214 | 658672 | 1673.97 | 1692 | 1698 | 392.5 |
| C | 15 | 111 | 69031 | 171.56 | 1692 | 1698 | 392.5 |
| C | 7 | 247 | 25471 | 60.57 | 1692 | 1698 | 392.5 |
| D | 5 | 222 | 1069061 | 2619.71 | 1677 | 1626 | 407.5 |
| D | 12 | 6 | 779749 | 1909.67 | 1677 | 1626 | 407.5 |
| D | 1 | 52 | 412373 | 1008.06 | 1677 | 1626 | 407.5 |
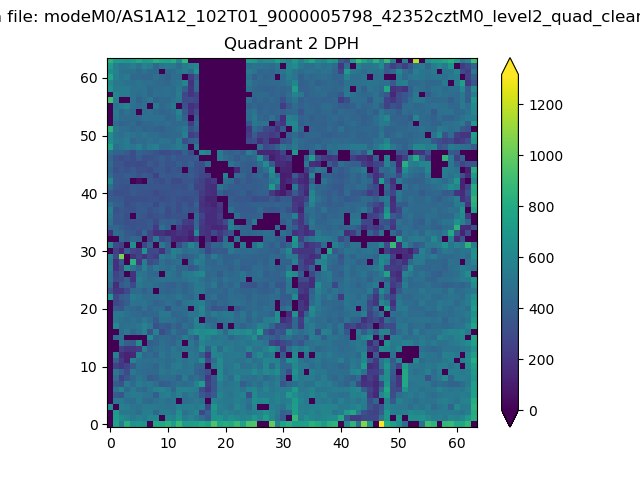
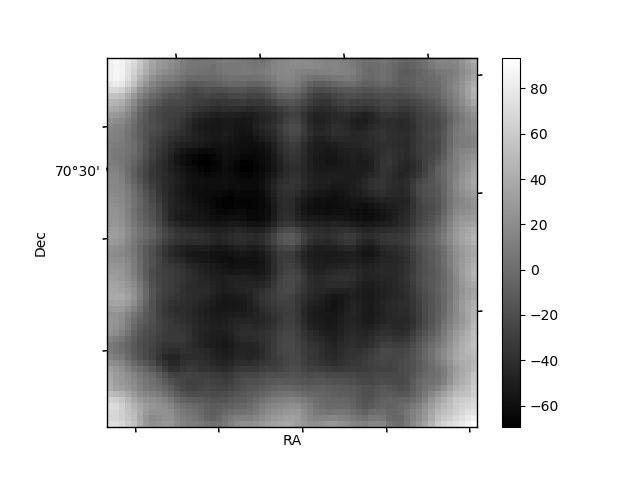
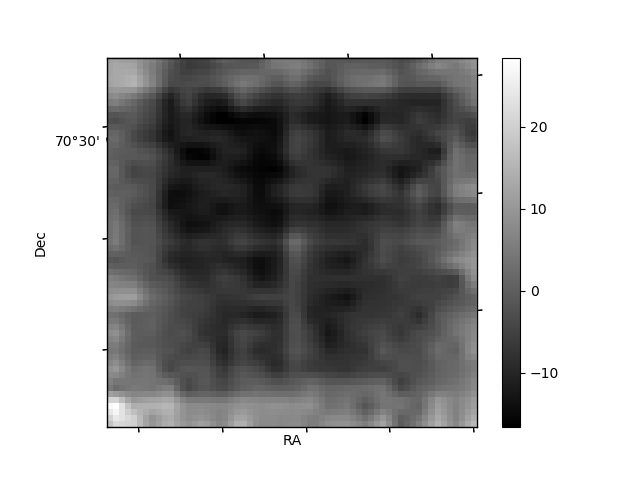
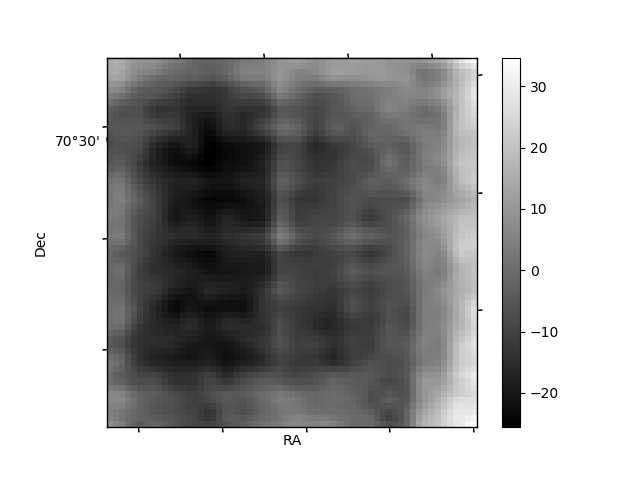
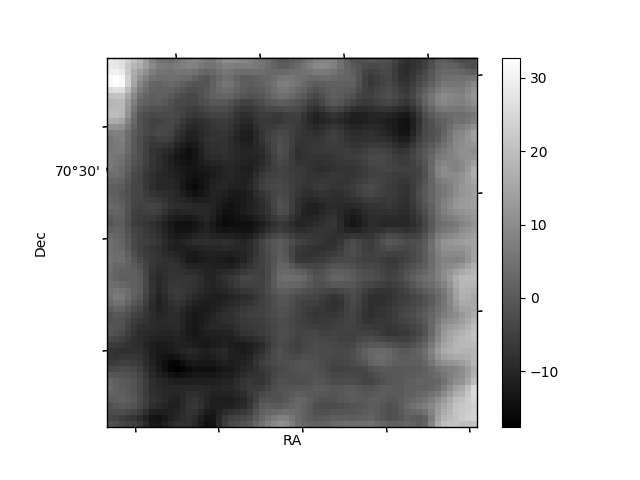
Histogram calculated using DETX and DETY for each event in the final _common_clean file
| Quadrant A | 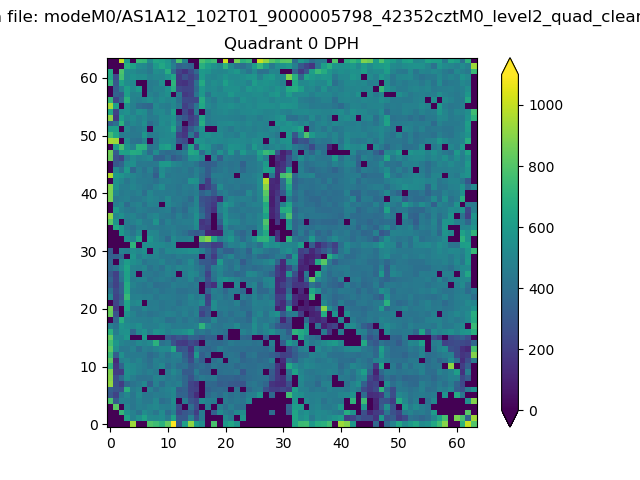 |
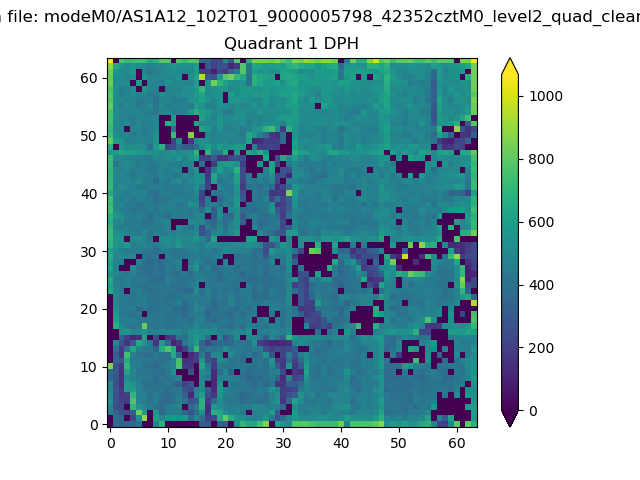 |
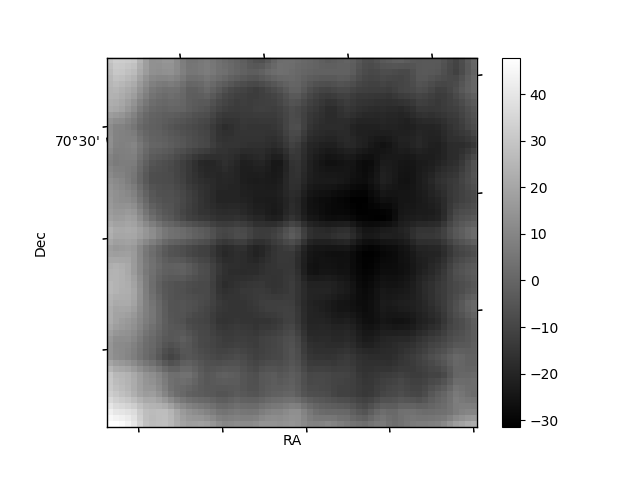
Quadrant B |
|---|---|---|---|
| Quadrant D | 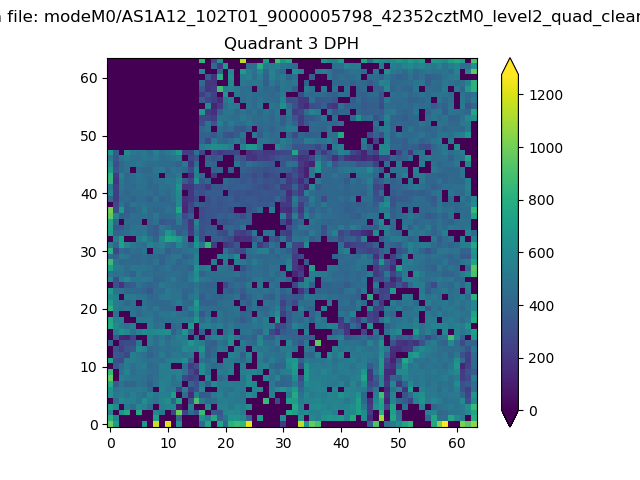 |
 |
Quadrant C |
| Plot type | Count rate plots | Images |
|---|---|---|
| Comparison with Poisson distribution Blue bars denote a histogram of data divided into 1 sec bins. Red curve is a Poisson curve with rate = median count rate of data. |
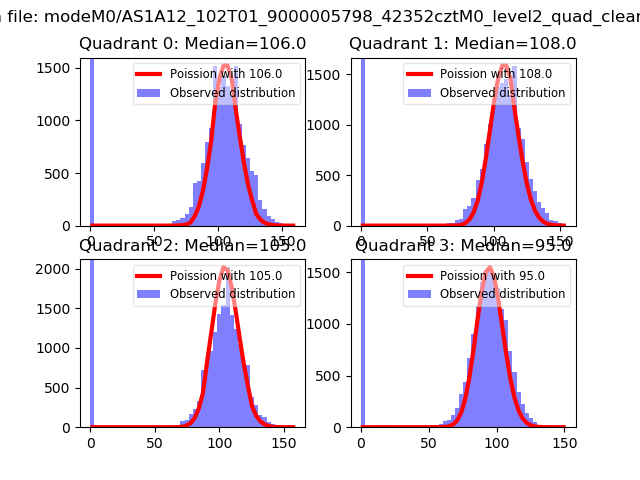 |
 |
| Quadrant-wise count rates Data is divided into 100 sec bins |
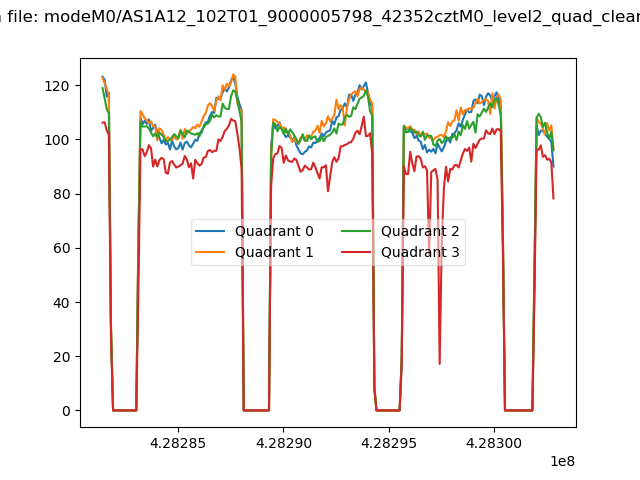 |
|
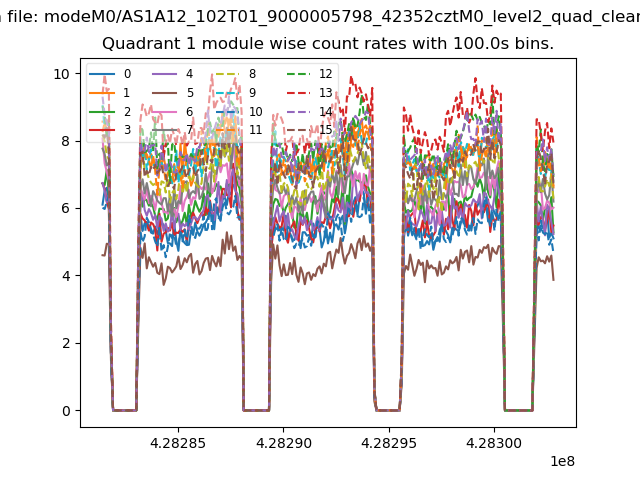
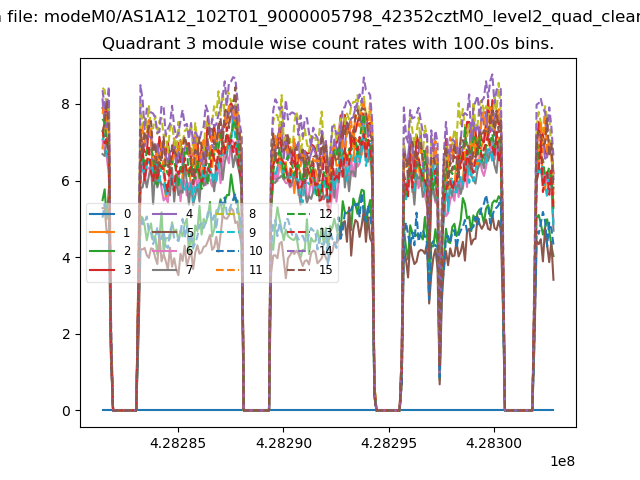
| Module-wise count rates for Quadrant A Data is divided into 100 sec bins |
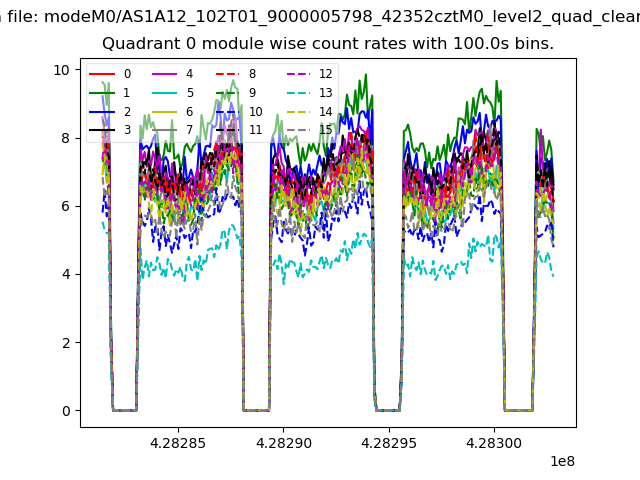 |
 |
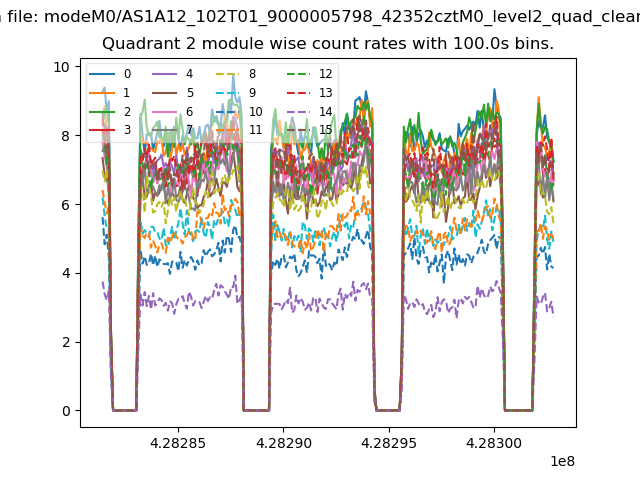
| Module-wise count rates for Quadrant B Data is divided into 100 sec bins |
 |
 |
| Module-wise count rates for Quadrant C Data is divided into 100 sec bins |
 |
 |
| Module-wise count rates for Quadrant D Data is divided into 100 sec bins |
 |
 |
| Parameter | Plot |
|---|---|
| CZT HV Monitor | 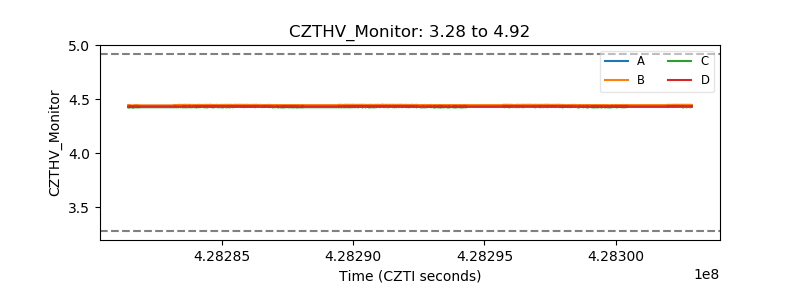 |
| D_VDD | 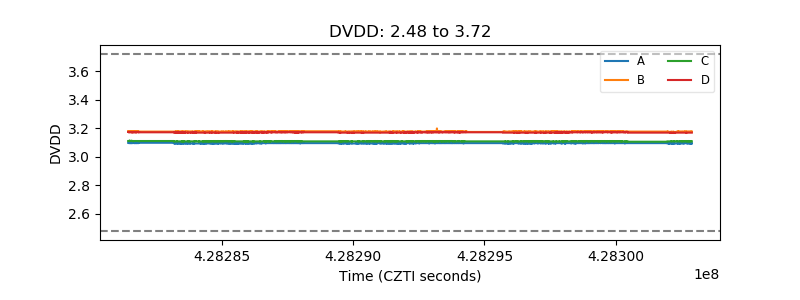 |
| Temperature 1 | 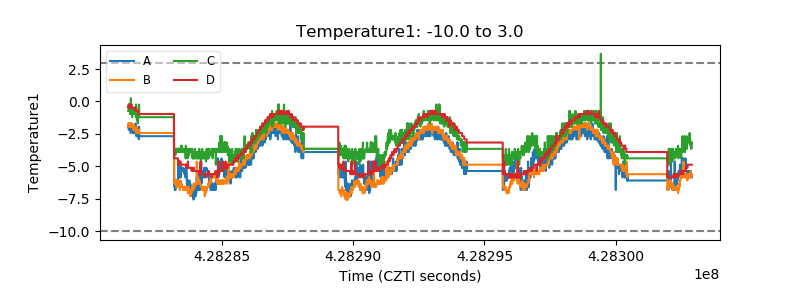 |
| Veto HV Monitor | 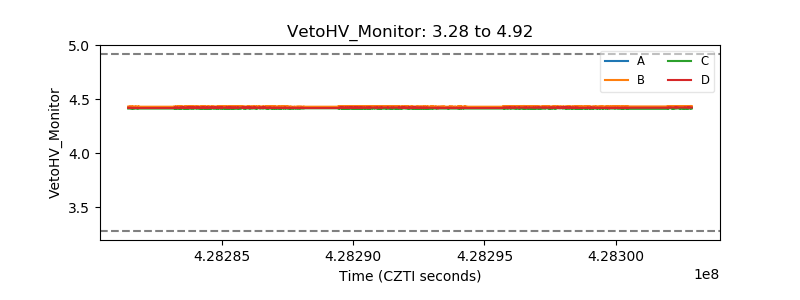 |
| Veto LLD | 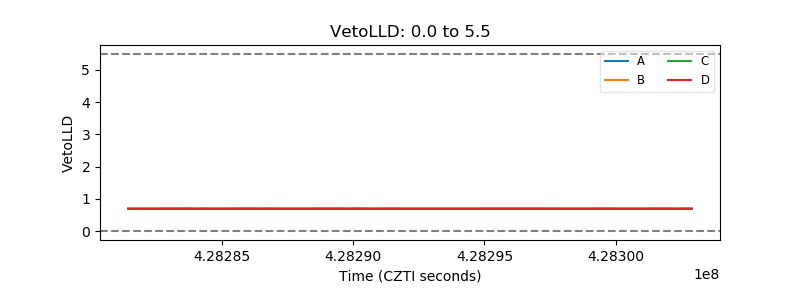 |
| Alpha Counter | 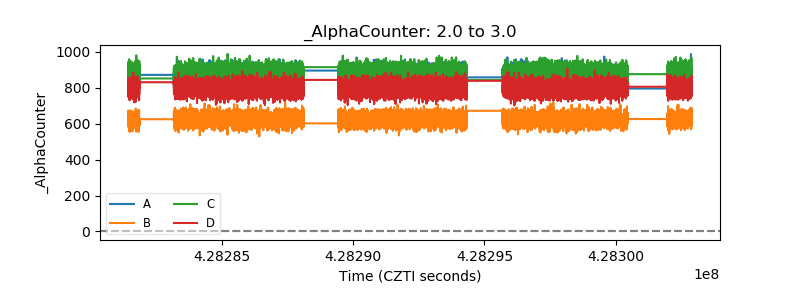 |
| _CPM_Rate | 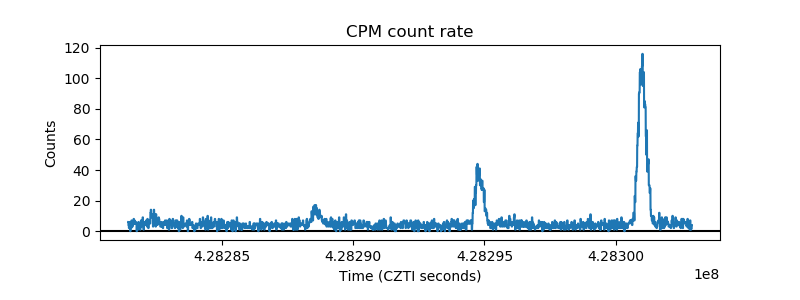 |
| CZT Counter | 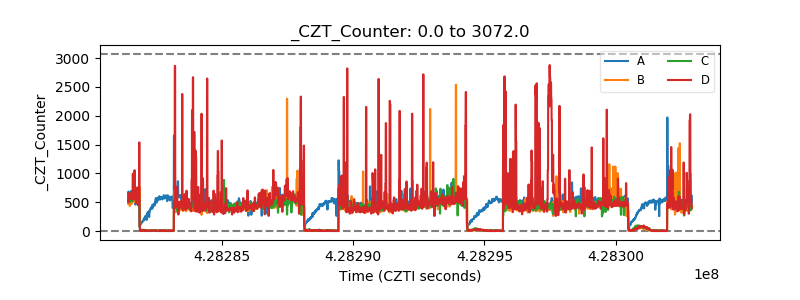 |
| +2.5 Volts monitor | 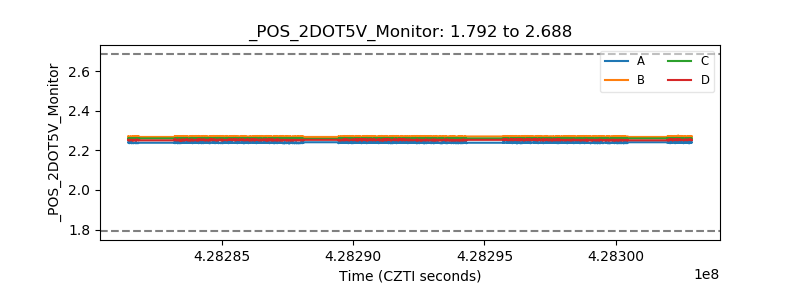 |
| +5 Volts monitor | 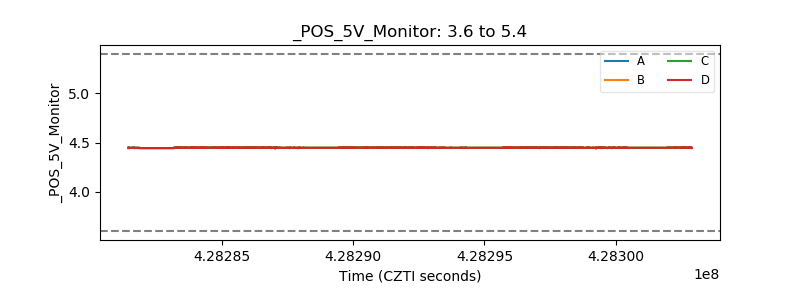 |
| _ROLL_ROT | 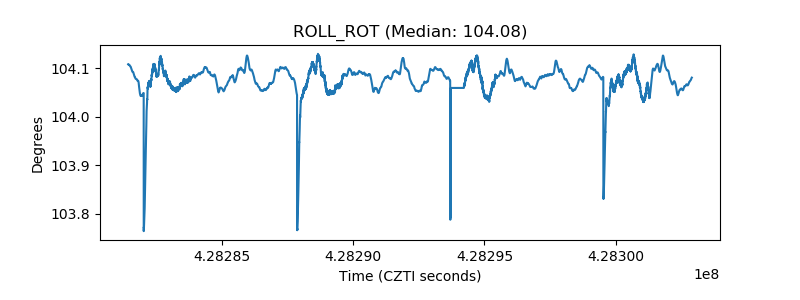 |
| _Roll_DEC | 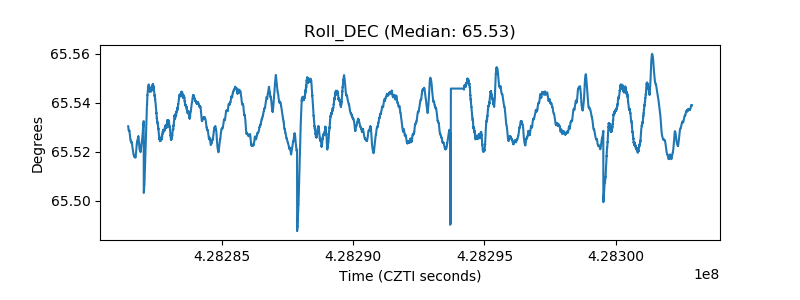 |
| _Roll_RA | 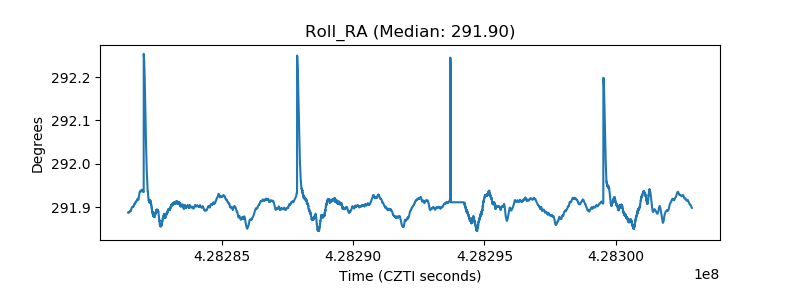 |
| Veto Counter | 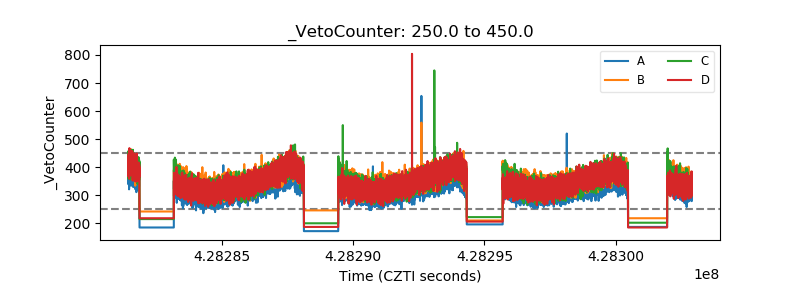 |