| Param | Original file | Final file |
|---|---|---|
| Filename | modeM0/AS1A12_102T01_9000005798_42354cztM0_level2.fits | modeM0/AS1A12_102T01_9000005798_42354cztM0_level2_quad_clean.evt |
| Size (bytes) | 318,188,160 | 89,222,400 |
| Size | 303.4 MB | 85.1 MB |
| Events in quadrant A | 2,896,903 | 596,634 |
| Events in quadrant B | 2,551,309 | 610,842 |
| Events in quadrant C | 2,492,798 | 585,343 |
| Events in quadrant D | 3,412,652 | 527,275 |
| Mode M9 | |||
|---|---|---|---|
| Quadrant | BADHDUFLAG | Total packets | Discarded packets |
| A | 0 | 18 | 0 |
| B | 0 | 19 | 0 |
| C | 0 | 19 | 0 |
| D | 0 | 19 | 0 |
| Mode SS | |||
|---|---|---|---|
| Quadrant | BADHDUFLAG | Total packets | Discarded packets |
| A | 0 | 112 | 0 |
| B | 0 | 112 | 0 |
| C | 0 | 112 | 0 |
| D | 0 | 112 | 0 |
| Mode M0 | |||
|---|---|---|---|
| Quadrant | BADHDUFLAG | Total packets | Discarded packets |
| A | 0 | 11826 | 2 |
| B | 0 | 11418 | 2 |
| C | 0 | 10930 | 2 |
| D | 0 | 13922 | 2 |
| Quadrant | Total seconds | Saturated seconds | Saturation percentage |
|---|---|---|---|
| A | 5448 | 9 | 0.165198% |
| B | 5448 | 36 | 0.660793% |
| C | 5448 | 2 | 0.036711% |
| D | 5448 | 198 | 3.634361% |
Noise dominated data is calculated using 1-second bins in cleaned event files. If a bin has >2000 counts, and if more than 50% of those come from <1% of pixels, then it is considered to be noise-dominated and hence unusable.
| Quadrant | # 1 sec bins | Bins with >0 counts | Bins with >2000 counts | High rate bins dominated by noise | Noise dominated (total time) | Noise dominated (detector-on time) | Marked lightcurve |
|---|---|---|---|---|---|---|---|
| A | 7180 | 5449 | 3 | 3 | 0.04% | 0.06% | 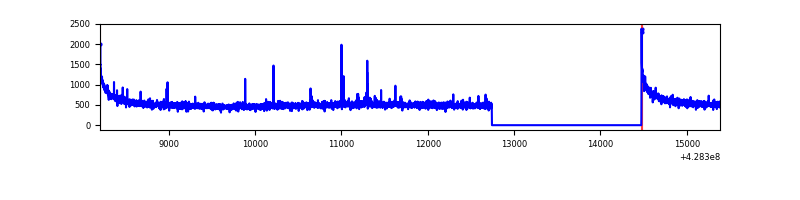 |
| B | 7180 | 5449 | 19 | 19 | 0.26% | 0.35% | 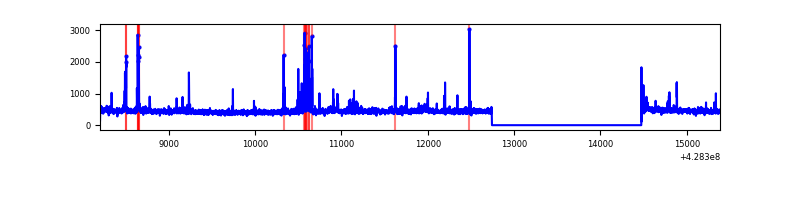 |
| C | 7180 | 5449 | 0 | 0 | 0.00% | 0.00% | 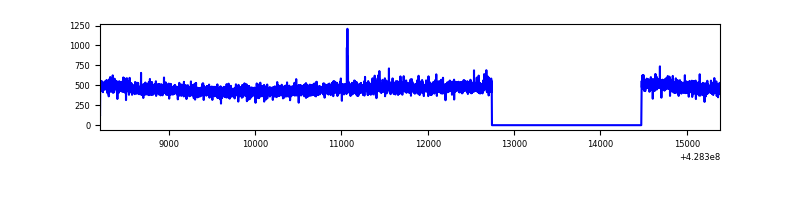 |
| D | 7180 | 5449 | 160 | 160 | 2.23% | 2.94% | 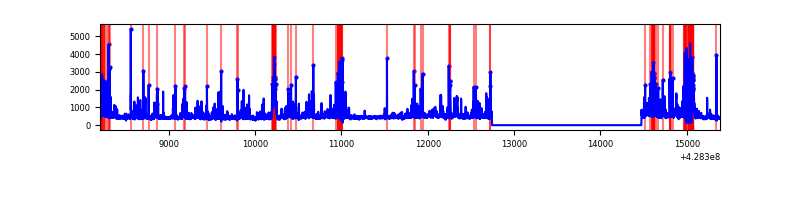 |
Top three noisy pixels from each quadrant. If the there are fewer than three noisy pixels in the level2.evt file, extra rows are filled as -1
| Pixel properties | Quadrant properties | ||||||
|---|---|---|---|---|---|---|---|
| Quadrant | DetID | PixID | Counts | Sigma | Mean | Median | Sigma |
| A | 10 | 83 | 552467 | 4475.94 | 597 | 583 | 123.3 |
| A | 13 | 248 | 24781 | 196.25 | 597 | 583 | 123.3 |
| A | 7 | 3 | 10798 | 82.84 | 597 | 583 | 123.3 |
| B | 3 | 112 | 104732 | 907.73 | 590 | 574 | 114.7 |
| B | 5 | 172 | 76165 | 658.77 | 590 | 574 | 114.7 |
| B | 5 | 255 | 16053 | 134.9 | 590 | 574 | 114.7 |
| C | 15 | 214 | 228682 | 1681.2 | 579 | 582 | 135.7 |
| C | 7 | 247 | 6807 | 45.88 | 579 | 582 | 135.7 |
| C | 15 | 111 | 4397 | 28.12 | 579 | 582 | 135.7 |
| D | 13 | 249 | 282097 | 1998.71 | 573 | 558 | 140.9 |
| D | 1 | 52 | 250812 | 1776.61 | 573 | 558 | 140.9 |
| D | 12 | 6 | 214896 | 1521.63 | 573 | 558 | 140.9 |
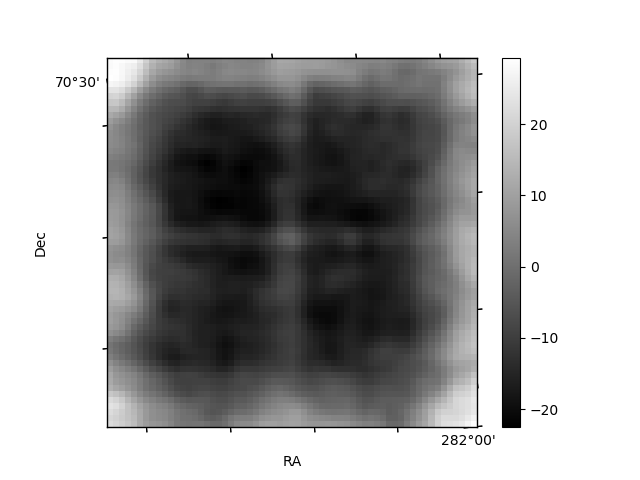
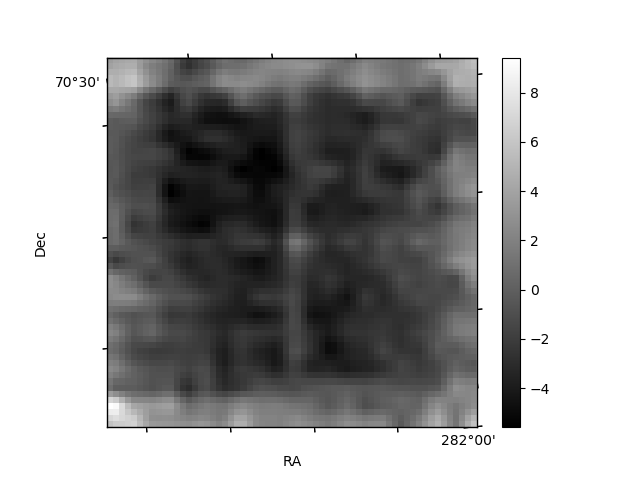
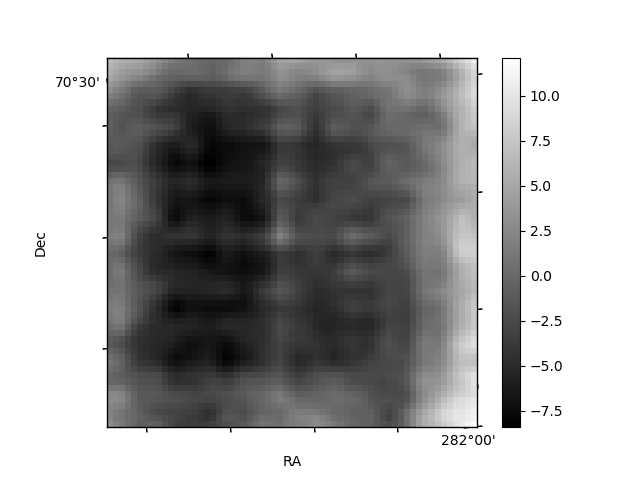
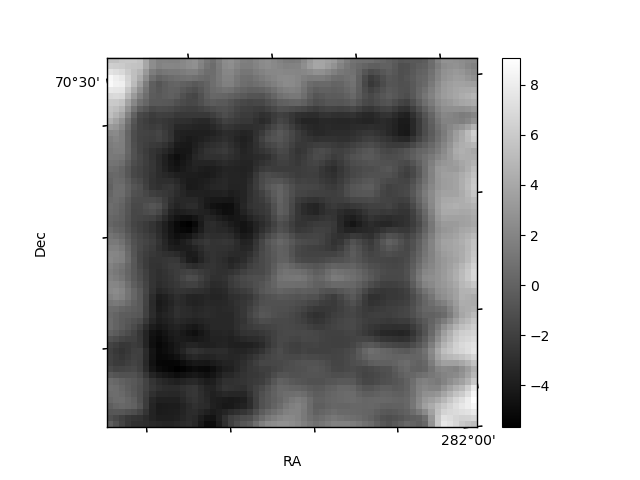
Histogram calculated using DETX and DETY for each event in the final _common_clean file
| Quadrant A | 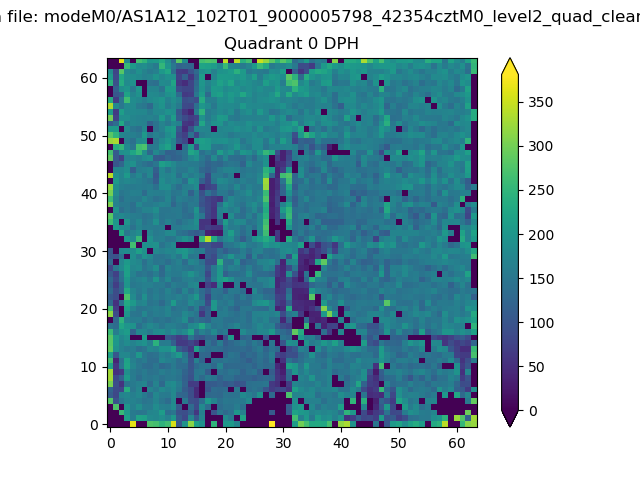 |
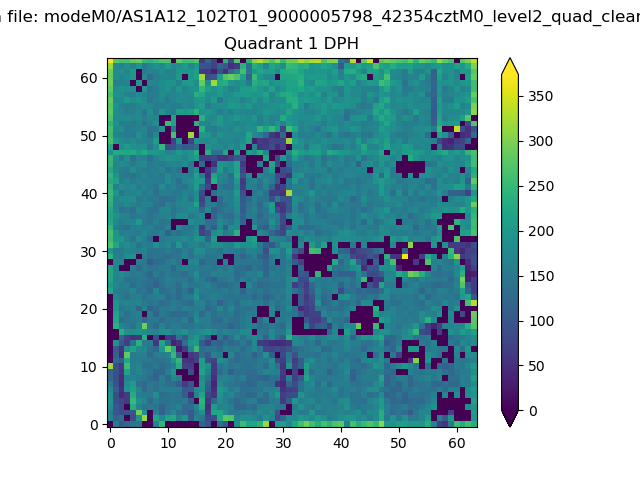 |
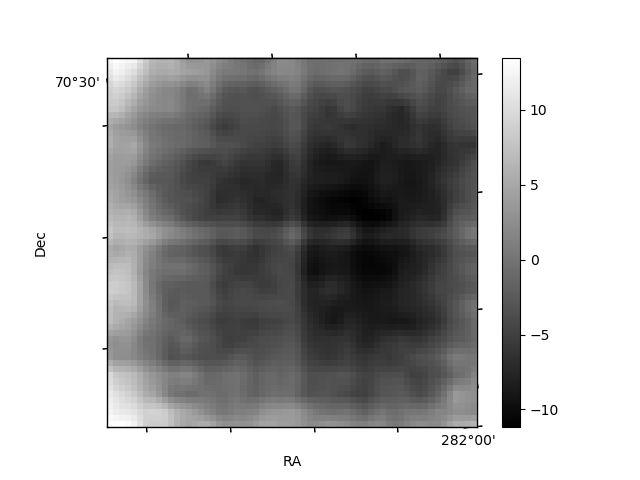
Quadrant B |
|---|---|---|---|
| Quadrant D | 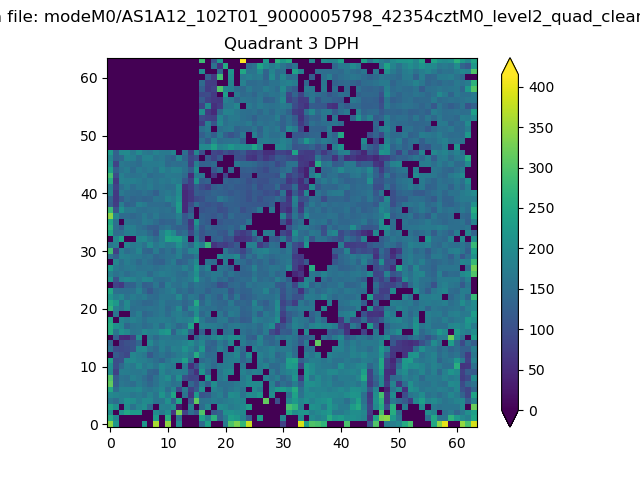 |
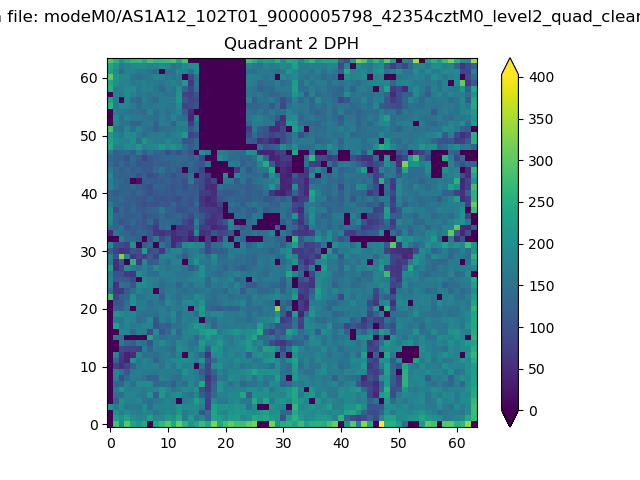 |
Quadrant C |
| Plot type | Count rate plots | Images |
|---|---|---|
| Comparison with Poisson distribution Blue bars denote a histogram of data divided into 1 sec bins. Red curve is a Poisson curve with rate = median count rate of data. |
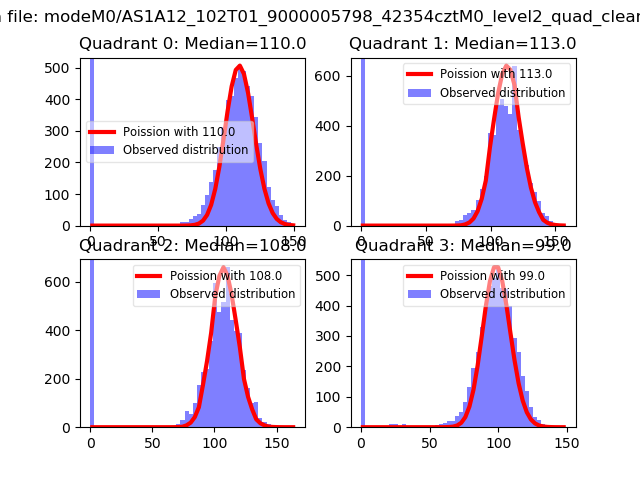 |
 |
| Quadrant-wise count rates Data is divided into 100 sec bins |
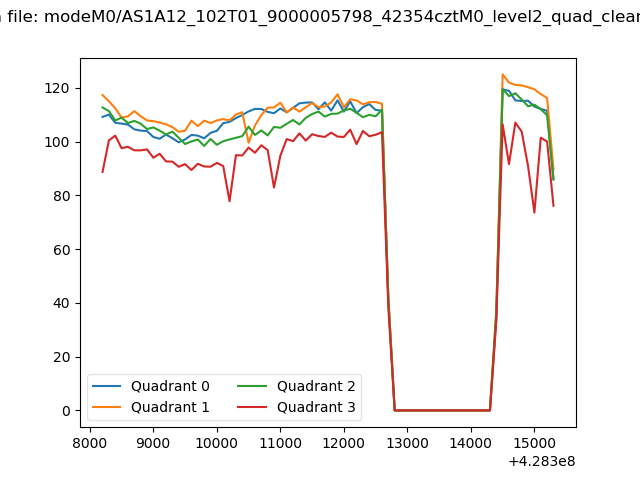 |
|
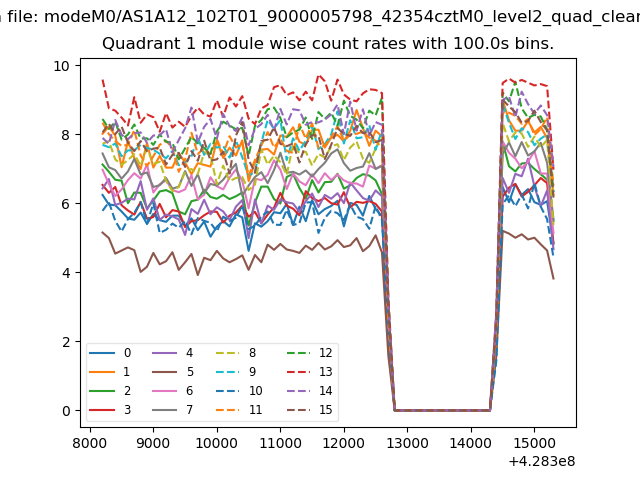
| Module-wise count rates for Quadrant A Data is divided into 100 sec bins |
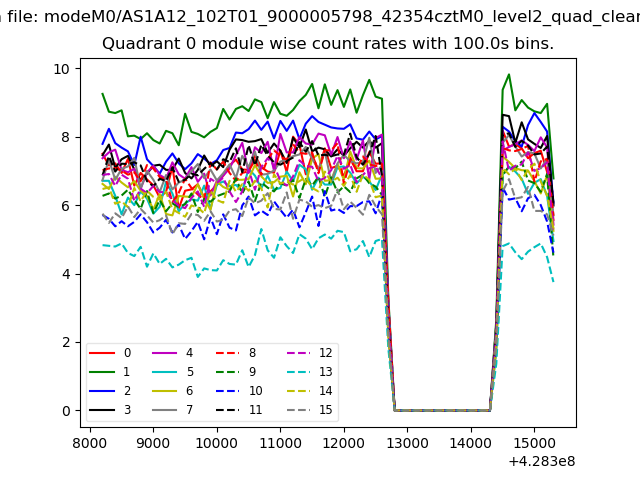 |
 |
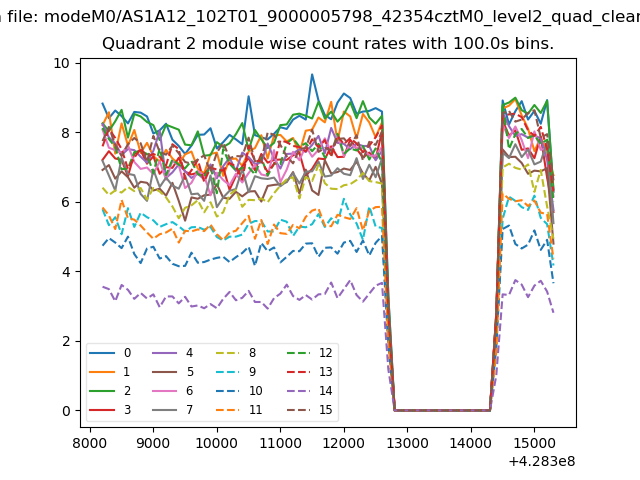
| Module-wise count rates for Quadrant B Data is divided into 100 sec bins |
 |
 |
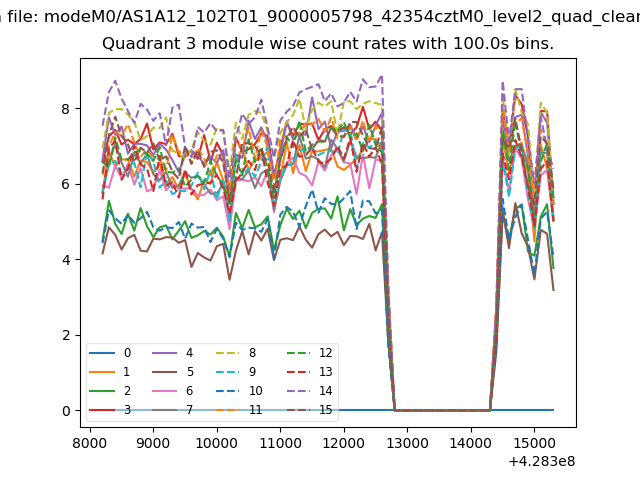
| Module-wise count rates for Quadrant C Data is divided into 100 sec bins |
 |
 |
| Module-wise count rates for Quadrant D Data is divided into 100 sec bins |
 |
 |
| Parameter | Plot |
|---|---|
| CZT HV Monitor | 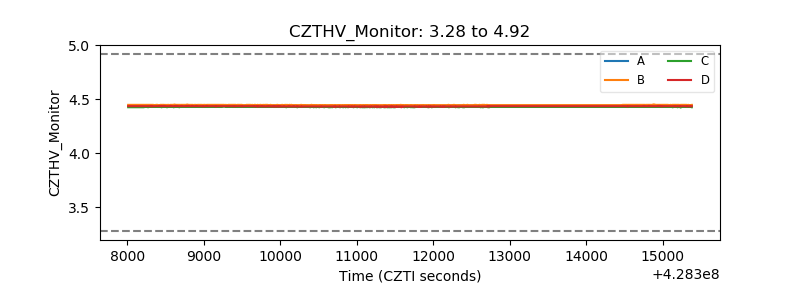 |
| D_VDD | 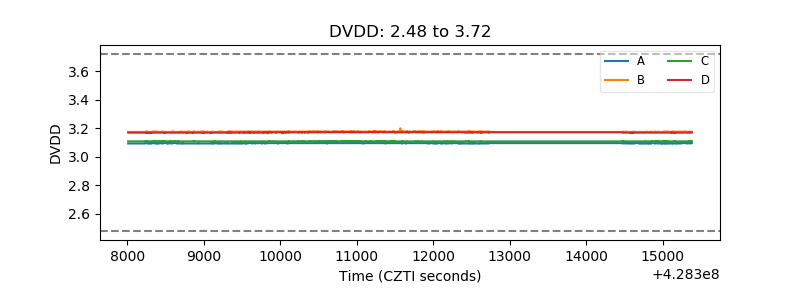 |
| Temperature 1 | 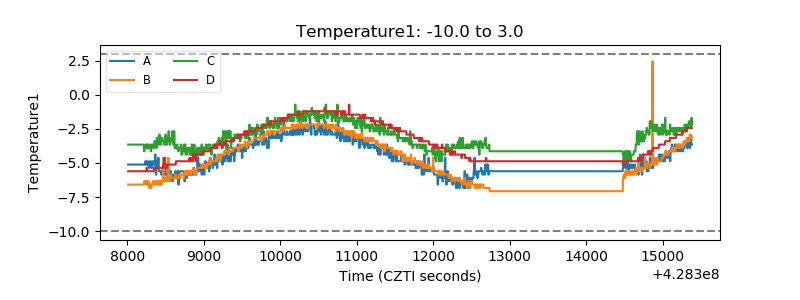 |
| Veto HV Monitor | 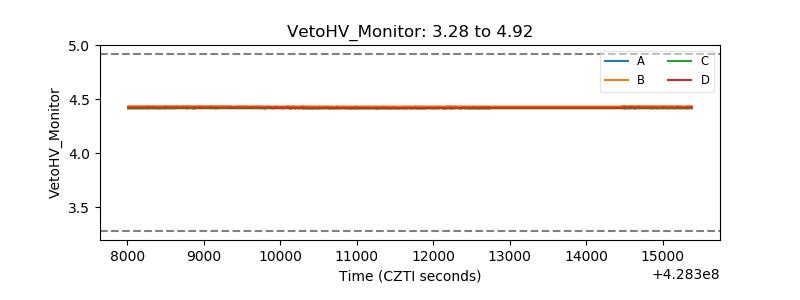 |
| Veto LLD | 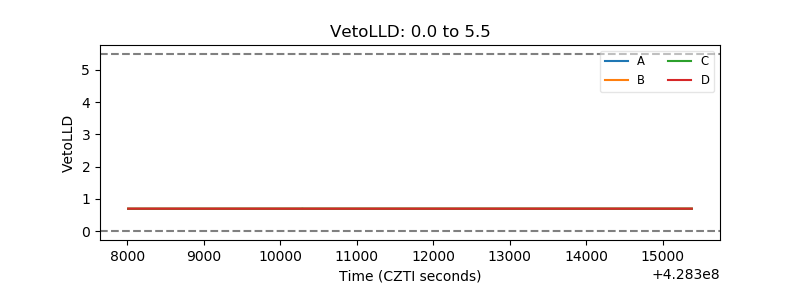 |
| Alpha Counter | 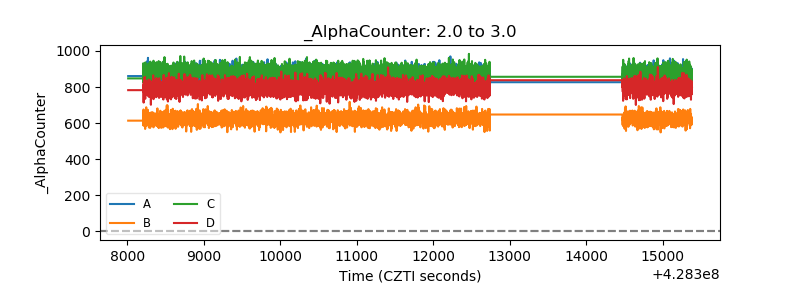 |
| _CPM_Rate | 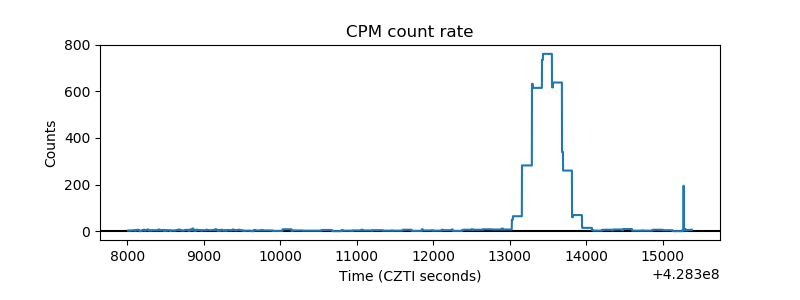 |
| CZT Counter | 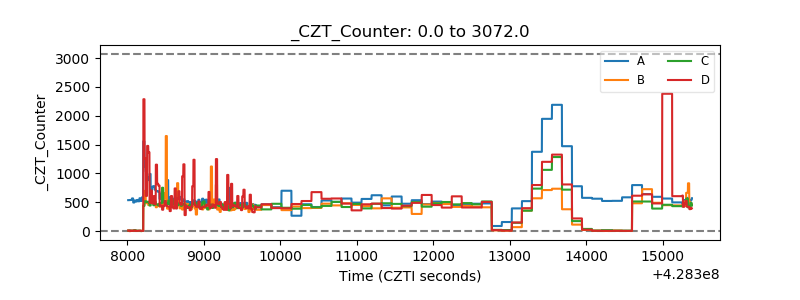 |
| +2.5 Volts monitor | 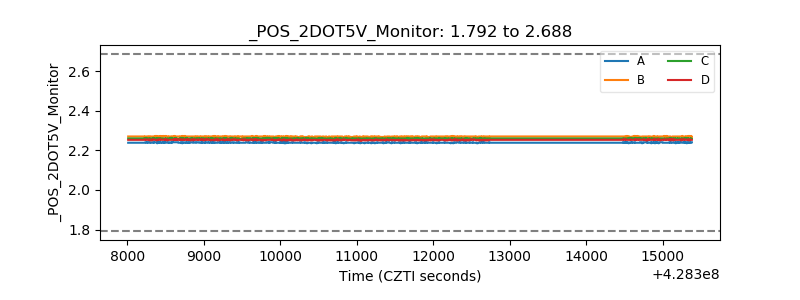 |
| +5 Volts monitor | 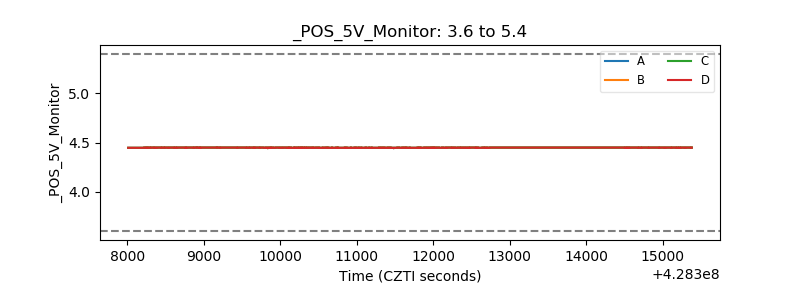 |
| _ROLL_ROT | 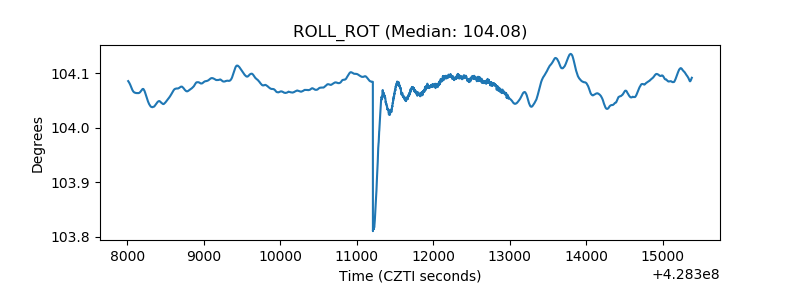 |
| _Roll_DEC | 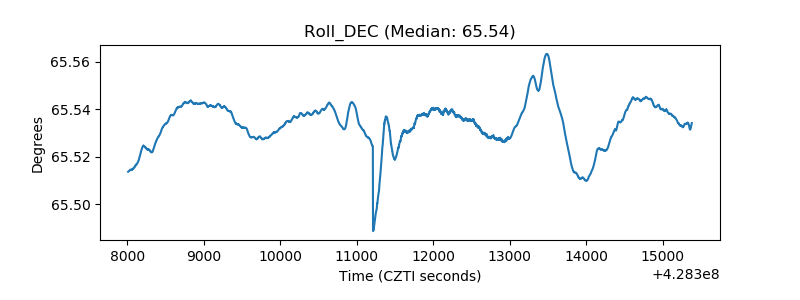 |
| _Roll_RA | 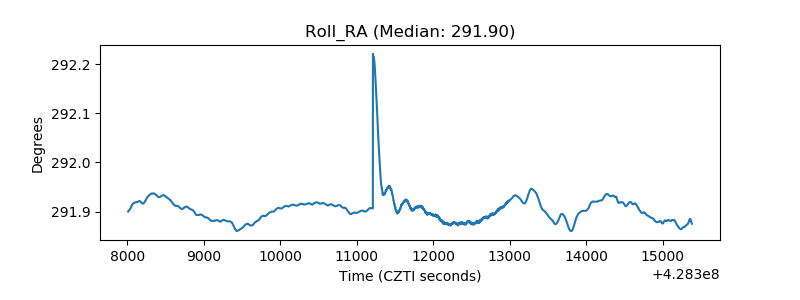 |
| Veto Counter | 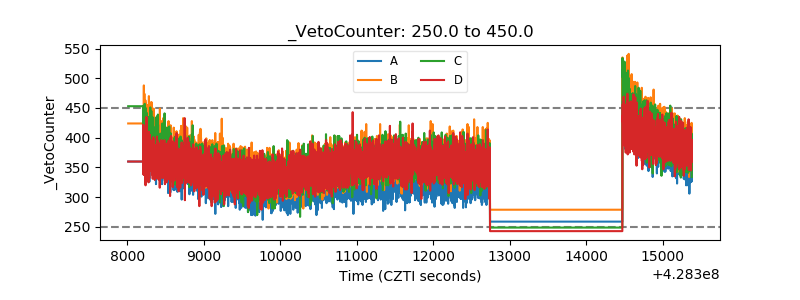 |