| Param | Original file | Final file |
|---|---|---|
| Filename | modeM0/AS1A12_102T01_9000005798_42357cztM0_level2.fits | modeM0/AS1A12_102T01_9000005798_42357cztM0_level2_quad_clean.evt |
| Size (bytes) | 354,977,280 | 96,255,360 |
| Size | 338.5 MB | 91.8 MB |
| Events in quadrant A | 3,406,919 | 666,544 |
| Events in quadrant B | 2,661,232 | 671,147 |
| Events in quadrant C | 2,581,962 | 634,379 |
| Events in quadrant D | 4,074,281 | 569,014 |
| Mode M9 | |||
|---|---|---|---|
| Quadrant | BADHDUFLAG | Total packets | Discarded packets |
| A | 0 | 26 | 0 |
| B | 0 | 27 | 0 |
| C | 0 | 27 | 0 |
| D | 0 | 27 | 0 |
| Mode SS | |||
|---|---|---|---|
| Quadrant | BADHDUFLAG | Total packets | Discarded packets |
| A | 0 | 108 | 0 |
| B | 0 | 108 | 0 |
| C | 0 | 108 | 0 |
| D | 0 | 108 | 0 |
| Mode M0 | |||
|---|---|---|---|
| Quadrant | BADHDUFLAG | Total packets | Discarded packets |
| A | 0 | 13501 | 2 |
| B | 0 | 11351 | 2 |
| C | 0 | 10818 | 2 |
| D | 0 | 15724 | 2 |
| Quadrant | Total seconds | Saturated seconds | Saturation percentage |
|---|---|---|---|
| A | 5341 | 21 | 0.393185% |
| B | 5341 | 32 | 0.599139% |
| C | 5341 | 2 | 0.037446% |
| D | 5341 | 284 | 5.317356% |
Noise dominated data is calculated using 1-second bins in cleaned event files. If a bin has >2000 counts, and if more than 50% of those come from <1% of pixels, then it is considered to be noise-dominated and hence unusable.
| Quadrant | # 1 sec bins | Bins with >0 counts | Bins with >2000 counts | High rate bins dominated by noise | Noise dominated (total time) | Noise dominated (detector-on time) | Marked lightcurve |
|---|---|---|---|---|---|---|---|
| A | 7314 | 5342 | 16 | 16 | 0.22% | 0.30% | 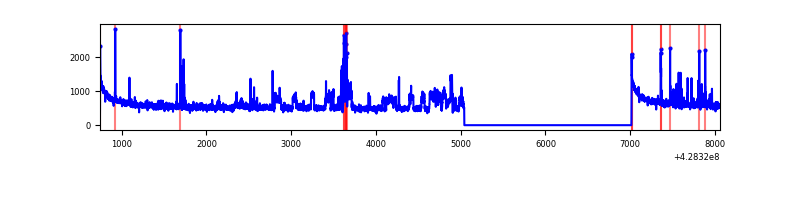 |
| B | 7314 | 5342 | 20 | 20 | 0.27% | 0.37% | 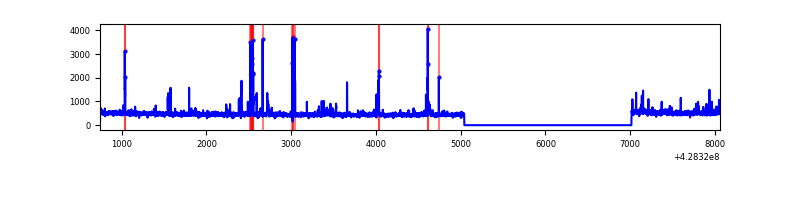 |
| C | 7314 | 5342 | 0 | 0 | 0.00% | 0.00% | 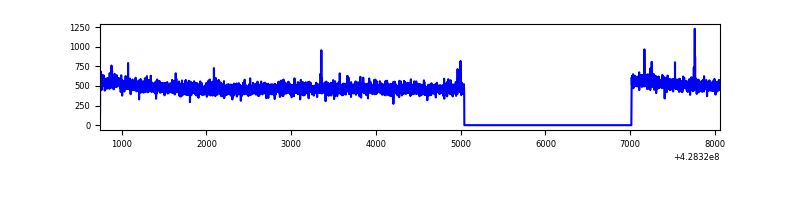 |
| D | 7314 | 5342 | 237 | 237 | 3.24% | 4.44% | 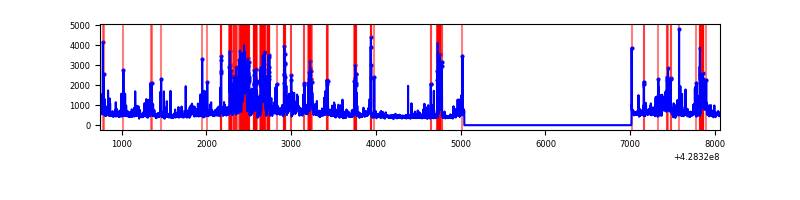 |
Top three noisy pixels from each quadrant. If the there are fewer than three noisy pixels in the level2.evt file, extra rows are filled as -1
| Pixel properties | Quadrant properties | ||||||
|---|---|---|---|---|---|---|---|
| Quadrant | DetID | PixID | Counts | Sigma | Mean | Median | Sigma |
| A | 10 | 83 | 560533 | 4441.52 | 621 | 610 | 126.1 |
| A | 15 | 235 | 287940 | 2279.21 | 621 | 610 | 126.1 |
| A | 13 | 248 | 119728 | 944.89 | 621 | 610 | 126.1 |
| B | 5 | 172 | 54545 | 473.3 | 609 | 592 | 114.0 |
| B | 3 | 112 | 52945 | 459.26 | 609 | 592 | 114.0 |
| B | 4 | 81 | 50673 | 439.33 | 609 | 592 | 114.0 |
| C | 15 | 214 | 223588 | 1599.93 | 601 | 604 | 139.4 |
| C | 15 | 111 | 9198 | 61.66 | 601 | 604 | 139.4 |
| C | 7 | 247 | 7997 | 53.05 | 601 | 604 | 139.4 |
| D | 1 | 52 | 621206 | 4274.56 | 594 | 577 | 145.2 |
| D | 12 | 233 | 574721 | 3954.39 | 594 | 577 | 145.2 |
| D | 12 | 6 | 148530 | 1019.02 | 594 | 577 | 145.2 |
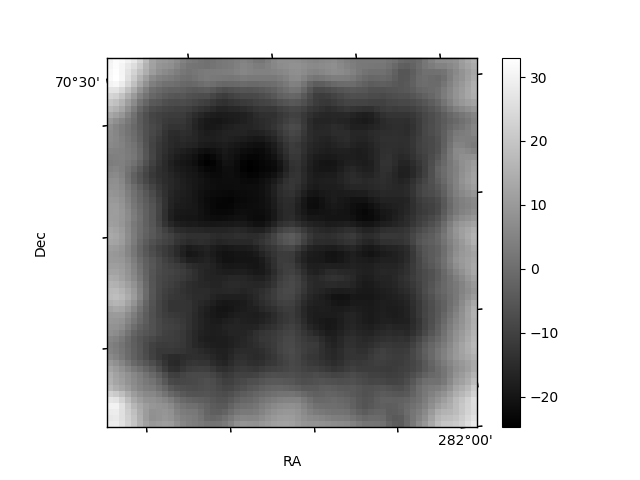
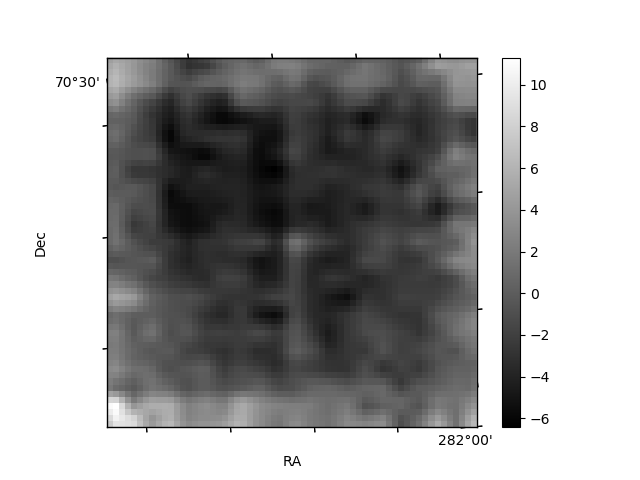
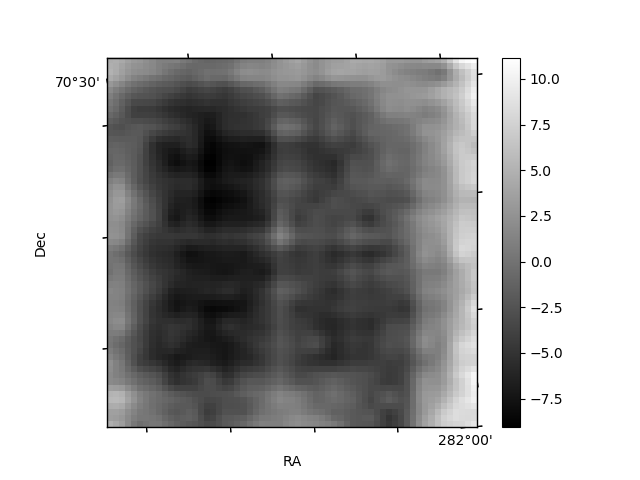
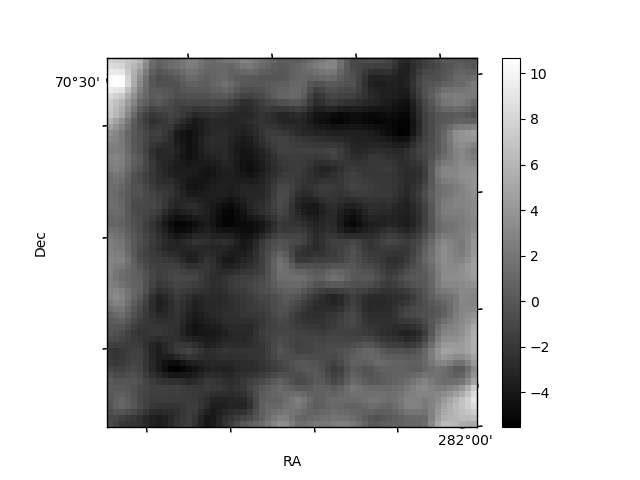
Histogram calculated using DETX and DETY for each event in the final _common_clean file
| Quadrant A | 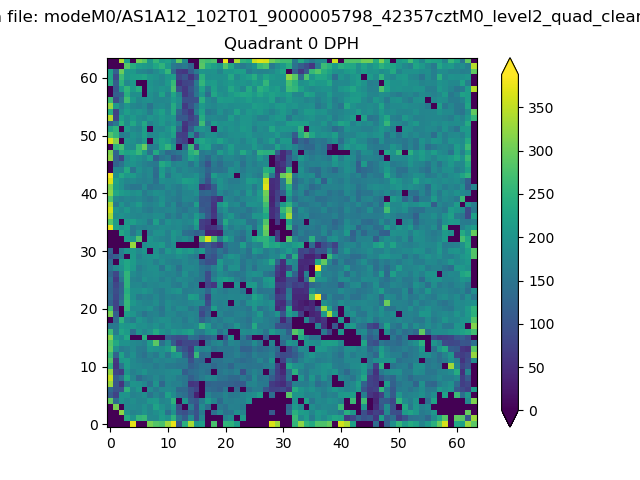 |
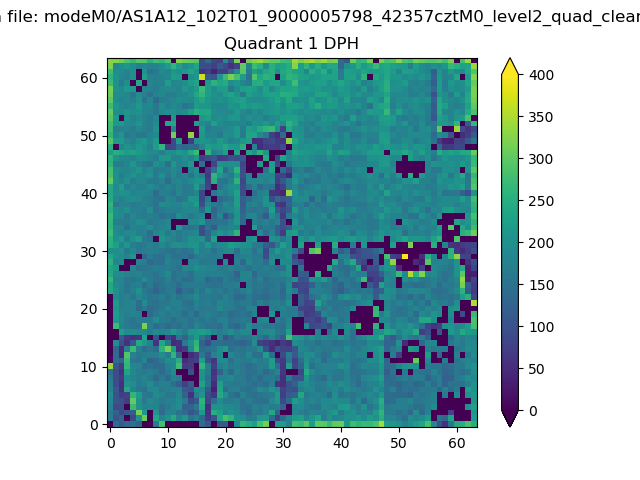 |
Quadrant B |
|---|---|---|---|
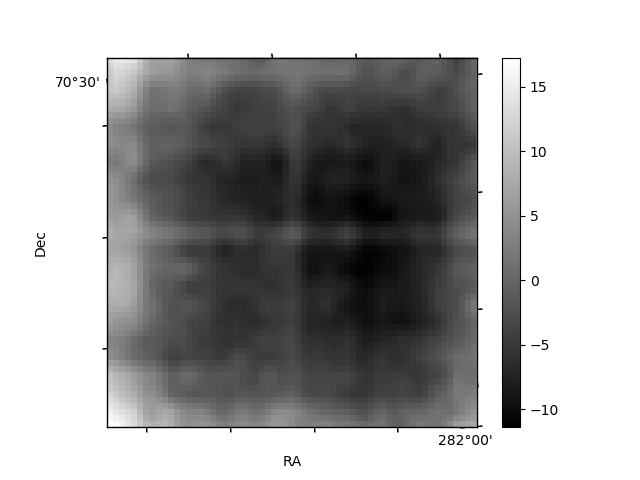
| Quadrant D | 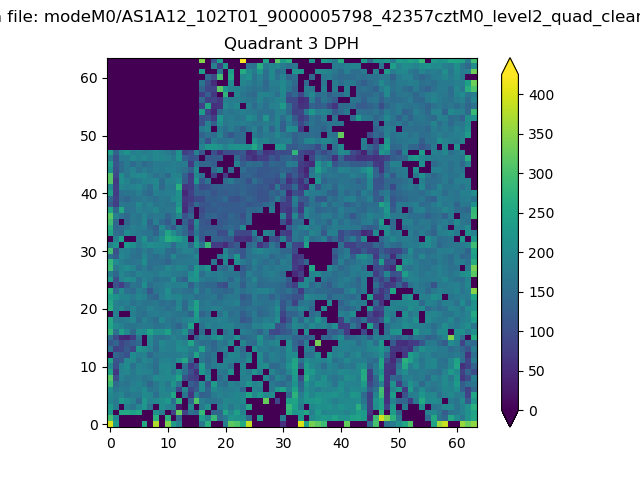 |
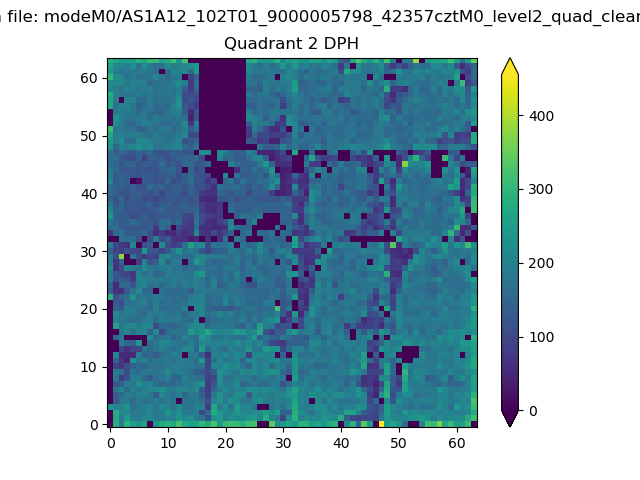 |
Quadrant C |
| Plot type | Count rate plots | Images |
|---|---|---|
| Comparison with Poisson distribution Blue bars denote a histogram of data divided into 1 sec bins. Red curve is a Poisson curve with rate = median count rate of data. |
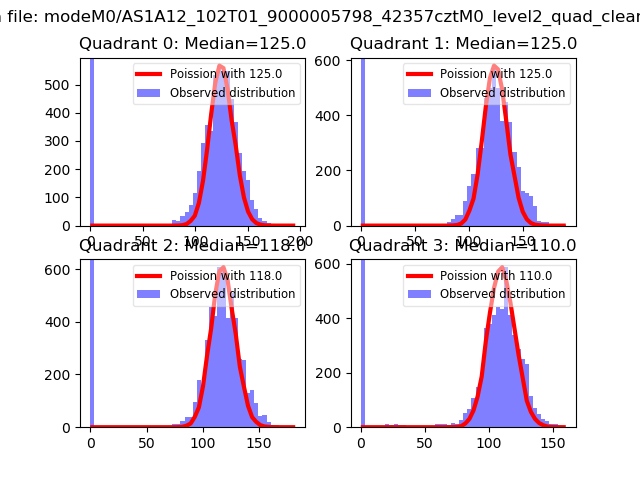 |
 |
| Quadrant-wise count rates Data is divided into 100 sec bins |
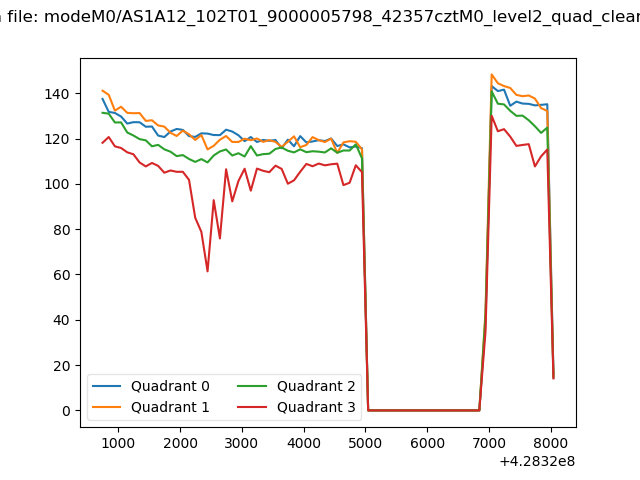 |
|
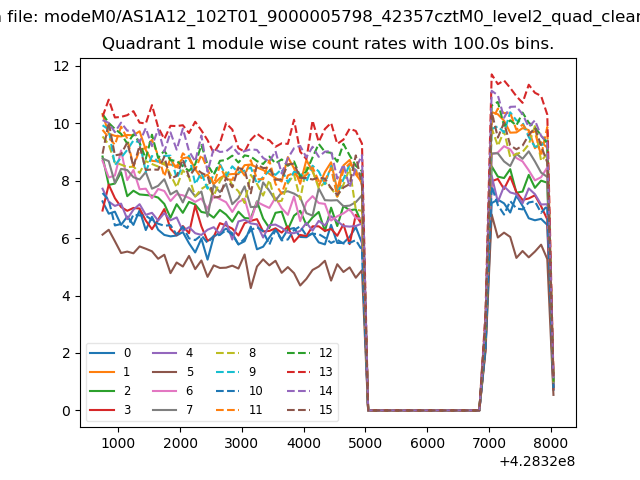
| Module-wise count rates for Quadrant A Data is divided into 100 sec bins |
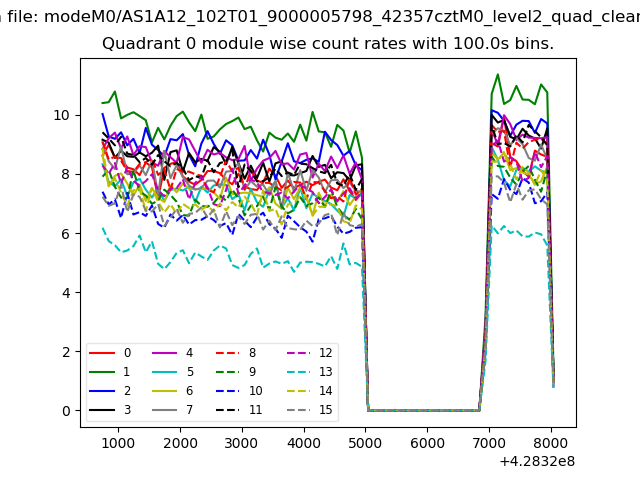 |
 |
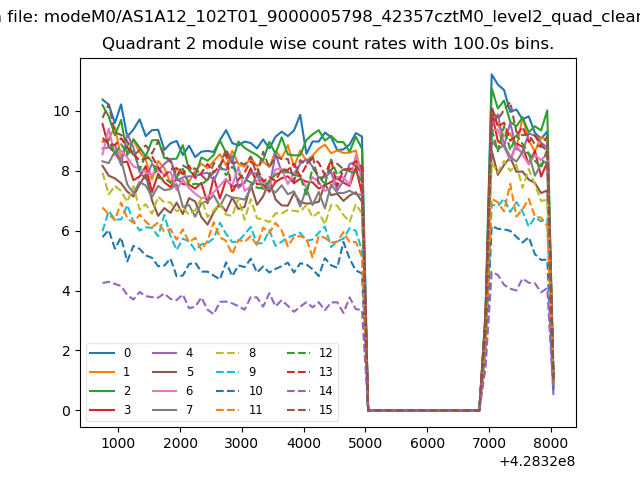
| Module-wise count rates for Quadrant B Data is divided into 100 sec bins |
 |
 |
| Module-wise count rates for Quadrant C Data is divided into 100 sec bins |
 |
 |
| Module-wise count rates for Quadrant D Data is divided into 100 sec bins |
 |
 |
| Parameter | Plot |
|---|---|
| CZT HV Monitor |  |
| D_VDD | 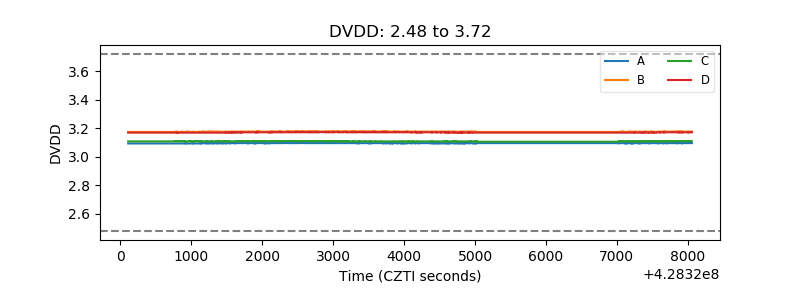 |
| Temperature 1 | 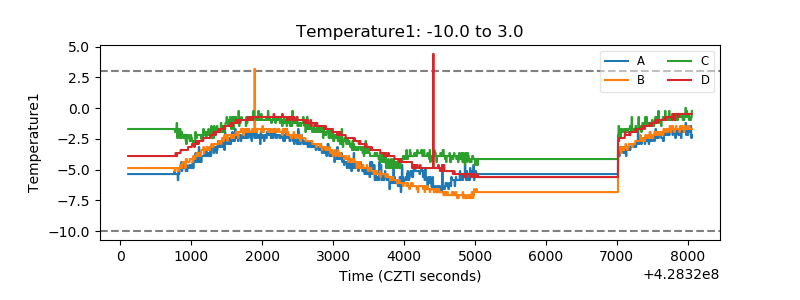 |
| Veto HV Monitor | 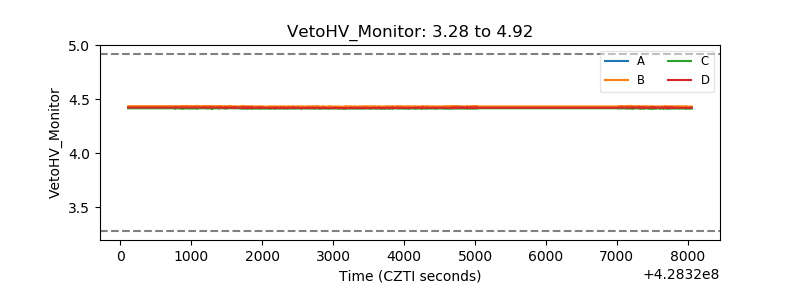 |
| Veto LLD | 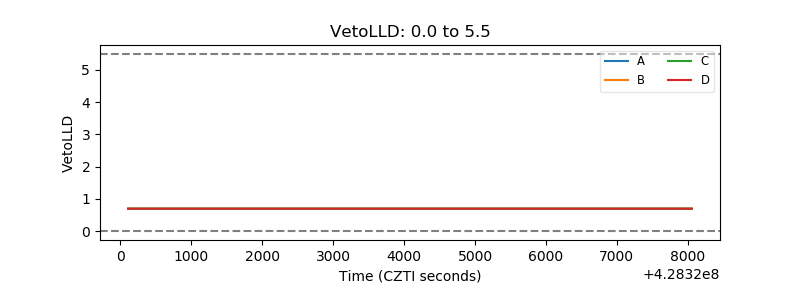 |
| Alpha Counter | 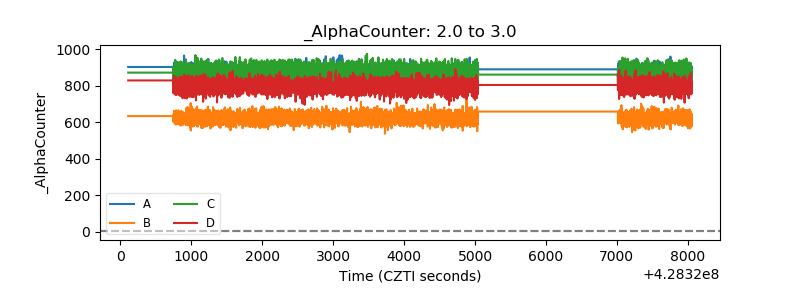 |
| _CPM_Rate | 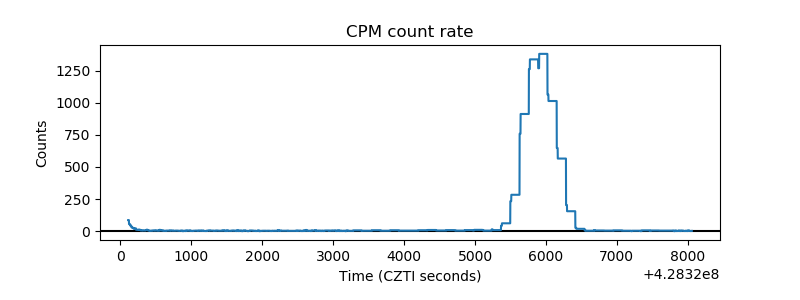 |
| CZT Counter | 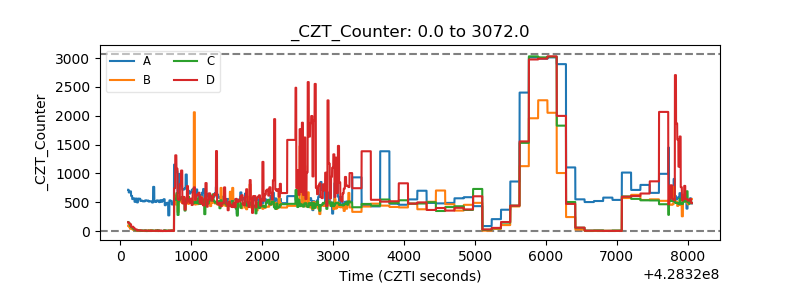 |
| +2.5 Volts monitor | 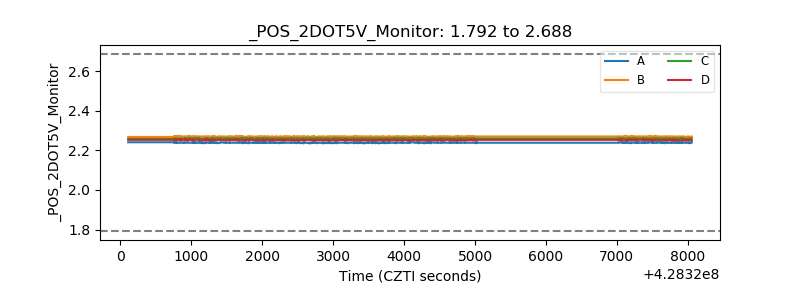 |
| +5 Volts monitor | 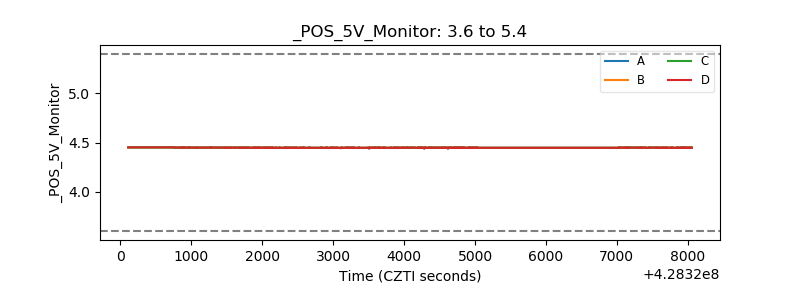 |
| _ROLL_ROT | 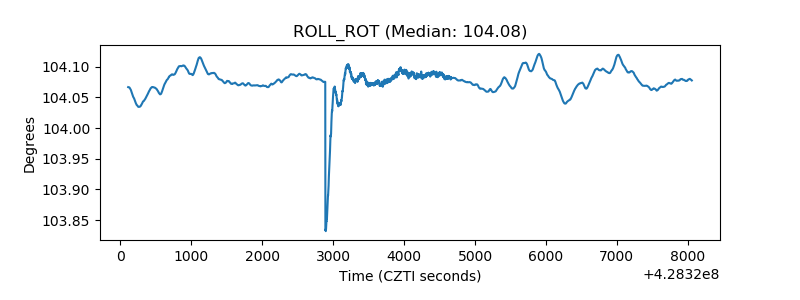 |
| _Roll_DEC | 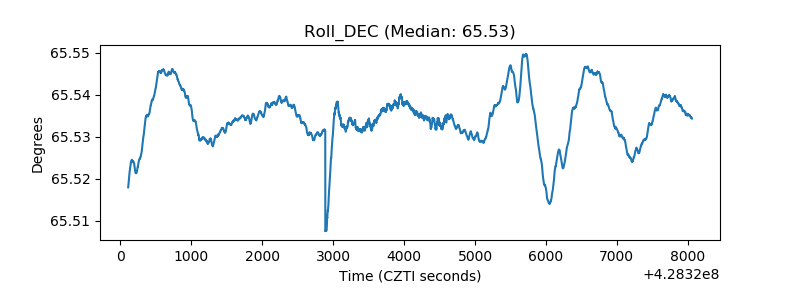 |
| _Roll_RA | 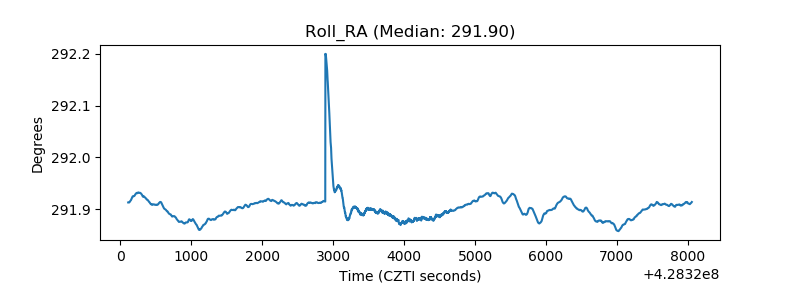 |
| Veto Counter | 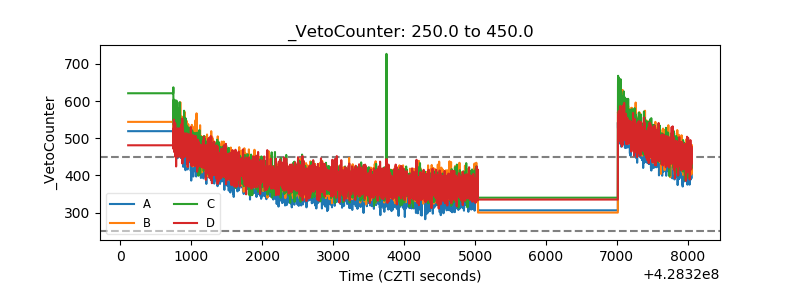 |