| Param | Original file | Final file |
|---|---|---|
| Filename | modeM0/AS1A12_102T01_9000005798_42358cztM0_level2.fits | modeM0/AS1A12_102T01_9000005798_42358cztM0_level2_quad_clean.evt |
| Size (bytes) | 329,250,240 | 96,540,480 |
| Size | 314.0 MB | 92.1 MB |
| Events in quadrant A | 3,030,867 | 666,493 |
| Events in quadrant B | 2,826,010 | 667,402 |
| Events in quadrant C | 2,577,975 | 635,950 |
| Events in quadrant D | 3,348,932 | 590,629 |
| Mode M9 | |||
|---|---|---|---|
| Quadrant | BADHDUFLAG | Total packets | Discarded packets |
| A | 0 | 21 | 0 |
| B | 0 | 21 | 0 |
| C | 0 | 22 | 0 |
| D | 0 | 22 | 0 |
| Mode SS | |||
|---|---|---|---|
| Quadrant | BADHDUFLAG | Total packets | Discarded packets |
| A | 0 | 104 | 0 |
| B | 0 | 104 | 0 |
| C | 0 | 104 | 0 |
| D | 0 | 104 | 0 |
| Mode M0 | |||
|---|---|---|---|
| Quadrant | BADHDUFLAG | Total packets | Discarded packets |
| A | 0 | 12210 | 2 |
| B | 0 | 11593 | 2 |
| C | 0 | 10593 | 2 |
| D | 0 | 13356 | 10 |
| Quadrant | Total seconds | Saturated seconds | Saturation percentage |
|---|---|---|---|
| A | 5188 | 20 | 0.385505% |
| B | 5188 | 45 | 0.867386% |
| C | 5187 | 4 | 0.077116% |
| D | 5187 | 88 | 1.696549% |
Noise dominated data is calculated using 1-second bins in cleaned event files. If a bin has >2000 counts, and if more than 50% of those come from <1% of pixels, then it is considered to be noise-dominated and hence unusable.
| Quadrant | # 1 sec bins | Bins with >0 counts | Bins with >2000 counts | High rate bins dominated by noise | Noise dominated (total time) | Noise dominated (detector-on time) | Marked lightcurve |
|---|---|---|---|---|---|---|---|
| A | 7281 | 5189 | 10 | 10 | 0.14% | 0.19% | 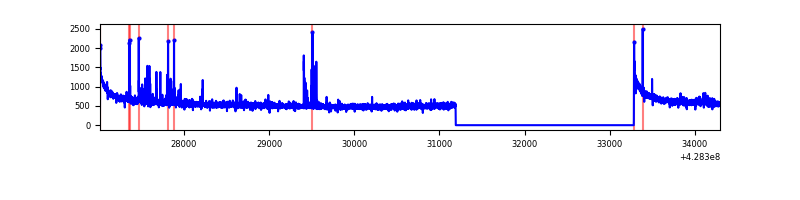 |
| B | 7281 | 5189 | 32 | 32 | 0.44% | 0.62% | 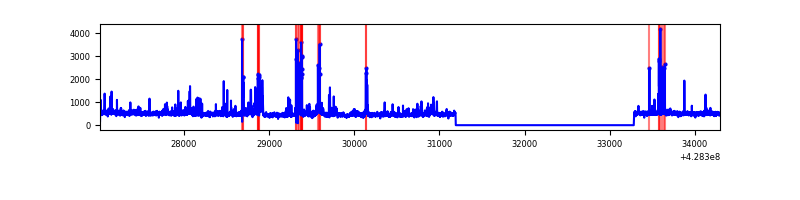 |
| C | 7281 | 5189 | 1 | 1 | 0.01% | 0.02% | 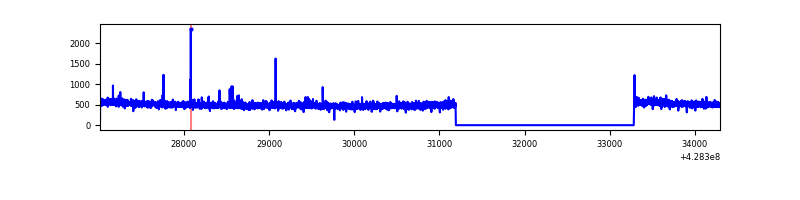 |
| D | 7280 | 5188 | 74 | 74 | 1.02% | 1.43% | 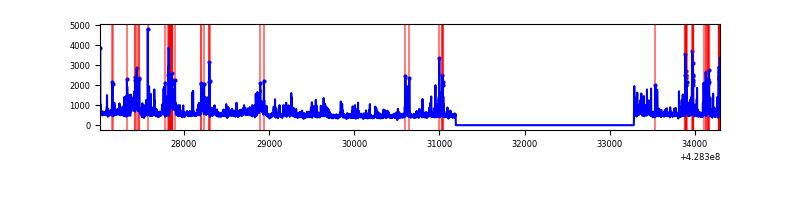 |
Top three noisy pixels from each quadrant. If the there are fewer than three noisy pixels in the level2.evt file, extra rows are filled as -1
| Pixel properties | Quadrant properties | ||||||
|---|---|---|---|---|---|---|---|
| Quadrant | DetID | PixID | Counts | Sigma | Mean | Median | Sigma |
| A | 10 | 83 | 565202 | 4594.49 | 608 | 597 | 122.9 |
| A | 13 | 248 | 85988 | 694.87 | 608 | 597 | 122.9 |
| A | 10 | 255 | 12483 | 96.72 | 608 | 597 | 122.9 |
| B | 3 | 112 | 150050 | 1318.97 | 597 | 582 | 113.3 |
| B | 0 | 245 | 71320 | 624.22 | 597 | 582 | 113.3 |
| B | 5 | 172 | 63292 | 553.38 | 597 | 582 | 113.3 |
| C | 15 | 214 | 218569 | 1598.25 | 594 | 599 | 136.4 |
| C | 15 | 111 | 17725 | 125.58 | 594 | 599 | 136.4 |
| C | 8 | 79 | 14621 | 102.82 | 594 | 599 | 136.4 |
| D | 1 | 52 | 366573 | 2569.48 | 594 | 580 | 142.4 |
| D | 12 | 233 | 195753 | 1370.23 | 594 | 580 | 142.4 |
| D | 10 | 199 | 109564 | 765.13 | 594 | 580 | 142.4 |
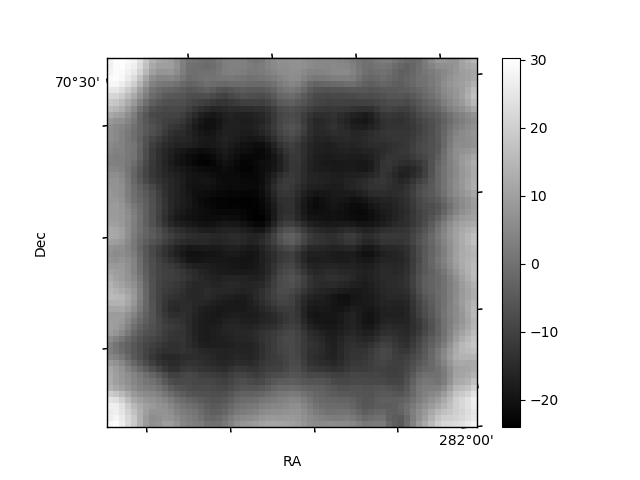
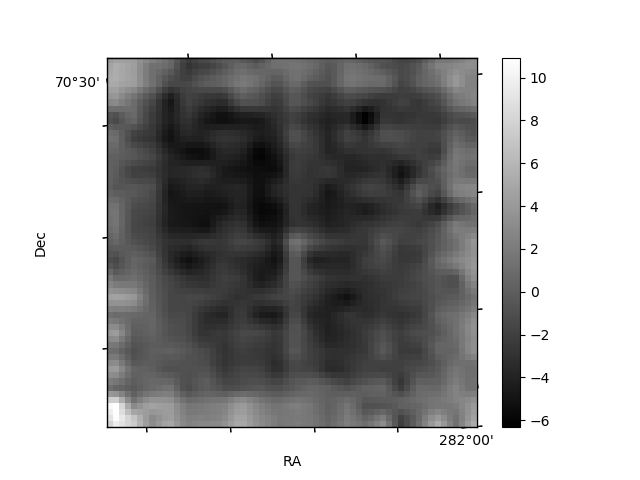
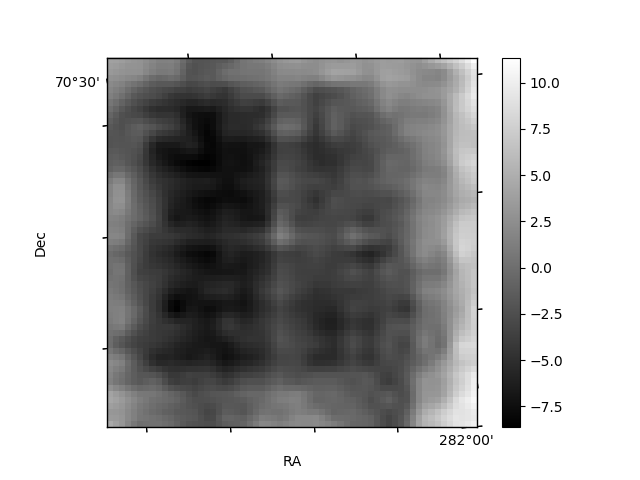
Histogram calculated using DETX and DETY for each event in the final _common_clean file
| Quadrant A | 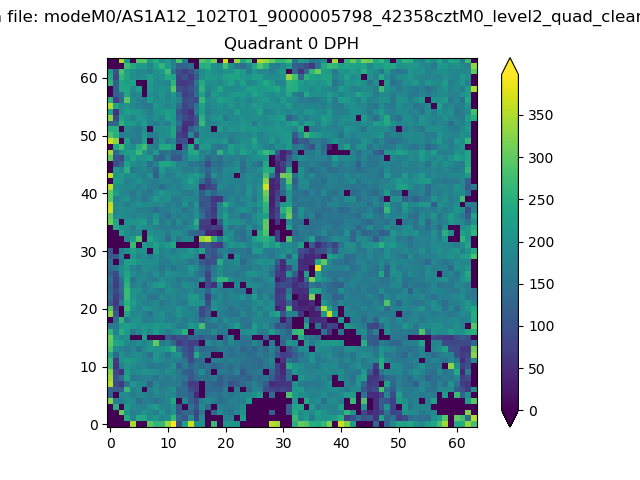 |
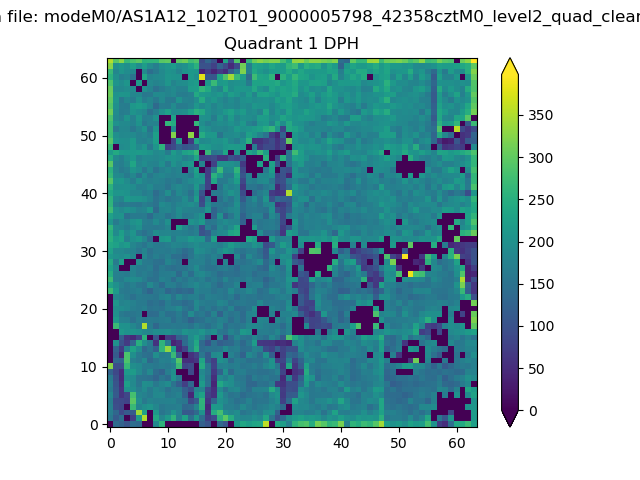 |
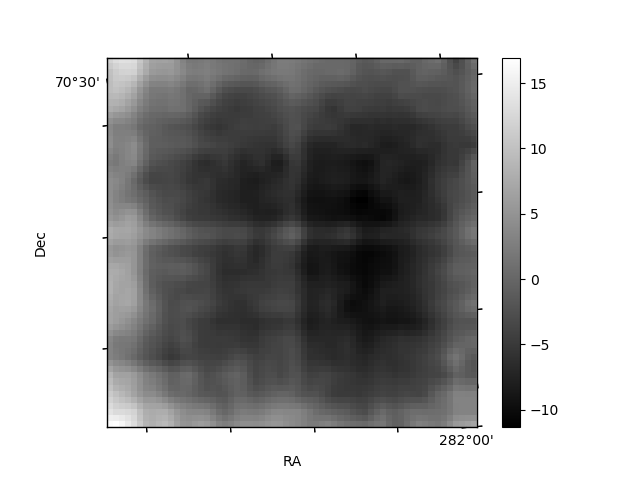
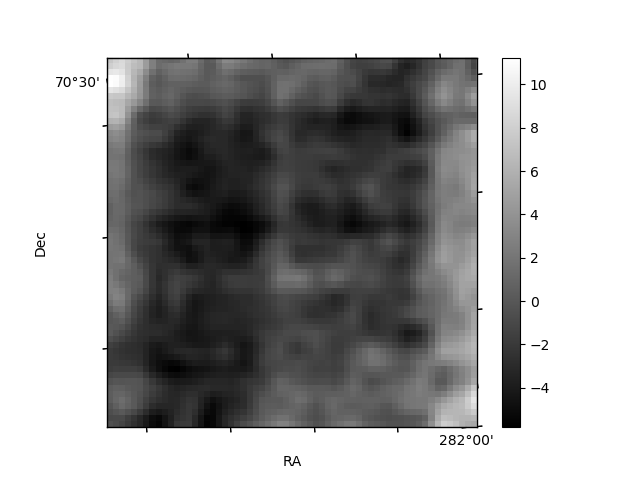
Quadrant B |
|---|---|---|---|
| Quadrant D | 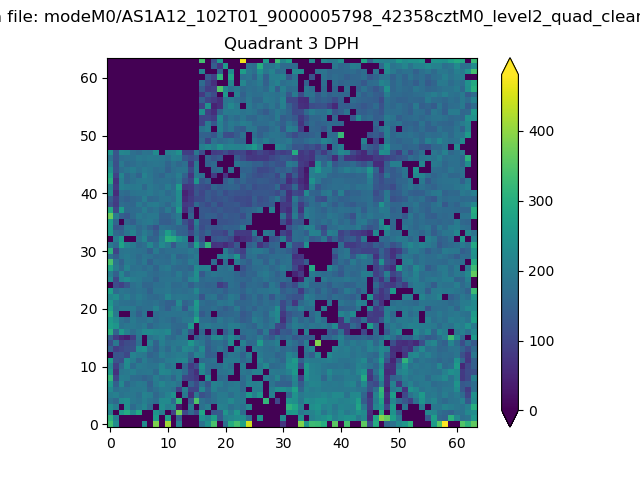 |
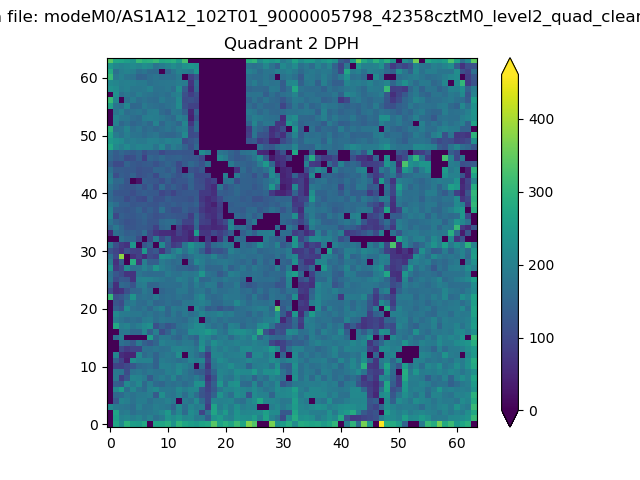 |
Quadrant C |
| Plot type | Count rate plots | Images |
|---|---|---|
| Comparison with Poisson distribution Blue bars denote a histogram of data divided into 1 sec bins. Red curve is a Poisson curve with rate = median count rate of data. |
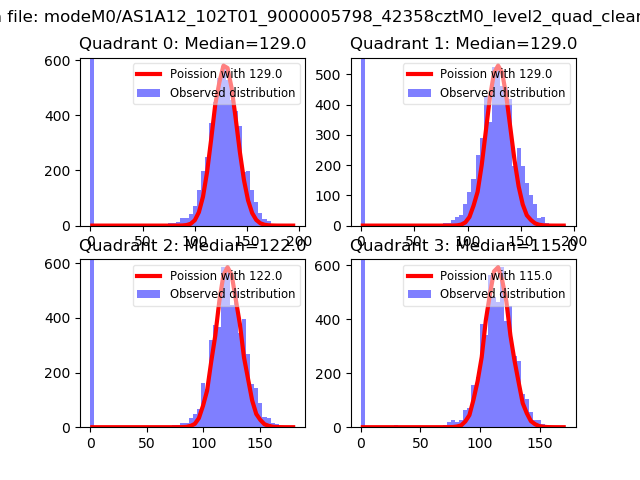 |
 |
| Quadrant-wise count rates Data is divided into 100 sec bins |
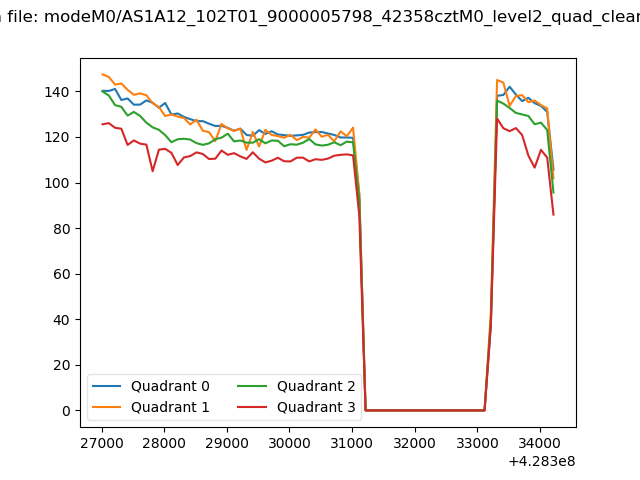 |
|
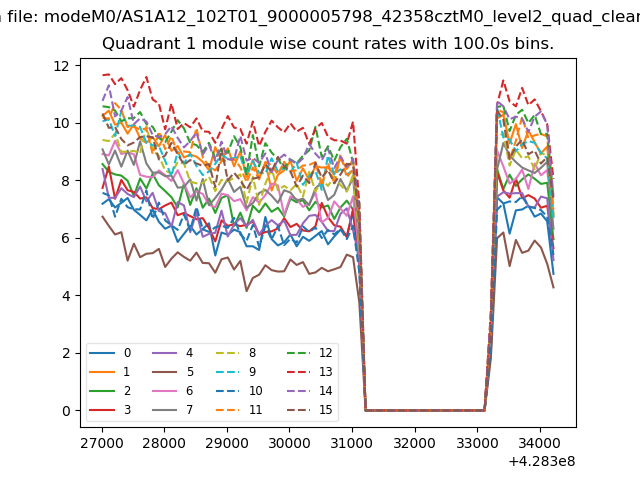
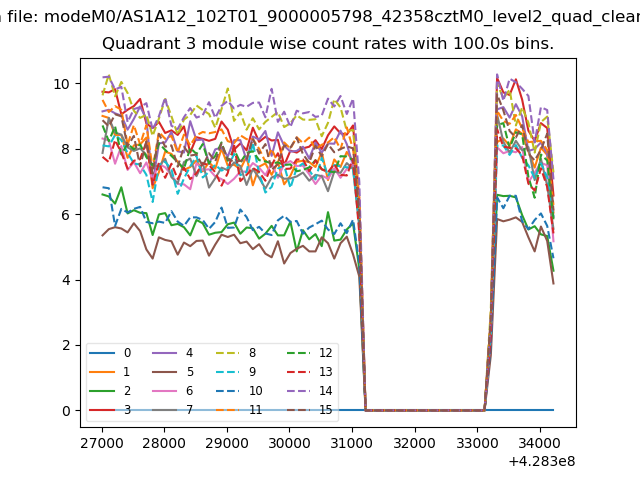
| Module-wise count rates for Quadrant A Data is divided into 100 sec bins |
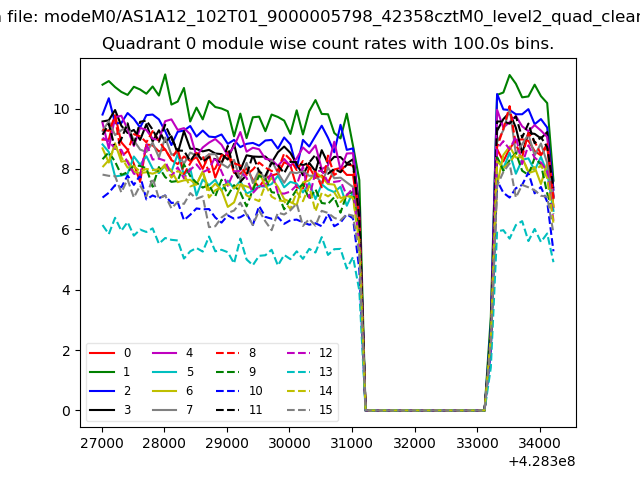 |
 |
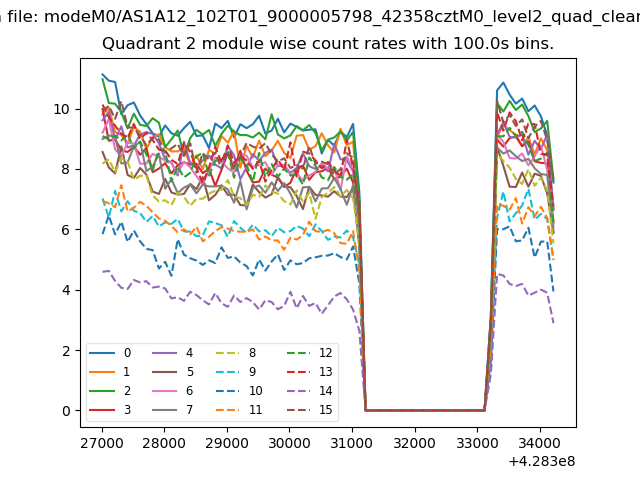
| Module-wise count rates for Quadrant B Data is divided into 100 sec bins |
 |
 |
| Module-wise count rates for Quadrant C Data is divided into 100 sec bins |
 |
 |
| Module-wise count rates for Quadrant D Data is divided into 100 sec bins |
 |
 |
| Parameter | Plot |
|---|---|
| CZT HV Monitor | 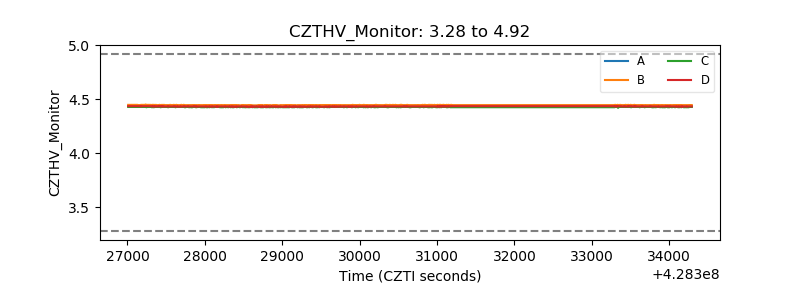 |
| D_VDD | 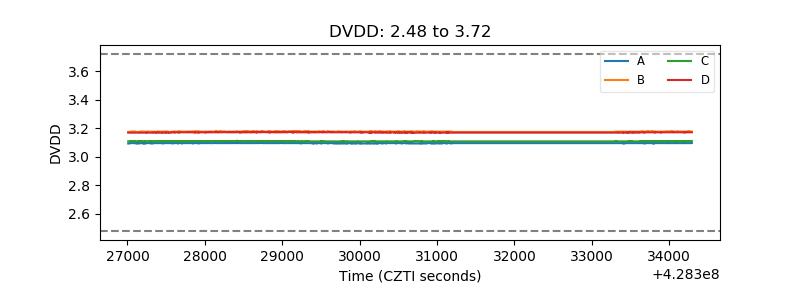 |
| Temperature 1 | 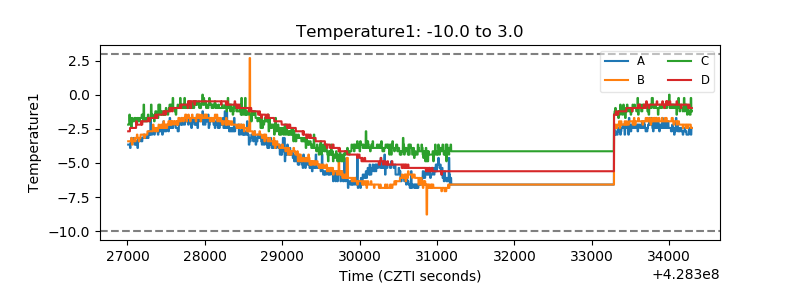 |
| Veto HV Monitor | 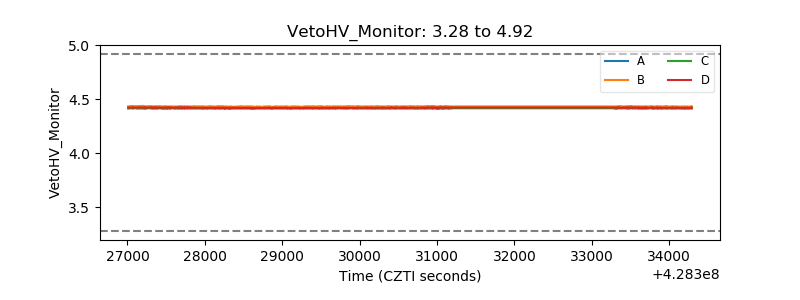 |
| Veto LLD | 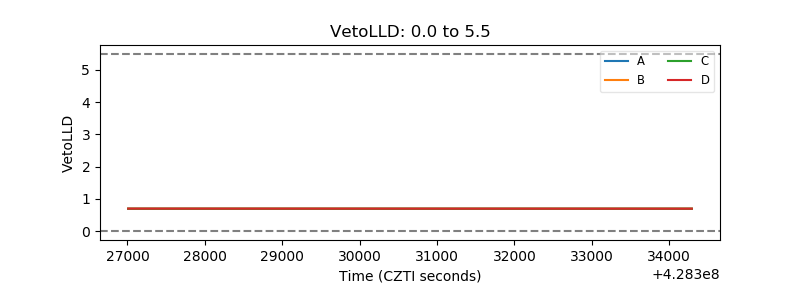 |
| Alpha Counter | 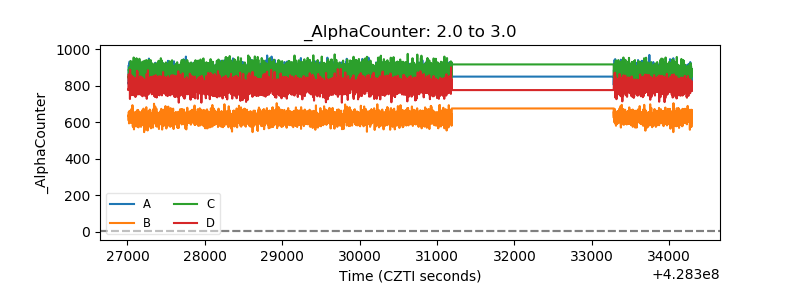 |
| _CPM_Rate | 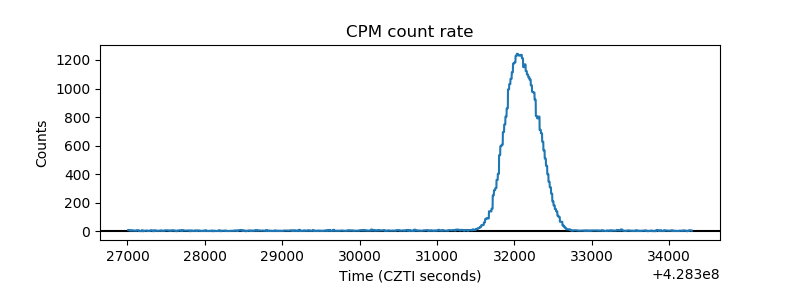 |
| CZT Counter | 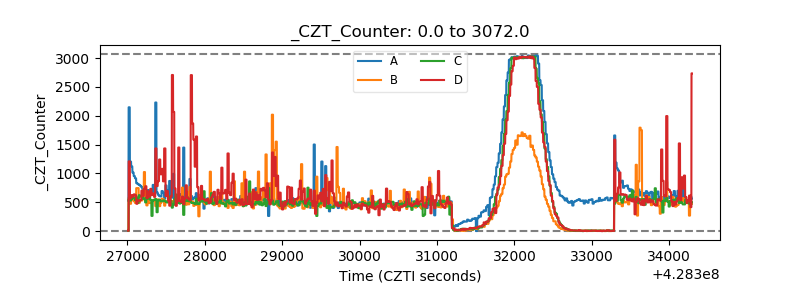 |
| +2.5 Volts monitor | 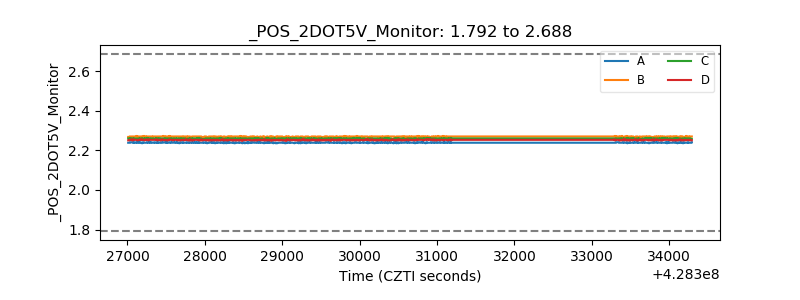 |
| +5 Volts monitor | 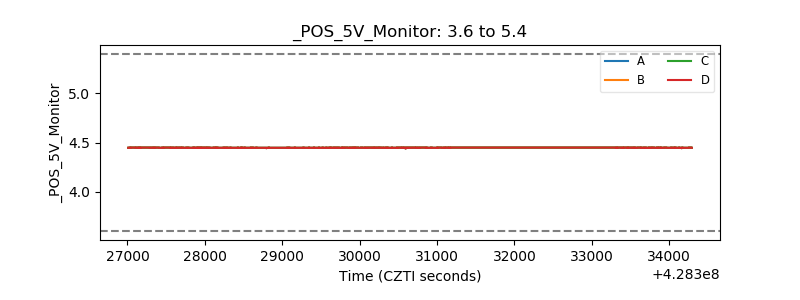 |
| _ROLL_ROT | 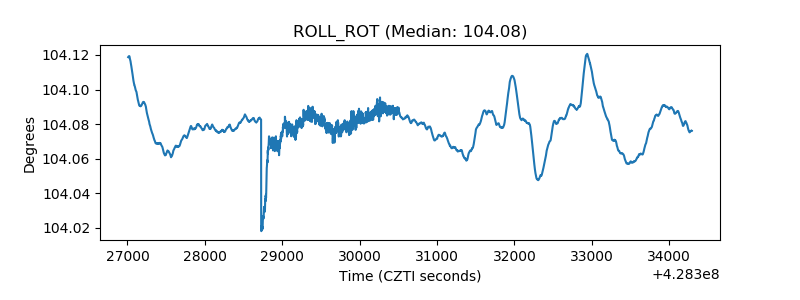 |
| _Roll_DEC | 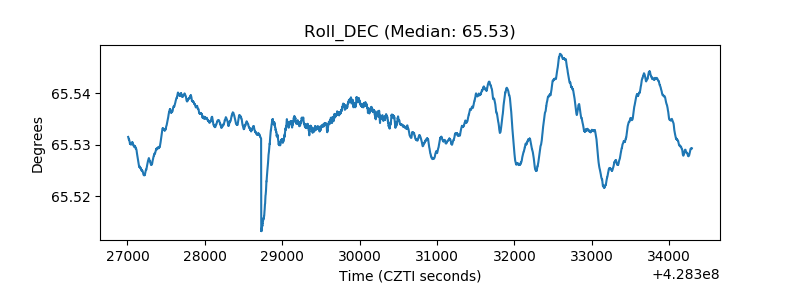 |
| _Roll_RA | 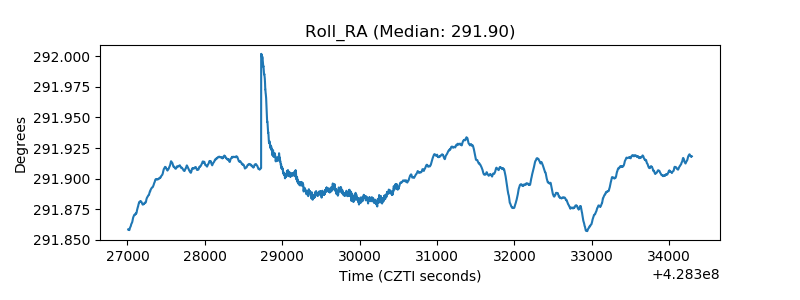 |
| Veto Counter | 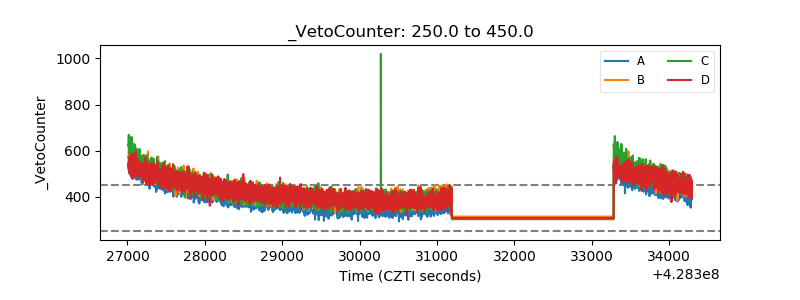 |