| Param | Original file | Final file |
|---|---|---|
| Filename | modeM0/AS1A12_102T01_9000005798_42363cztM0_level2.fits | modeM0/AS1A12_102T01_9000005798_42363cztM0_level2_quad_clean.evt |
| Size (bytes) | 348,768,000 | 98,516,160 |
| Size | 332.6 MB | 94.0 MB |
| Events in quadrant A | 3,108,280 | 656,943 |
| Events in quadrant B | 3,163,449 | 652,852 |
| Events in quadrant C | 2,695,099 | 652,598 |
| Events in quadrant D | 3,471,193 | 597,302 |
| Mode M9 | |||
|---|---|---|---|
| Quadrant | BADHDUFLAG | Total packets | Discarded packets |
| A | 0 | 17 | 0 |
| B | 0 | 18 | 0 |
| C | 0 | 18 | 0 |
| D | 0 | 18 | 0 |
| Mode SS | |||
|---|---|---|---|
| Quadrant | BADHDUFLAG | Total packets | Discarded packets |
| A | 0 | 124 | 0 |
| B | 0 | 124 | 0 |
| C | 0 | 124 | 0 |
| D | 0 | 124 | 0 |
| Mode M0 | |||
|---|---|---|---|
| Quadrant | BADHDUFLAG | Total packets | Discarded packets |
| A | 0 | 13149 | 2 |
| B | 0 | 13870 | 2 |
| C | 0 | 12143 | 2 |
| D | 0 | 14868 | 2 |
| Quadrant | Total seconds | Saturated seconds | Saturation percentage |
|---|---|---|---|
| A | 6059 | 11 | 0.181548% |
| B | 6059 | 179 | 2.954283% |
| C | 6059 | 4 | 0.066017% |
| D | 6059 | 144 | 2.376630% |
Noise dominated data is calculated using 1-second bins in cleaned event files. If a bin has >2000 counts, and if more than 50% of those come from <1% of pixels, then it is considered to be noise-dominated and hence unusable.
| Quadrant | # 1 sec bins | Bins with >0 counts | Bins with >2000 counts | High rate bins dominated by noise | Noise dominated (total time) | Noise dominated (detector-on time) | Marked lightcurve |
|---|---|---|---|---|---|---|---|
| A | 7672 | 6060 | 6 | 6 | 0.08% | 0.10% | 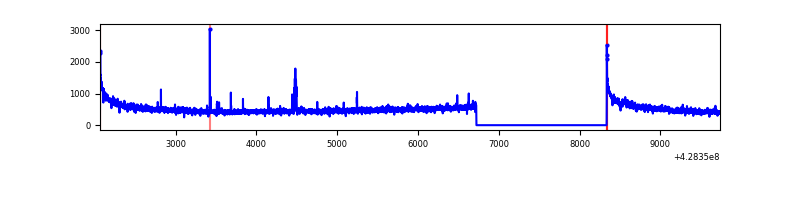 |
| B | 7672 | 6059 | 126 | 126 | 1.64% | 2.08% | 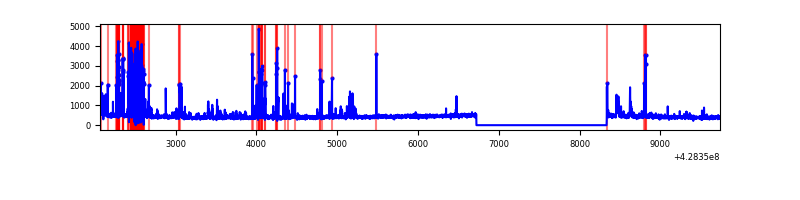 |
| C | 7672 | 6060 | 0 | 0 | 0.00% | 0.00% | 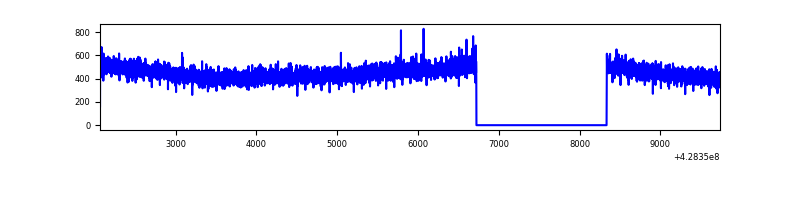 |
| D | 7672 | 6060 | 121 | 121 | 1.58% | 2.00% | 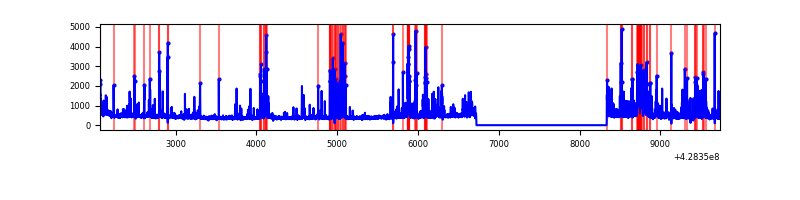 |
Top three noisy pixels from each quadrant. If the there are fewer than three noisy pixels in the level2.evt file, extra rows are filled as -1
| Pixel properties | Quadrant properties | ||||||
|---|---|---|---|---|---|---|---|
| Quadrant | DetID | PixID | Counts | Sigma | Mean | Median | Sigma |
| A | 10 | 83 | 589545 | 4608.25 | 626 | 614 | 127.8 |
| A | 15 | 235 | 31728 | 243.46 | 626 | 614 | 127.8 |
| A | 7 | 3 | 28405 | 217.46 | 626 | 614 | 127.8 |
| B | 3 | 112 | 298785 | 2513.88 | 616 | 599 | 118.6 |
| B | 5 | 255 | 280472 | 2359.49 | 616 | 599 | 118.6 |
| B | 5 | 172 | 101336 | 849.27 | 616 | 599 | 118.6 |
| C | 15 | 214 | 252858 | 1728.76 | 624 | 627 | 145.9 |
| C | 13 | 61 | 4275 | 25.0 | 624 | 627 | 145.9 |
| C | 8 | 79 | 4233 | 24.72 | 624 | 627 | 145.9 |
| D | 1 | 52 | 308078 | 2063.63 | 615 | 600 | 149.0 |
| D | 12 | 6 | 258660 | 1731.96 | 615 | 600 | 149.0 |
| D | 5 | 222 | 143563 | 959.49 | 615 | 600 | 149.0 |
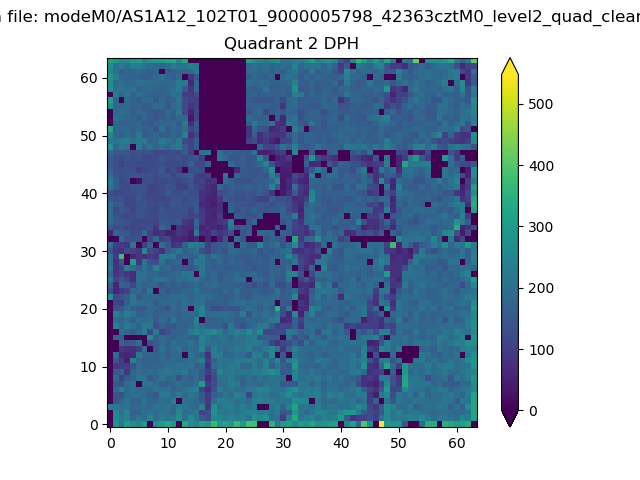
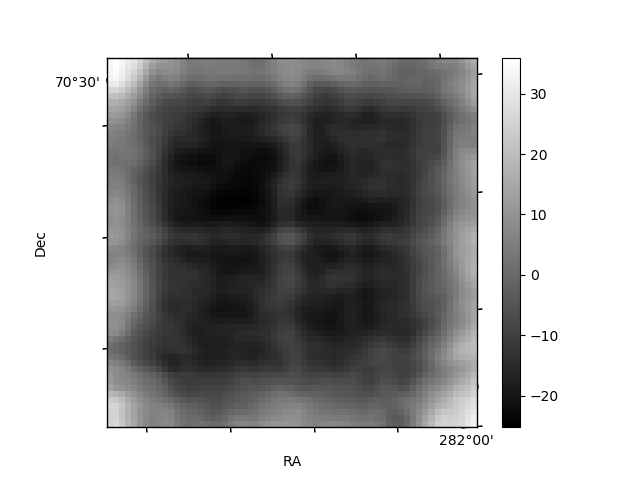
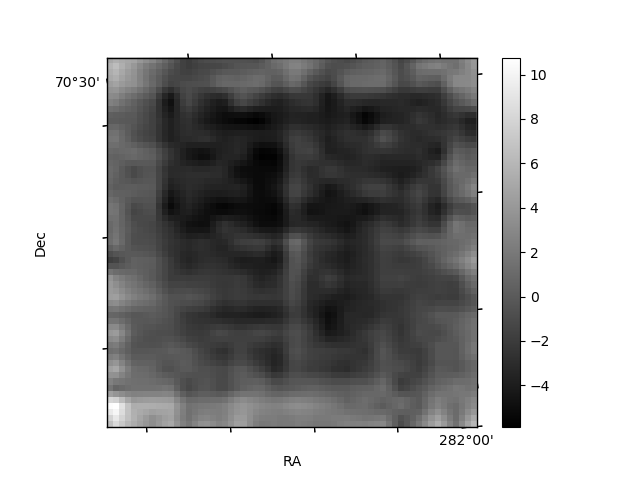
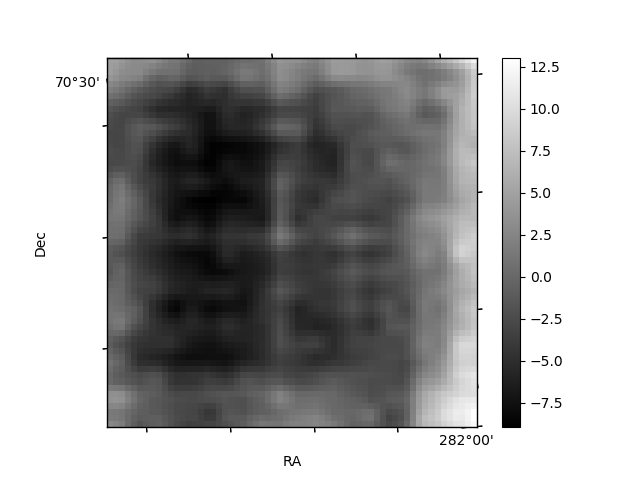
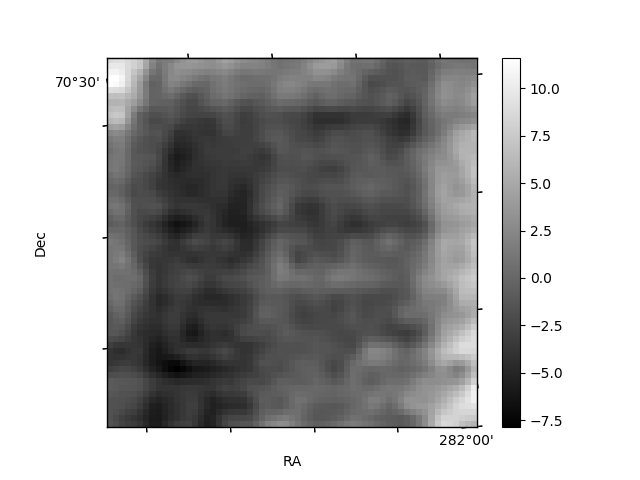
Histogram calculated using DETX and DETY for each event in the final _common_clean file
| Quadrant A | 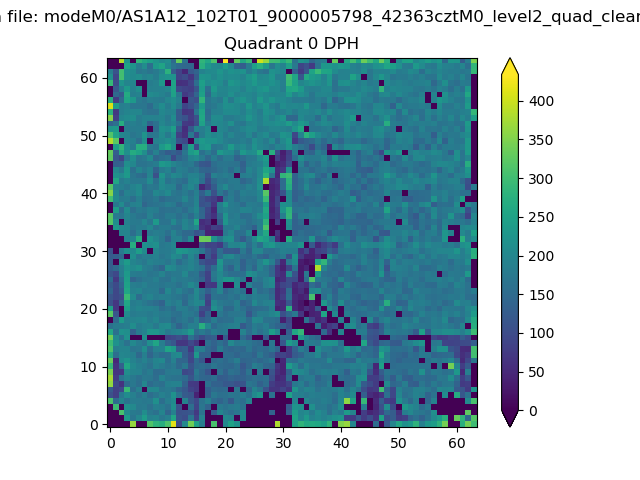 |
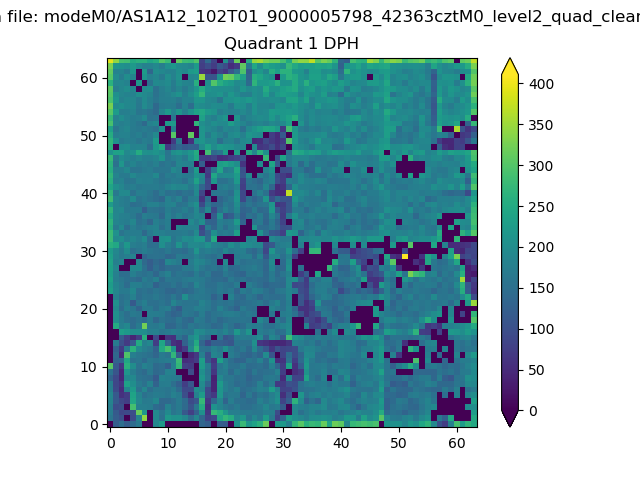 |
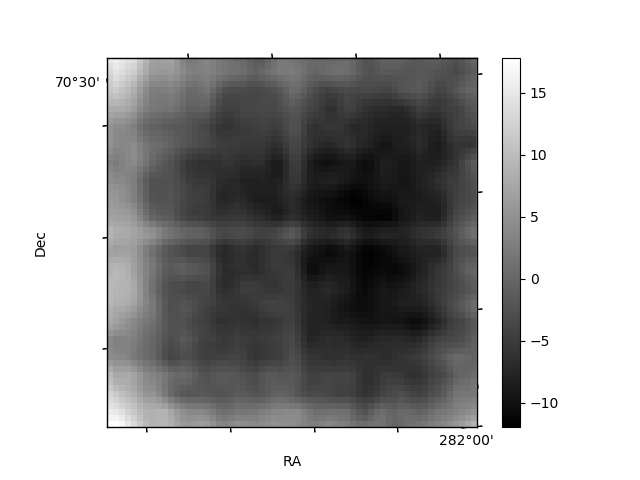
Quadrant B |
|---|---|---|---|
| Quadrant D | 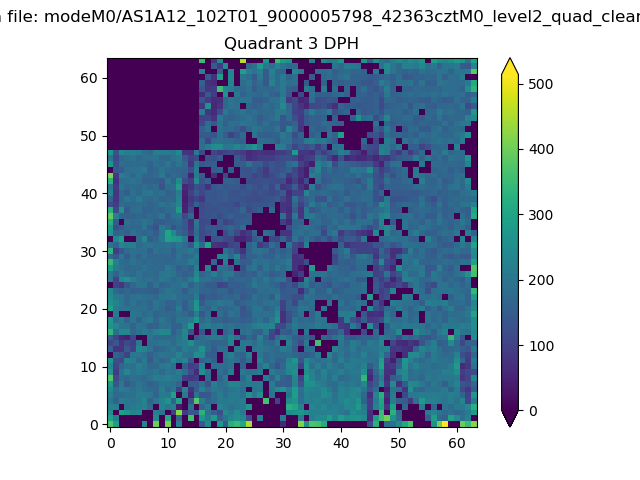 |
 |
Quadrant C |
| Plot type | Count rate plots | Images |
|---|---|---|
| Comparison with Poisson distribution Blue bars denote a histogram of data divided into 1 sec bins. Red curve is a Poisson curve with rate = median count rate of data. |
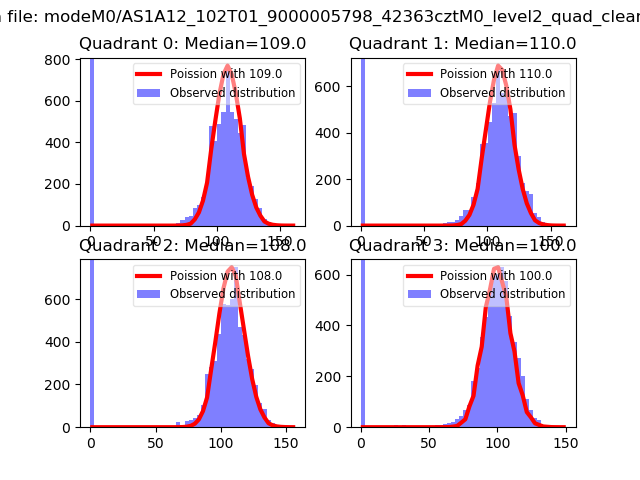 |
 |
| Quadrant-wise count rates Data is divided into 100 sec bins |
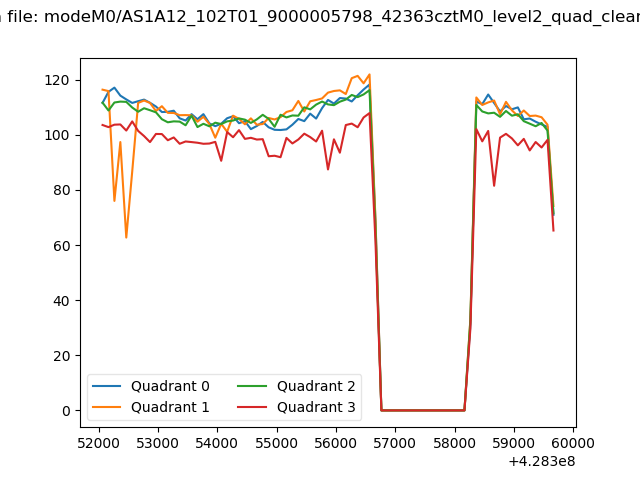 |
|
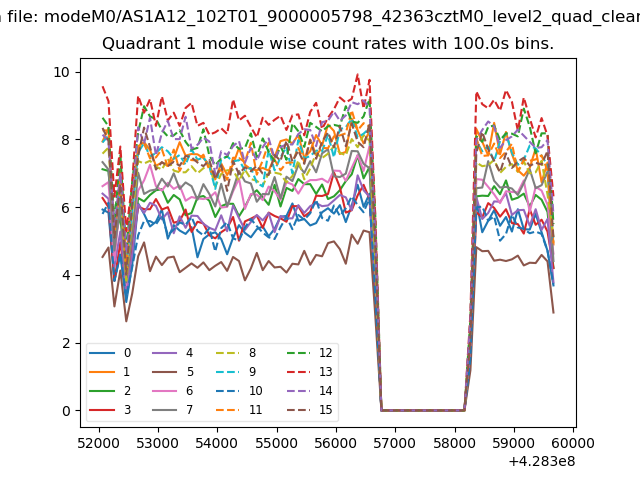
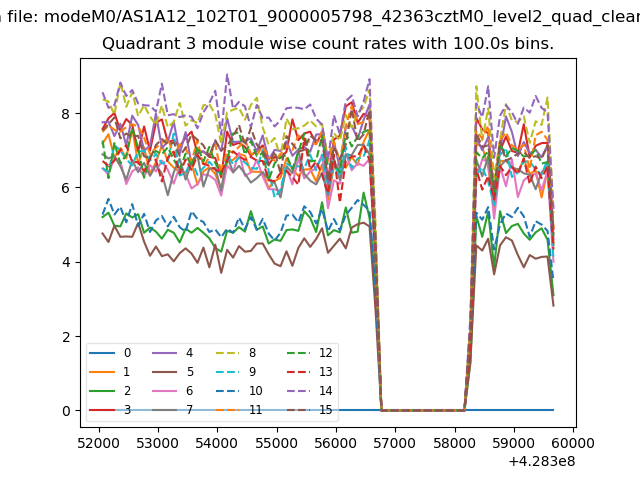
| Module-wise count rates for Quadrant A Data is divided into 100 sec bins |
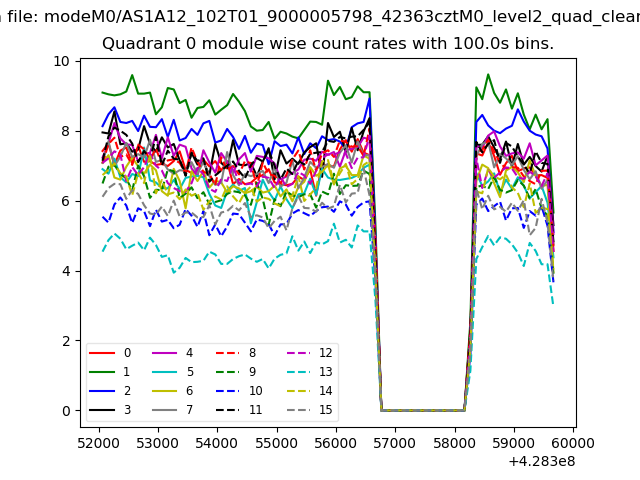 |
 |
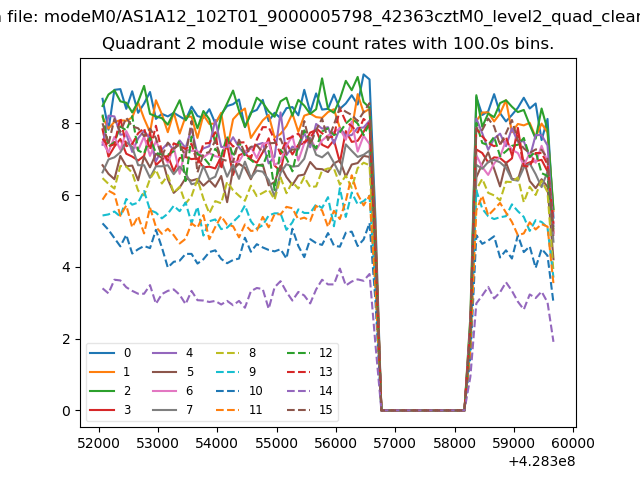
| Module-wise count rates for Quadrant B Data is divided into 100 sec bins |
 |
 |
| Module-wise count rates for Quadrant C Data is divided into 100 sec bins |
 |
 |
| Module-wise count rates for Quadrant D Data is divided into 100 sec bins |
 |
 |
| Parameter | Plot |
|---|---|
| CZT HV Monitor | 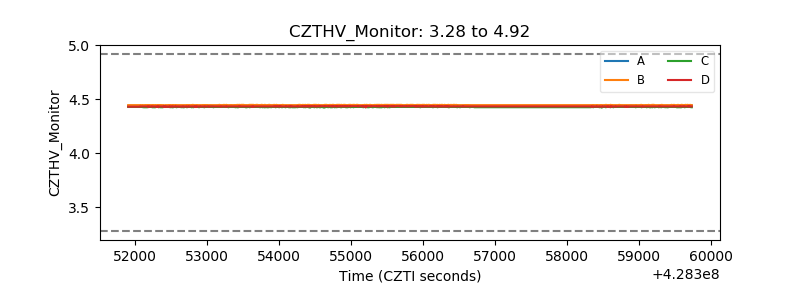 |
| D_VDD | 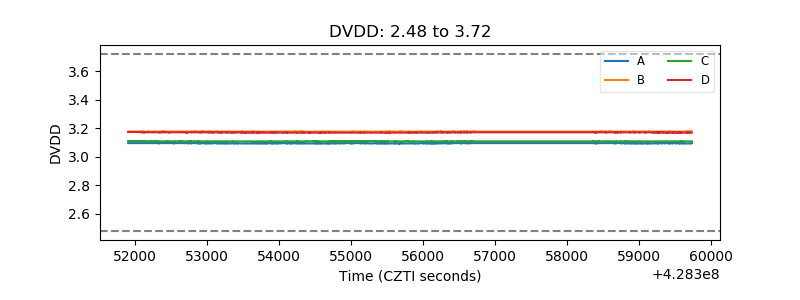 |
| Temperature 1 | 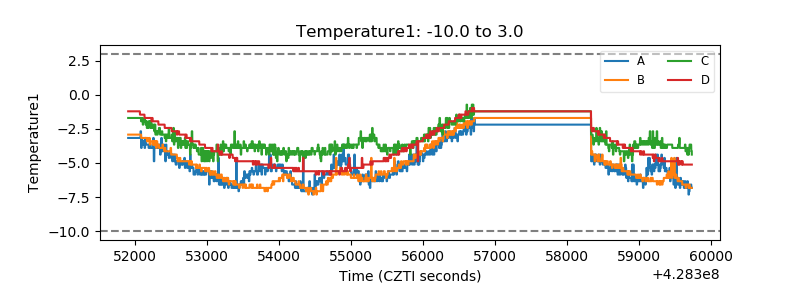 |
| Veto HV Monitor | 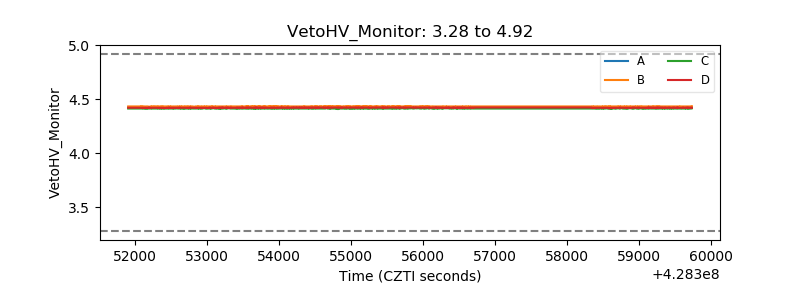 |
| Veto LLD | 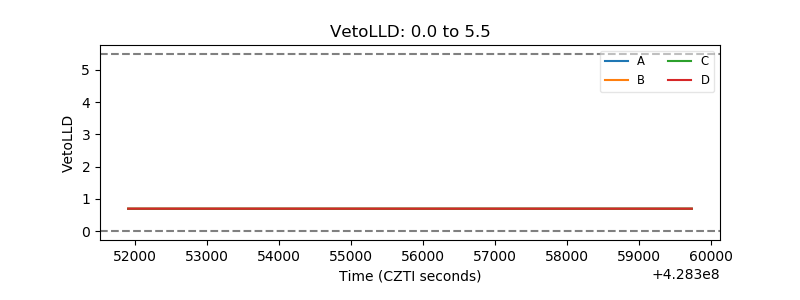 |
| Alpha Counter | 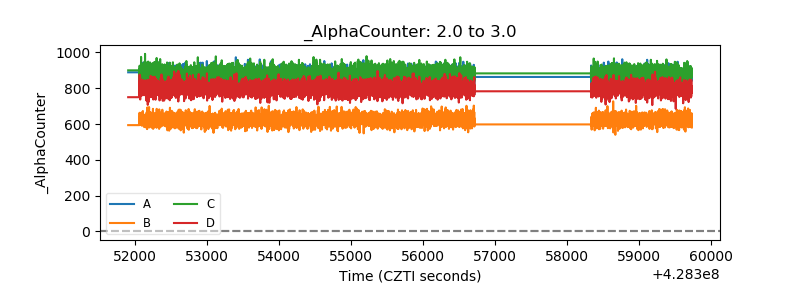 |
| _CPM_Rate | 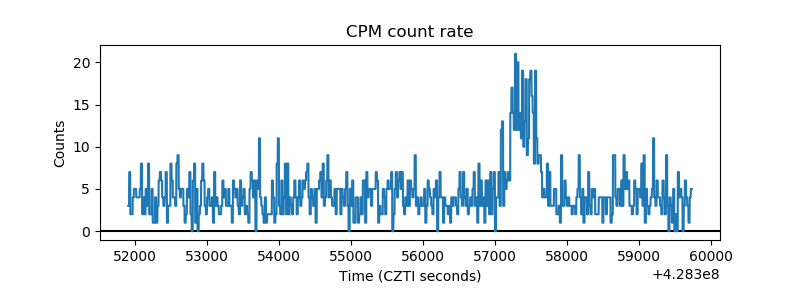 |
| CZT Counter | 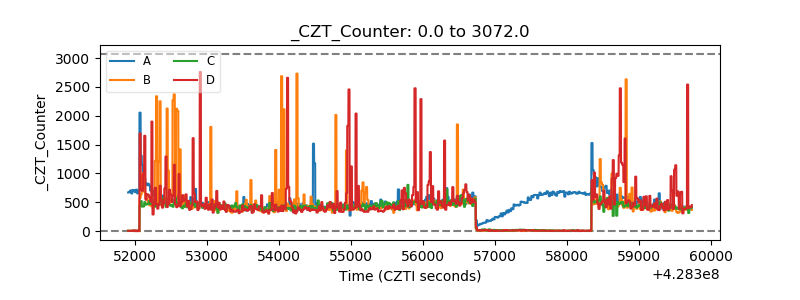 |
| +2.5 Volts monitor | 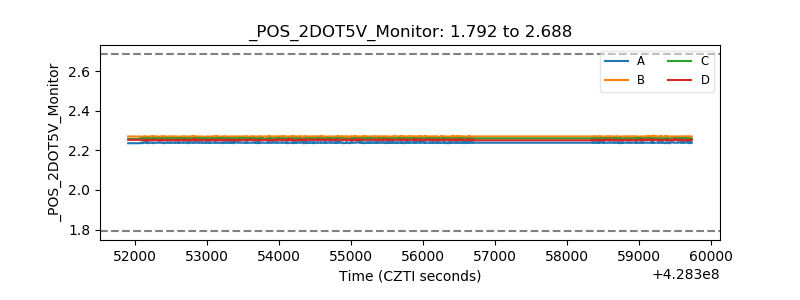 |
| +5 Volts monitor |  |
| _ROLL_ROT | 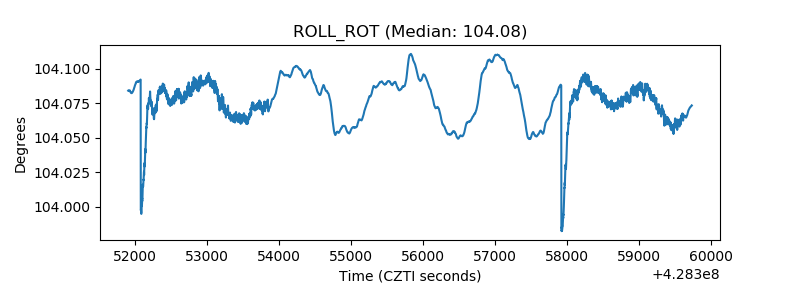 |
| _Roll_DEC |  |
| _Roll_RA | 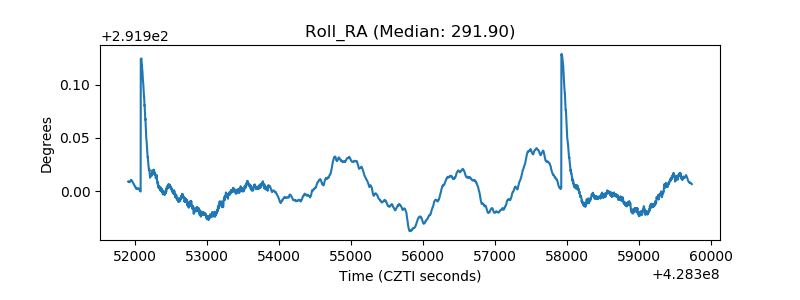 |
| Veto Counter | 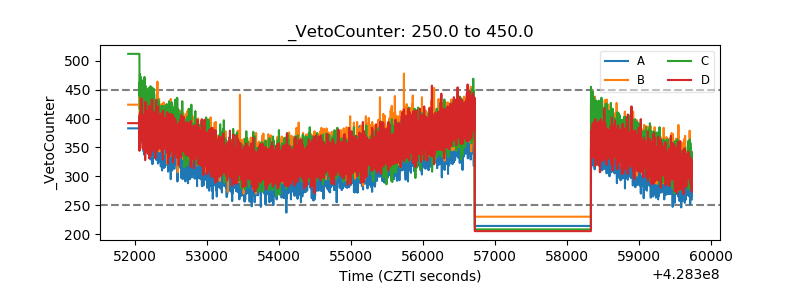 |