| Param | Original file | Final file |
|---|---|---|
| Filename | modeM0/AS1C06_010T01_9000005800_42363cztM0_level2.fits | modeM0/AS1C06_010T01_9000005800_42363cztM0_level2_quad_clean.evt |
| Size (bytes) | 278,965,440 | 64,702,080 |
| Size | 266.0 MB | 61.7 MB |
| Events in quadrant A | 2,060,005 | 432,251 |
| Events in quadrant B | 2,144,298 | 432,293 |
| Events in quadrant C | 1,832,820 | 431,451 |
| Events in quadrant D | 3,978,437 | 381,828 |
| Mode M9 | |||
|---|---|---|---|
| Quadrant | BADHDUFLAG | Total packets | Discarded packets |
| A | 0 | 13 | 0 |
| B | 0 | 13 | 0 |
| C | 0 | 13 | 0 |
| D | 0 | 13 | 0 |
| Mode M0 | |||
|---|---|---|---|
| Quadrant | BADHDUFLAG | Total packets | Discarded packets |
| A | 0 | 8642 | 2 |
| B | 0 | 9293 | 1 |
| C | 0 | 8080 | 1 |
| D | 0 | 14597 | 1 |
| Mode SS | |||
|---|---|---|---|
| Quadrant | BADHDUFLAG | Total packets | Discarded packets |
| A | 0 | 82 | 0 |
| B | 0 | 82 | 0 |
| C | 0 | 82 | 0 |
| D | 0 | 82 | 0 |
| Quadrant | Total seconds | Saturated seconds | Saturation percentage |
|---|---|---|---|
| A | 3984 | 9 | 0.225904% |
| B | 3984 | 108 | 2.710843% |
| C | 3984 | 2 | 0.050201% |
| D | 3984 | 298 | 7.479920% |
Noise dominated data is calculated using 1-second bins in cleaned event files. If a bin has >2000 counts, and if more than 50% of those come from <1% of pixels, then it is considered to be noise-dominated and hence unusable.
| Quadrant | # 1 sec bins | Bins with >0 counts | Bins with >2000 counts | High rate bins dominated by noise | Noise dominated (total time) | Noise dominated (detector-on time) | Marked lightcurve |
|---|---|---|---|---|---|---|---|
| A | 5326 | 3985 | 4 | 4 | 0.08% | 0.10% | 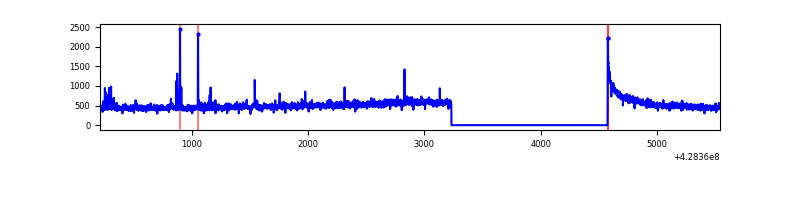 |
| B | 5326 | 3985 | 61 | 61 | 1.15% | 1.53% | 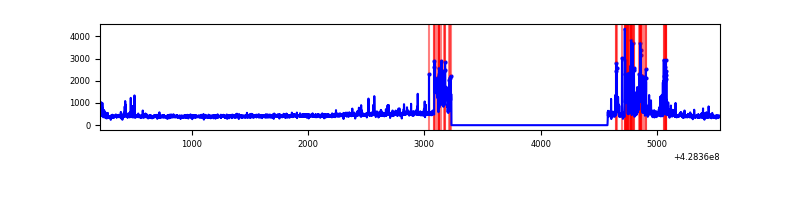 |
| C | 5326 | 3985 | 0 | 0 | 0.00% | 0.00% | 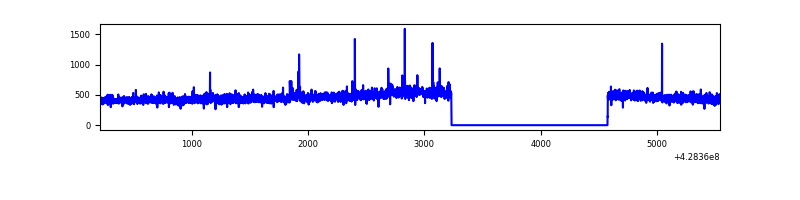 |
| D | 5326 | 3985 | 325 | 325 | 6.10% | 8.16% | 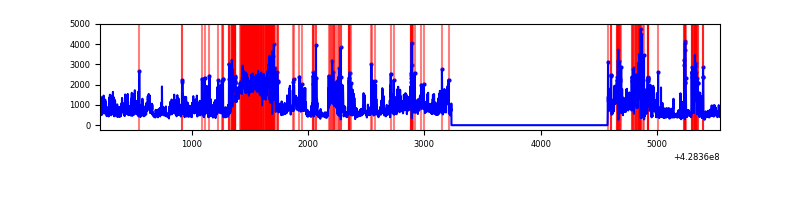 |
Top three noisy pixels from each quadrant. If the there are fewer than three noisy pixels in the level2.evt file, extra rows are filled as -1
| Pixel properties | Quadrant properties | ||||||
|---|---|---|---|---|---|---|---|
| Quadrant | DetID | PixID | Counts | Sigma | Mean | Median | Sigma |
| A | 10 | 83 | 352432 | 3997.48 | 428 | 419 | 88.1 |
| A | 13 | 248 | 40398 | 454.0 | 428 | 419 | 88.1 |
| A | 13 | 254 | 6672 | 71.01 | 428 | 419 | 88.1 |
| B | 5 | 255 | 265896 | 3194.34 | 420 | 408 | 83.1 |
| B | 4 | 81 | 109079 | 1307.52 | 420 | 408 | 83.1 |
| B | 3 | 112 | 37187 | 442.52 | 420 | 408 | 83.1 |
| C | 15 | 214 | 163959 | 1666.4 | 416 | 417 | 98.1 |
| C | 8 | 79 | 19383 | 193.25 | 416 | 417 | 98.1 |
| C | 2 | 16 | 8989 | 87.34 | 416 | 417 | 98.1 |
| D | 5 | 222 | 1386945 | 13715.89 | 409 | 396 | 101.1 |
| D | 1 | 52 | 595046 | 5882.34 | 409 | 396 | 101.1 |
| D | 13 | 249 | 252550 | 2494.33 | 409 | 396 | 101.1 |
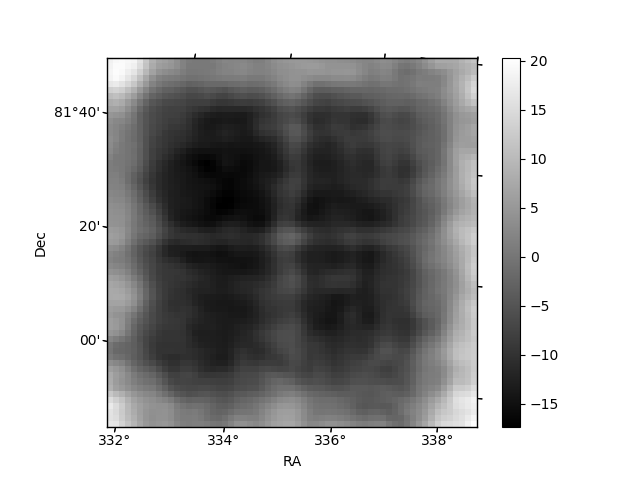
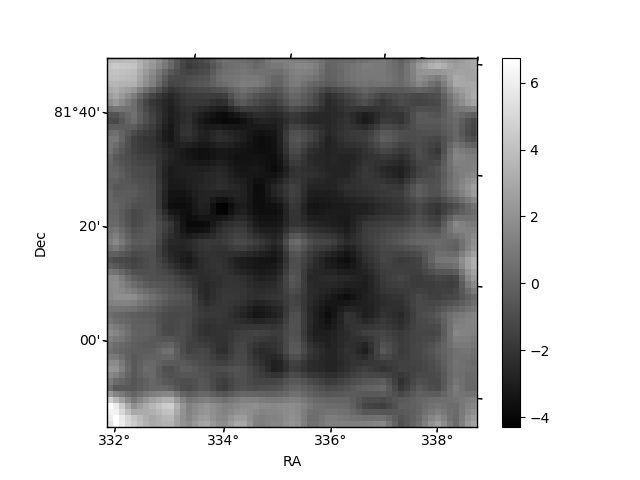
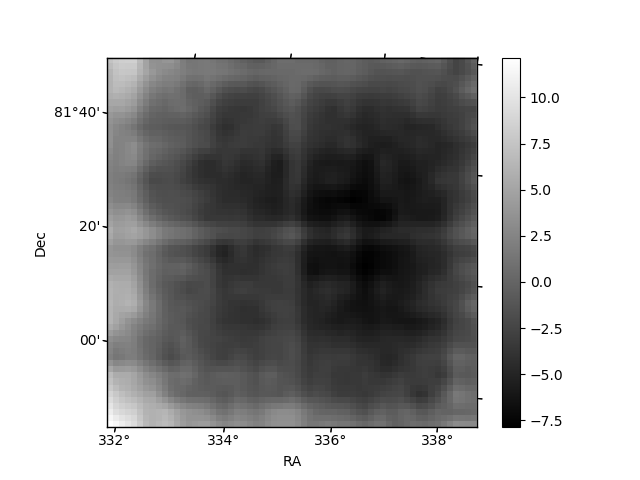
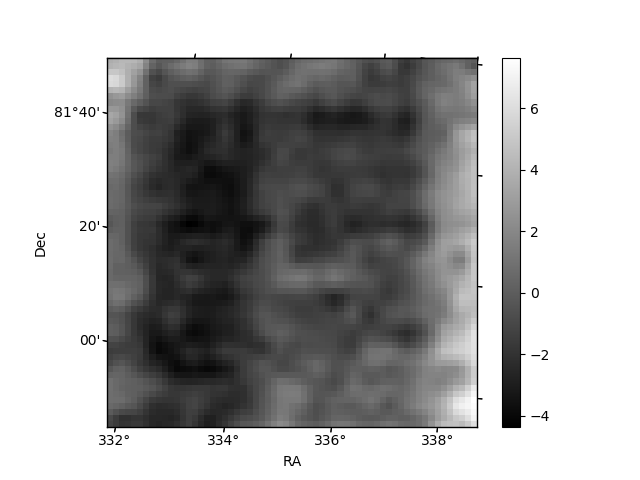
Histogram calculated using DETX and DETY for each event in the final _common_clean file
| Quadrant A | 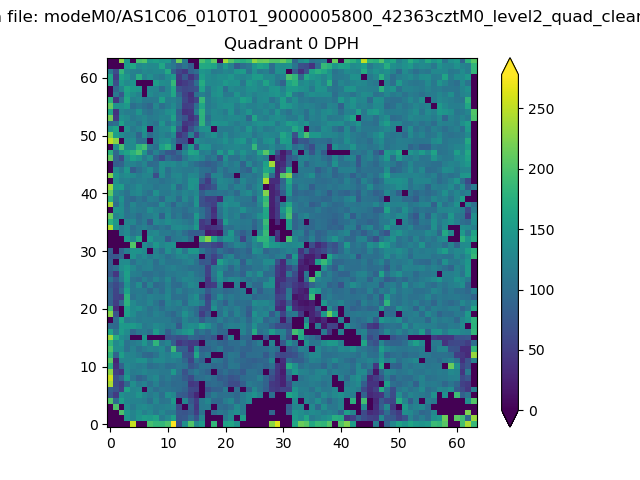 |
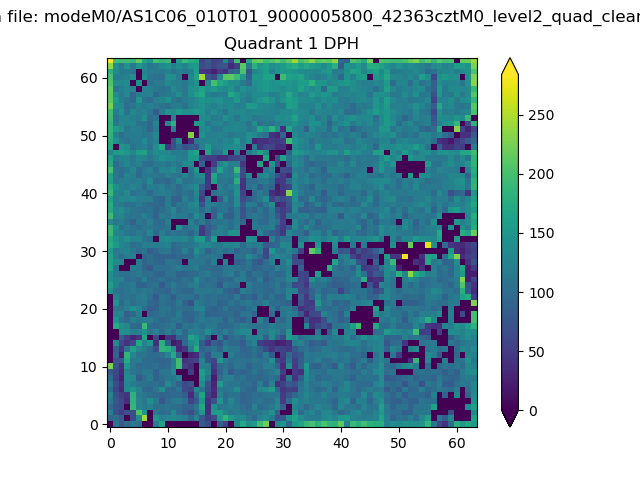 |
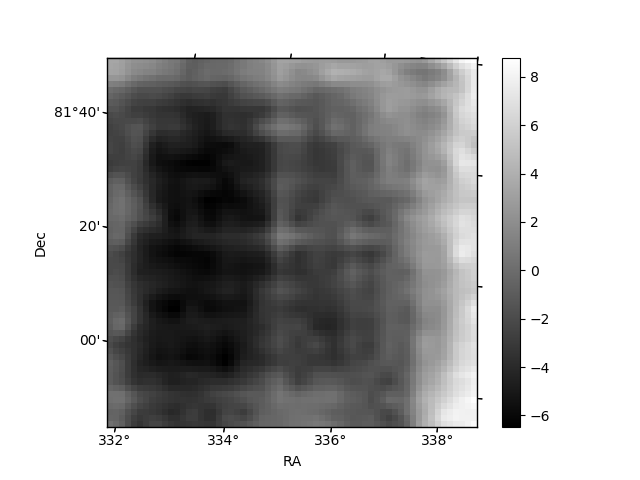
Quadrant B |
|---|---|---|---|
| Quadrant D |  |
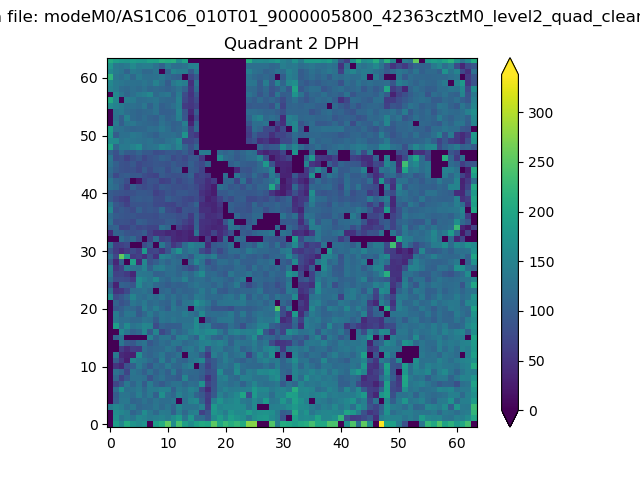 |
Quadrant C |
| Plot type | Count rate plots | Images |
|---|---|---|
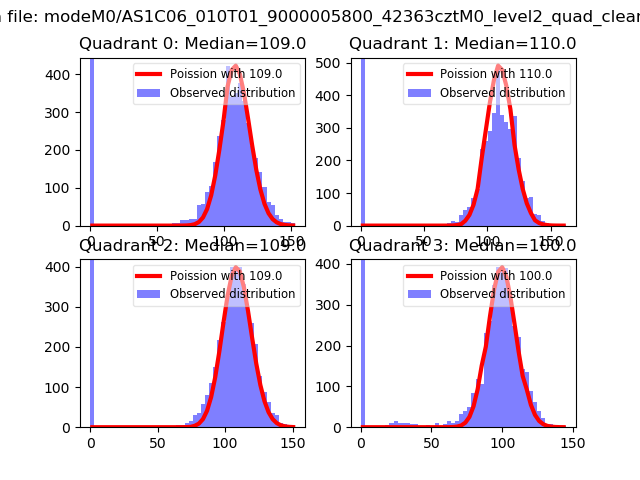
| Comparison with Poisson distribution Blue bars denote a histogram of data divided into 1 sec bins. Red curve is a Poisson curve with rate = median count rate of data. |
 |
 |
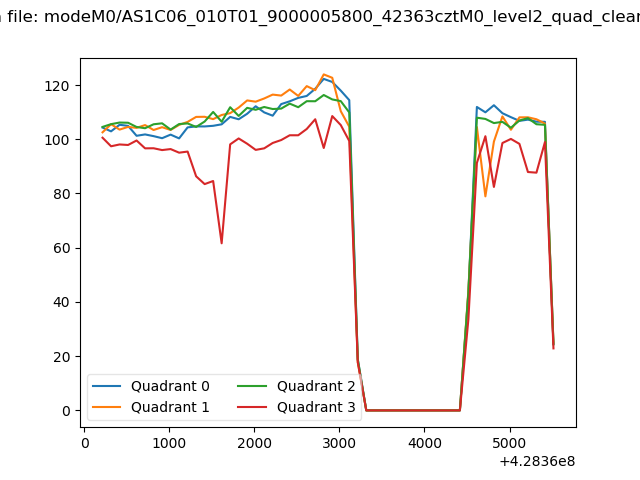
| Quadrant-wise count rates Data is divided into 100 sec bins |
 |
|
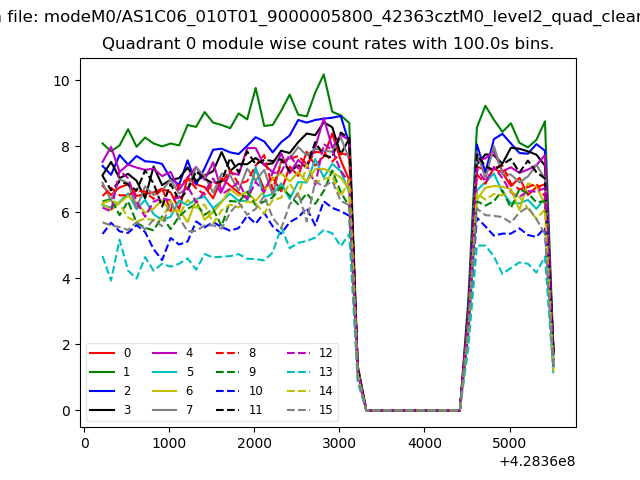
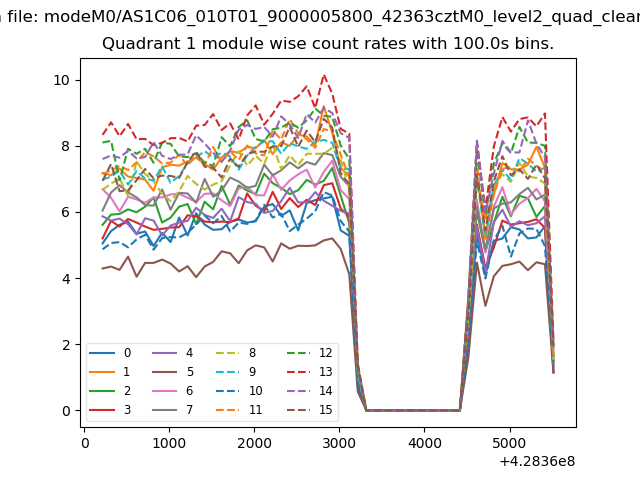
| Module-wise count rates for Quadrant A Data is divided into 100 sec bins |
 |
 |
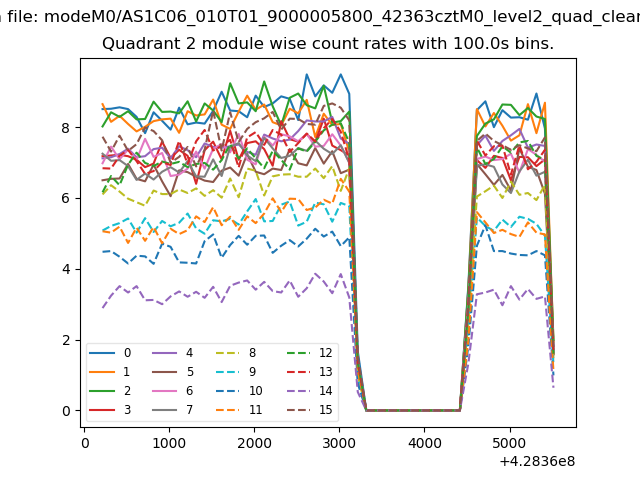
| Module-wise count rates for Quadrant B Data is divided into 100 sec bins |
 |
 |
| Module-wise count rates for Quadrant C Data is divided into 100 sec bins |
 |
 |
| Module-wise count rates for Quadrant D Data is divided into 100 sec bins |
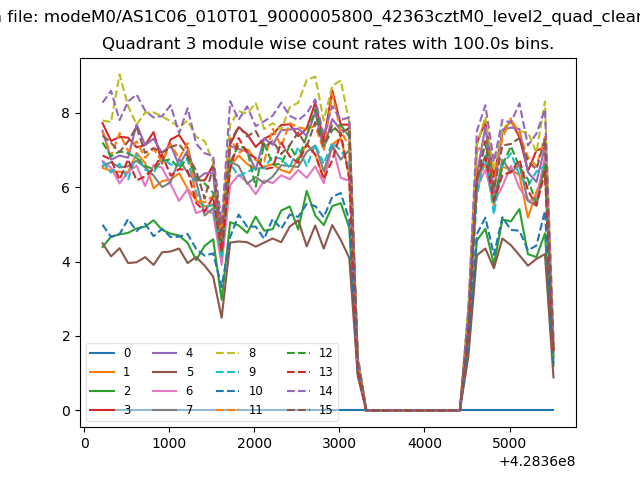 |
 |
| Parameter | Plot |
|---|---|
| CZT HV Monitor | 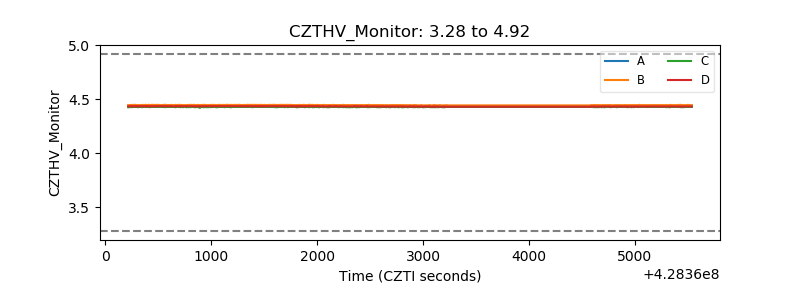 |
| D_VDD | 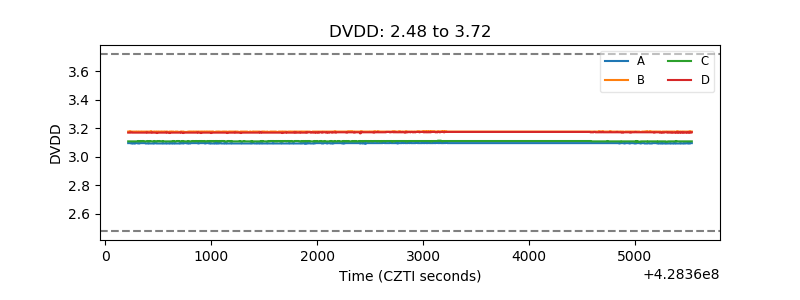 |
| Temperature 1 | 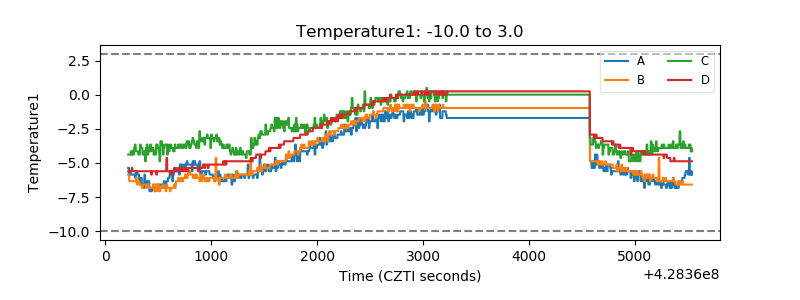 |
| Veto HV Monitor | 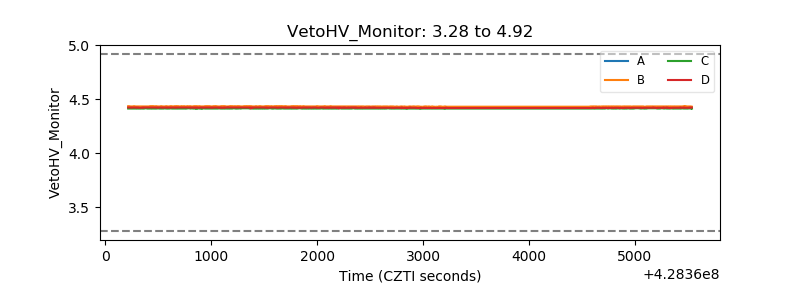 |
| Veto LLD | 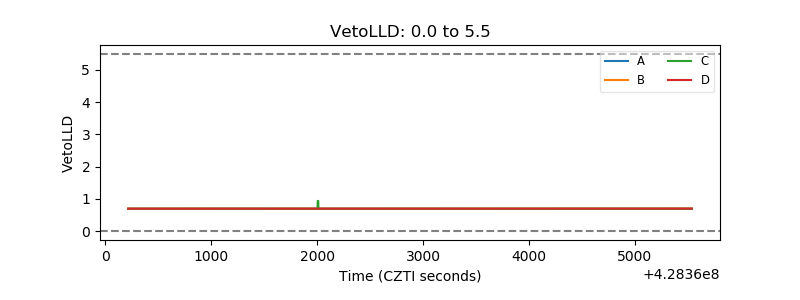 |
| Alpha Counter | 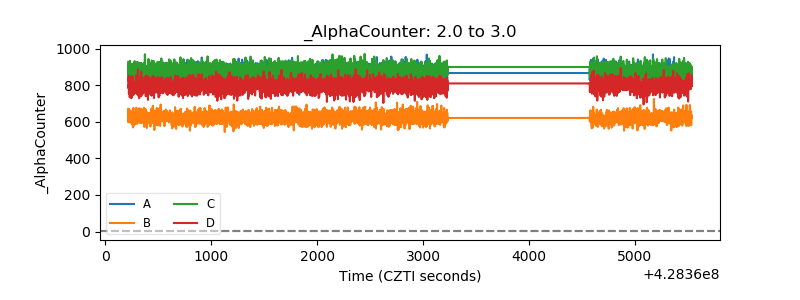 |
| _CPM_Rate | 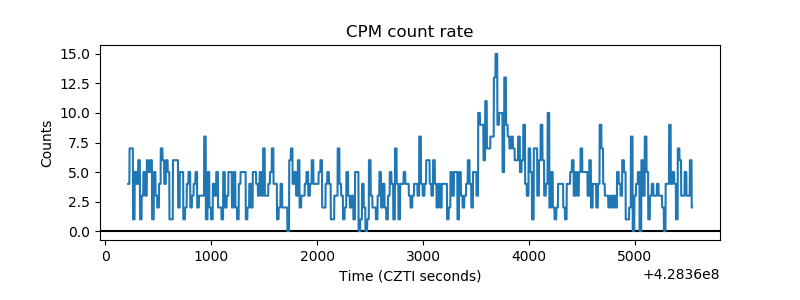 |
| CZT Counter | 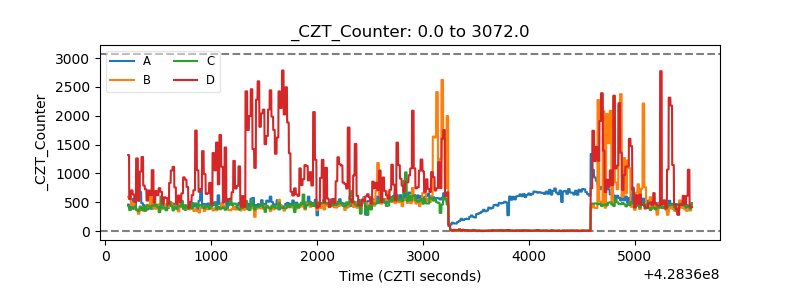 |
| +2.5 Volts monitor | 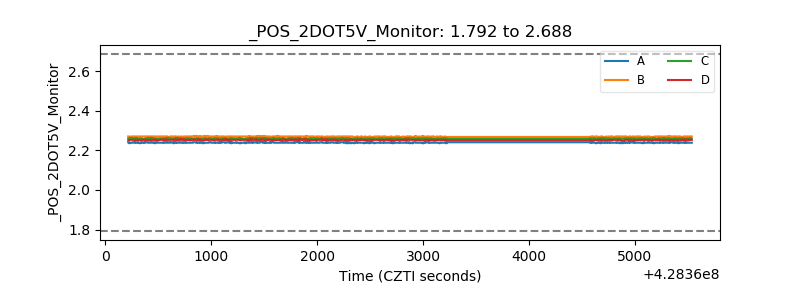 |
| +5 Volts monitor | 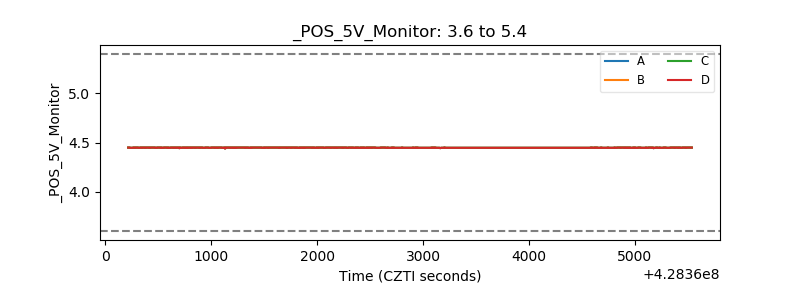 |
| _ROLL_ROT | 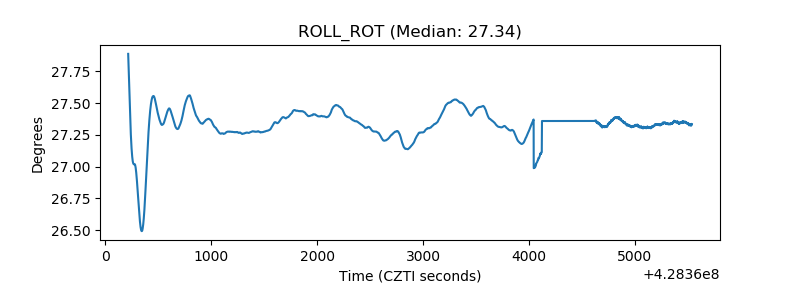 |
| _Roll_DEC | 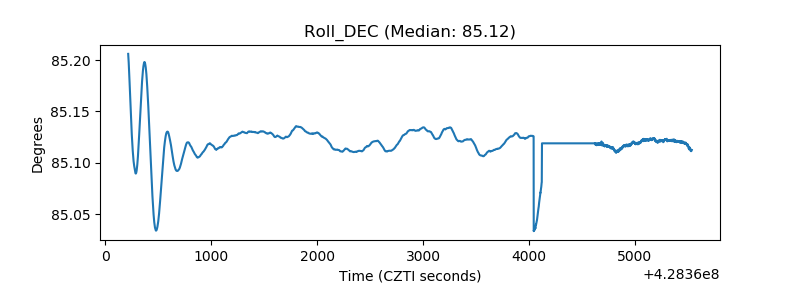 |
| _Roll_RA | 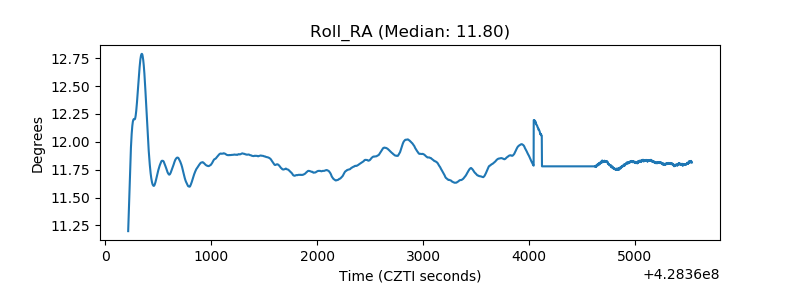 |
| Veto Counter | 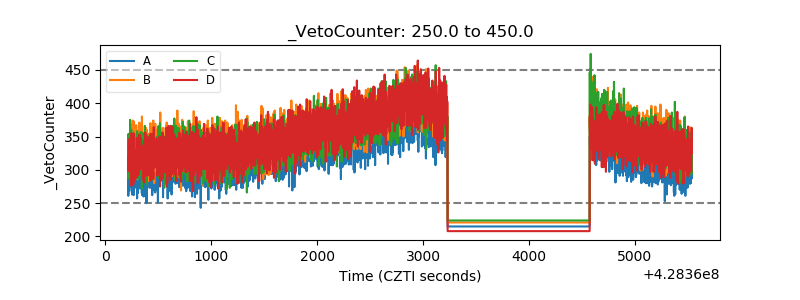 |