| Param | Original file | Final file |
|---|---|---|
| Filename | modeM0/AS1C06_010T01_9000005800_42364cztM0_level2.fits | modeM0/AS1C06_010T01_9000005800_42364cztM0_level2_quad_clean.evt |
| Size (bytes) | 376,067,520 | 96,192,000 |
| Size | 358.6 MB | 91.7 MB |
| Events in quadrant A | 3,089,580 | 643,161 |
| Events in quadrant B | 3,322,075 | 634,026 |
| Events in quadrant C | 2,718,056 | 640,309 |
| Events in quadrant D | 4,324,482 | 576,427 |
| Mode M9 | |||
|---|---|---|---|
| Quadrant | BADHDUFLAG | Total packets | Discarded packets |
| A | 0 | 20 | 0 |
| B | 0 | 21 | 0 |
| C | 0 | 21 | 0 |
| D | 0 | 21 | 0 |
| Mode M0 | |||
|---|---|---|---|
| Quadrant | BADHDUFLAG | Total packets | Discarded packets |
| A | 0 | 13030 | 2 |
| B | 0 | 14411 | 2 |
| C | 0 | 12134 | 2 |
| D | 0 | 17264 | 2 |
| Mode SS | |||
|---|---|---|---|
| Quadrant | BADHDUFLAG | Total packets | Discarded packets |
| A | 0 | 122 | 0 |
| B | 0 | 122 | 0 |
| C | 0 | 122 | 0 |
| D | 0 | 122 | 0 |
| Quadrant | Total seconds | Saturated seconds | Saturation percentage |
|---|---|---|---|
| A | 5992 | 10 | 0.166889% |
| B | 5992 | 211 | 3.521362% |
| C | 5992 | 7 | 0.116822% |
| D | 5992 | 328 | 5.473965% |
Noise dominated data is calculated using 1-second bins in cleaned event files. If a bin has >2000 counts, and if more than 50% of those come from <1% of pixels, then it is considered to be noise-dominated and hence unusable.
| Quadrant | # 1 sec bins | Bins with >0 counts | Bins with >2000 counts | High rate bins dominated by noise | Noise dominated (total time) | Noise dominated (detector-on time) | Marked lightcurve |
|---|---|---|---|---|---|---|---|
| A | 7275 | 5993 | 4 | 4 | 0.05% | 0.07% | 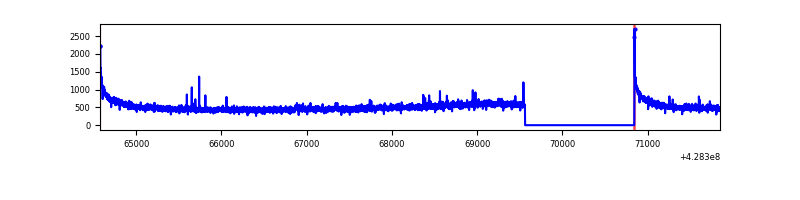 |
| B | 7275 | 5993 | 129 | 129 | 1.77% | 2.15% | 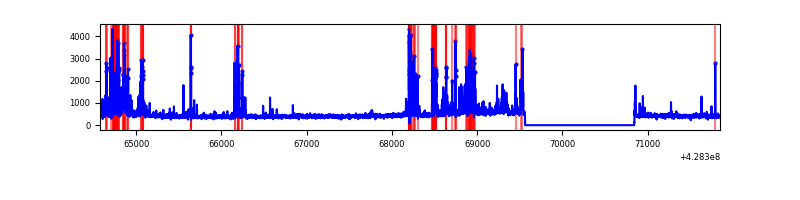 |
| C | 7275 | 5993 | 4 | 4 | 0.05% | 0.07% | 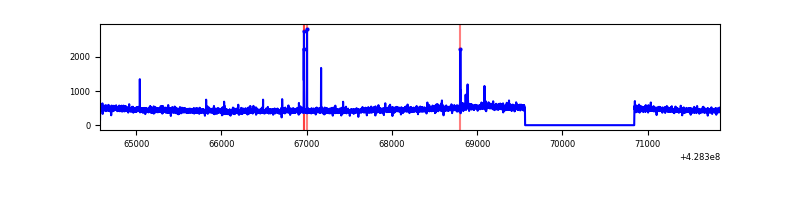 |
| D | 7275 | 5993 | 270 | 270 | 3.71% | 4.51% | 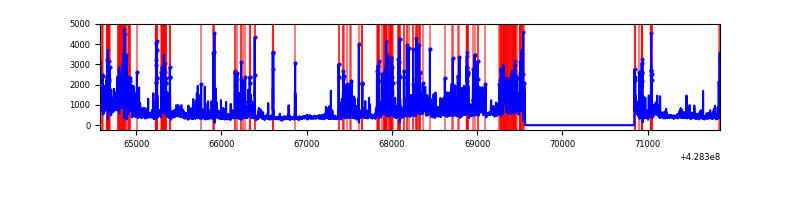 |
Top three noisy pixels from each quadrant. If the there are fewer than three noisy pixels in the level2.evt file, extra rows are filled as -1
| Pixel properties | Quadrant properties | ||||||
|---|---|---|---|---|---|---|---|
| Quadrant | DetID | PixID | Counts | Sigma | Mean | Median | Sigma |
| A | 10 | 83 | 593756 | 4583.06 | 630 | 616 | 129.4 |
| A | 2 | 79 | 26992 | 203.8 | 630 | 616 | 129.4 |
| A | 13 | 248 | 12669 | 93.13 | 630 | 616 | 129.4 |
| B | 5 | 255 | 623791 | 5211.75 | 618 | 599 | 119.6 |
| B | 0 | 230 | 47101 | 388.9 | 618 | 599 | 119.6 |
| B | 0 | 245 | 42613 | 351.36 | 618 | 599 | 119.6 |
| C | 15 | 214 | 251113 | 1729.14 | 621 | 624 | 144.9 |
| C | 15 | 111 | 23984 | 161.26 | 621 | 624 | 144.9 |
| C | 8 | 79 | 10713 | 69.64 | 621 | 624 | 144.9 |
| D | 1 | 52 | 800622 | 5323.57 | 610 | 591 | 150.3 |
| D | 13 | 249 | 342400 | 2274.47 | 610 | 591 | 150.3 |
| D | 12 | 233 | 224740 | 1491.53 | 610 | 591 | 150.3 |
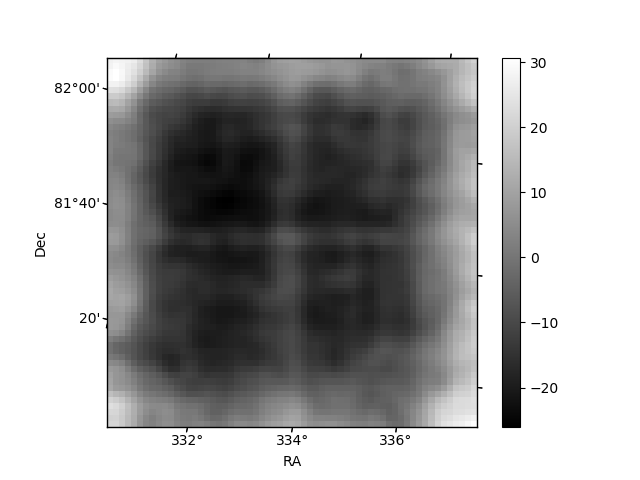
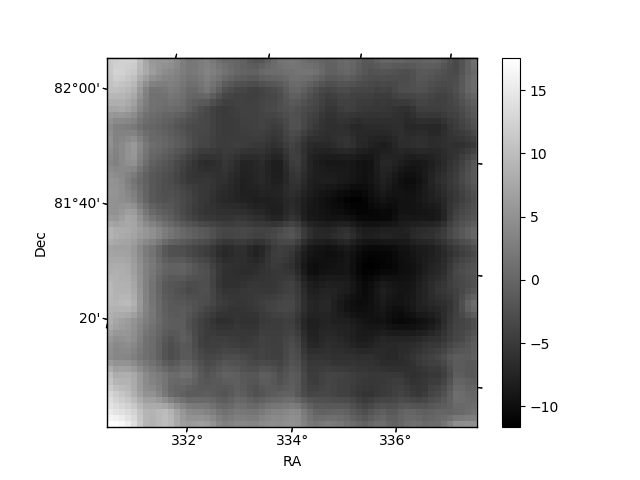
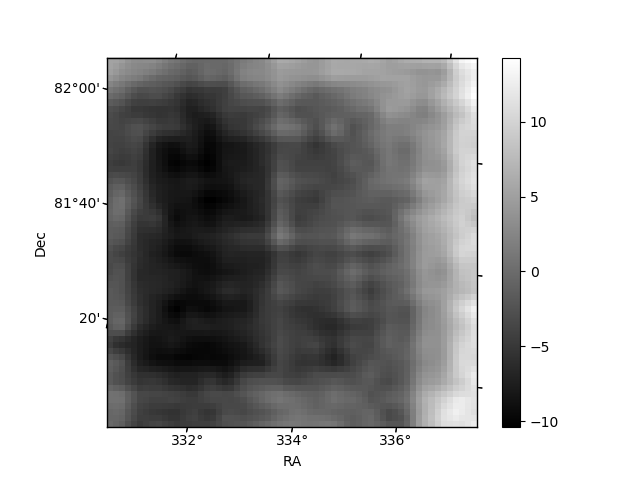
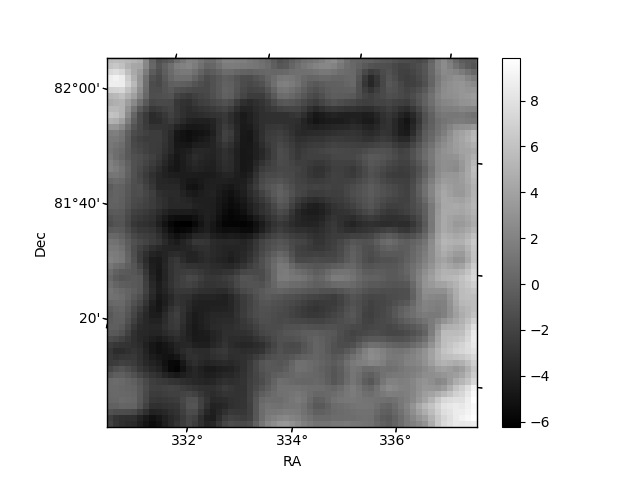
Histogram calculated using DETX and DETY for each event in the final _common_clean file
| Quadrant A | 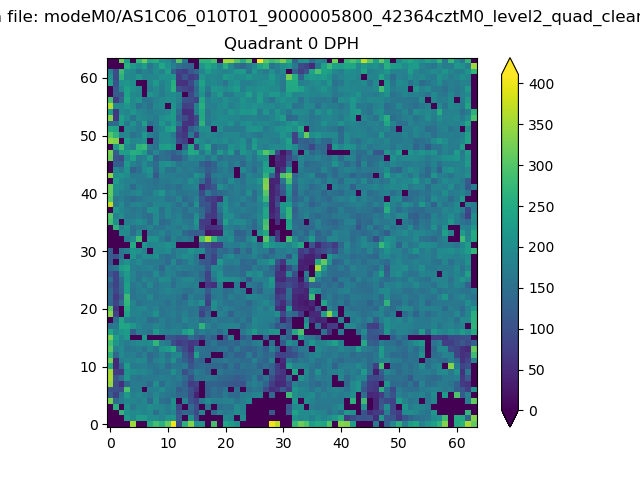 |
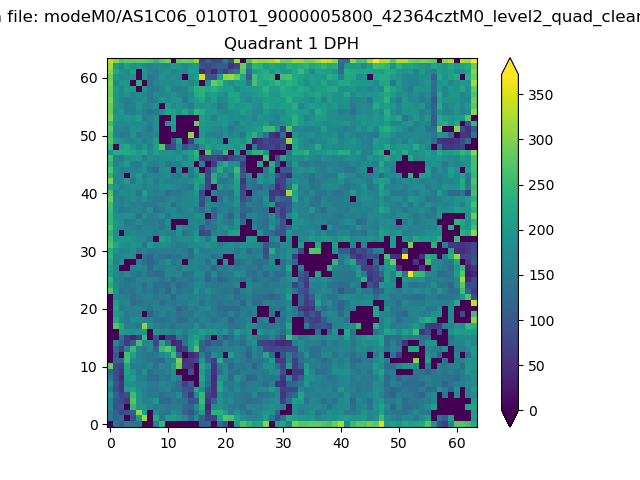 |
Quadrant B |
|---|---|---|---|
| Quadrant D | 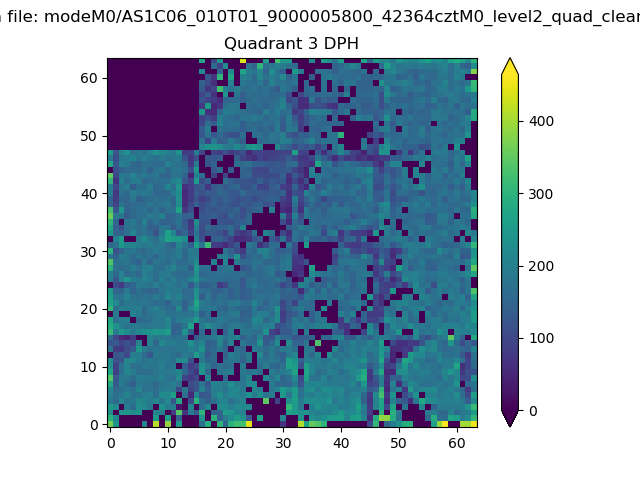 |
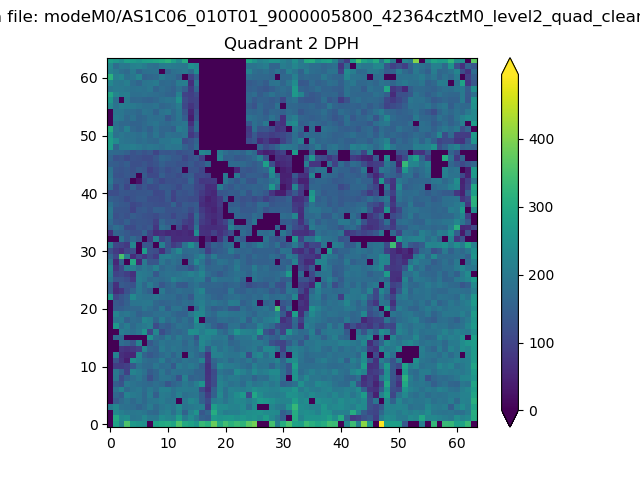 |
Quadrant C |
| Plot type | Count rate plots | Images |
|---|---|---|
| Comparison with Poisson distribution Blue bars denote a histogram of data divided into 1 sec bins. Red curve is a Poisson curve with rate = median count rate of data. |
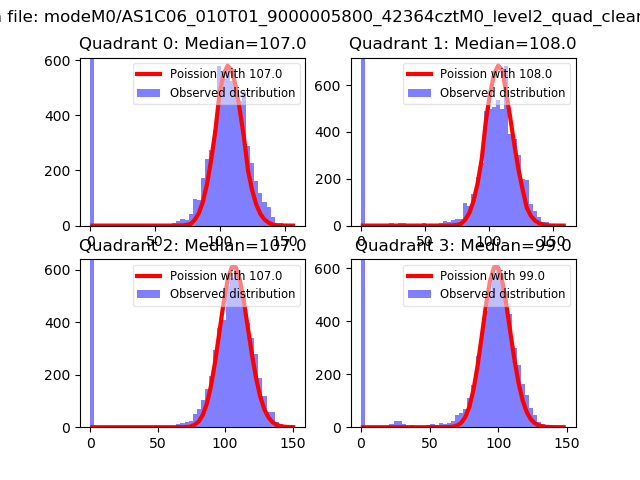 |
 |
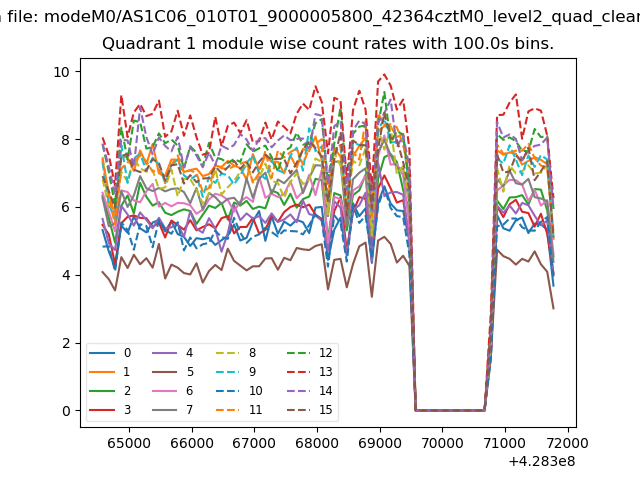
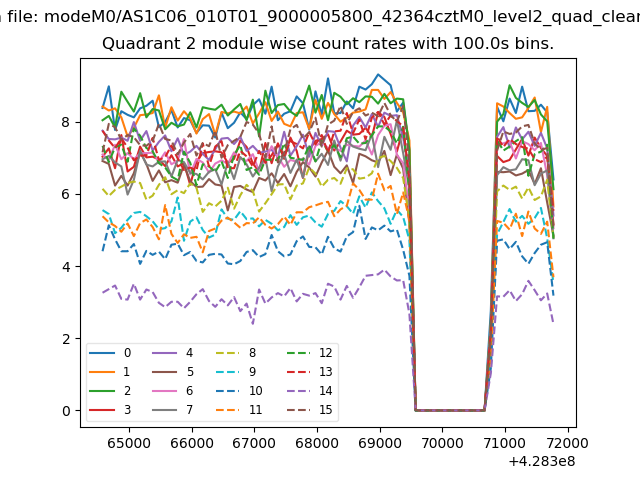
| Quadrant-wise count rates Data is divided into 100 sec bins |
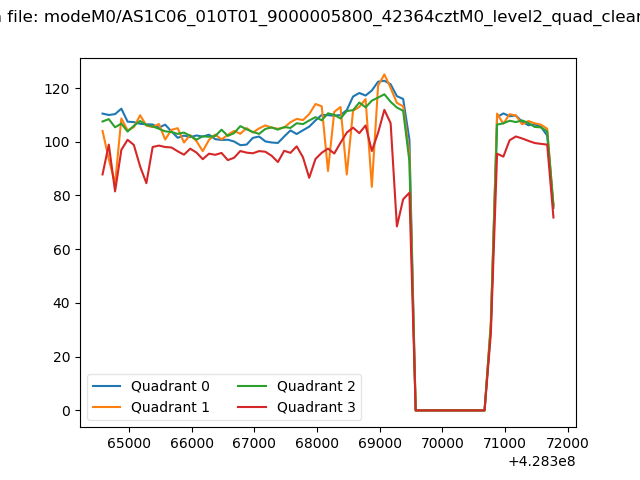 |
|
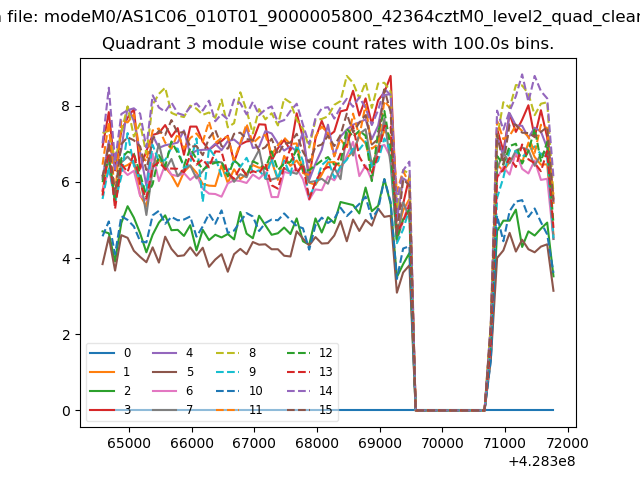
| Module-wise count rates for Quadrant A Data is divided into 100 sec bins |
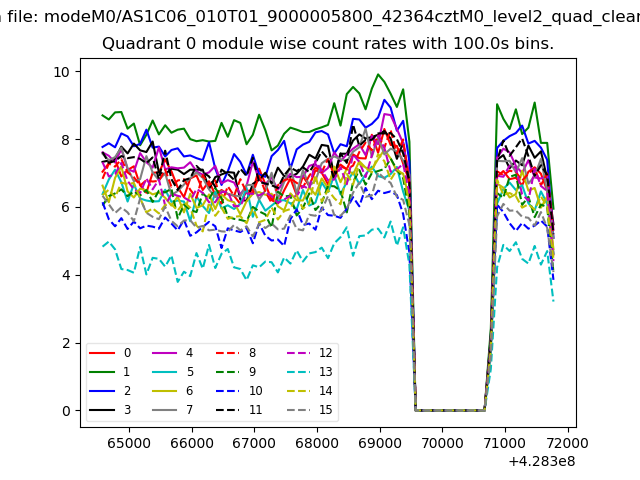 |
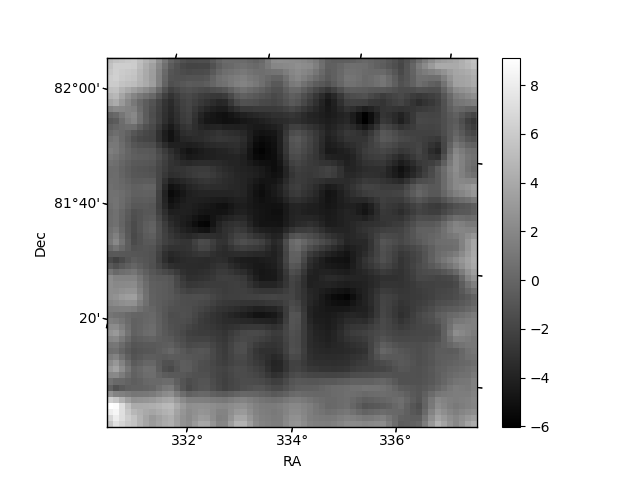 |
| Module-wise count rates for Quadrant B Data is divided into 100 sec bins |
 |
 |
| Module-wise count rates for Quadrant C Data is divided into 100 sec bins |
 |
 |
| Module-wise count rates for Quadrant D Data is divided into 100 sec bins |
 |
 |
| Parameter | Plot |
|---|---|
| CZT HV Monitor | 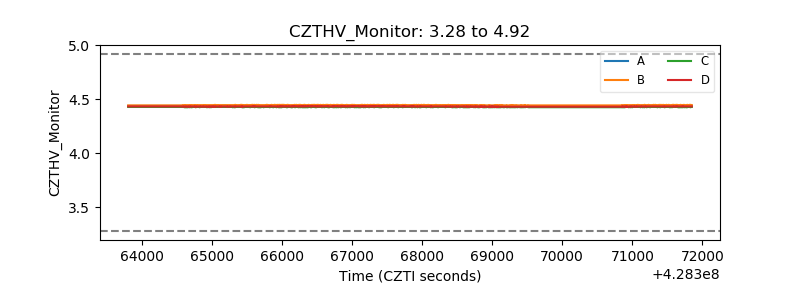 |
| D_VDD | 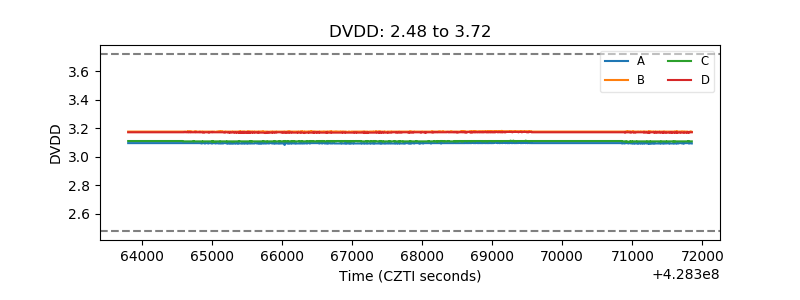 |
| Temperature 1 | 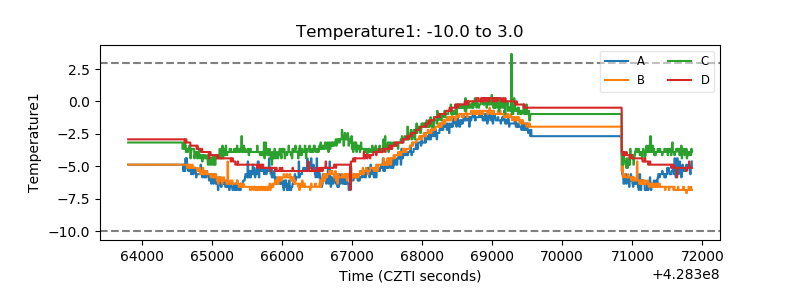 |
| Veto HV Monitor | 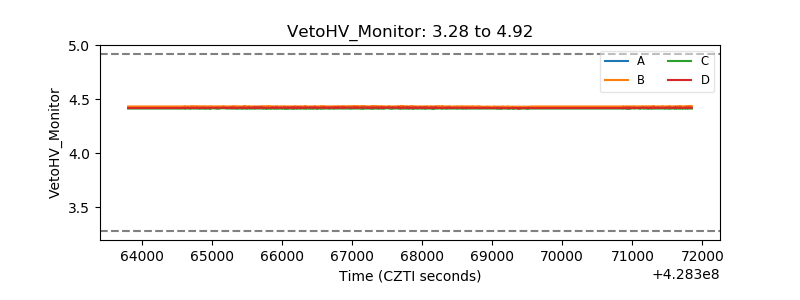 |
| Veto LLD | 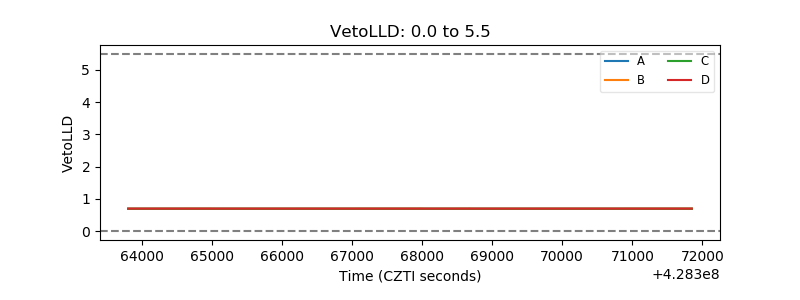 |
| Alpha Counter | 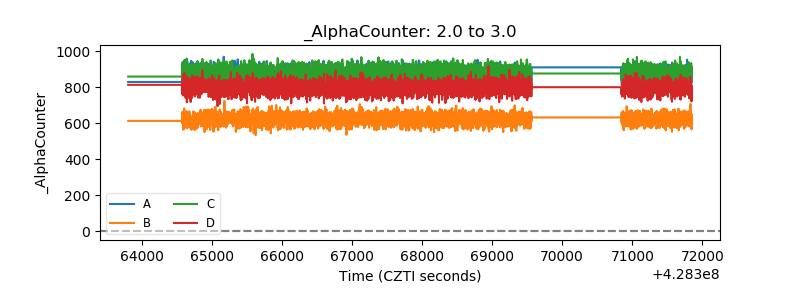 |
| _CPM_Rate | 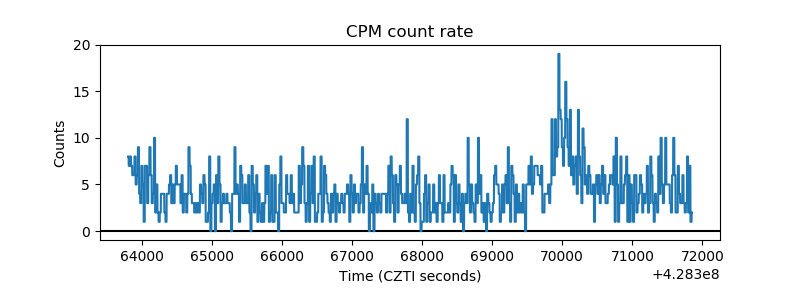 |
| CZT Counter | 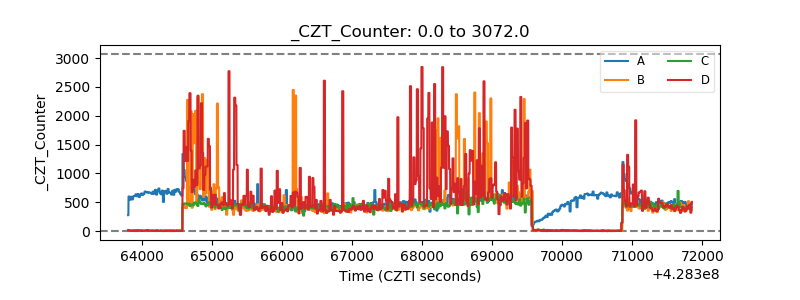 |
| +2.5 Volts monitor | 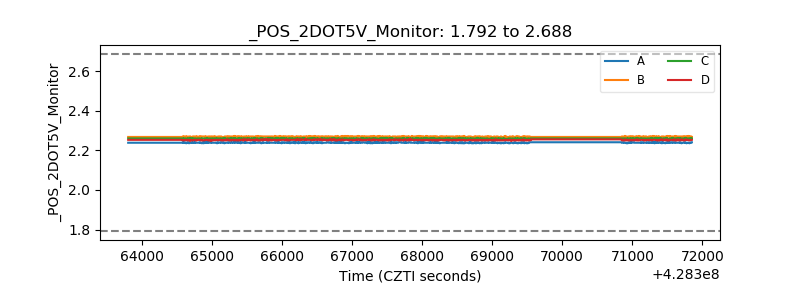 |
| +5 Volts monitor | 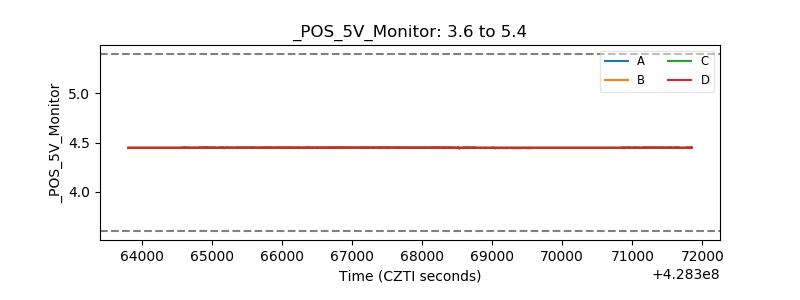 |
| _ROLL_ROT | 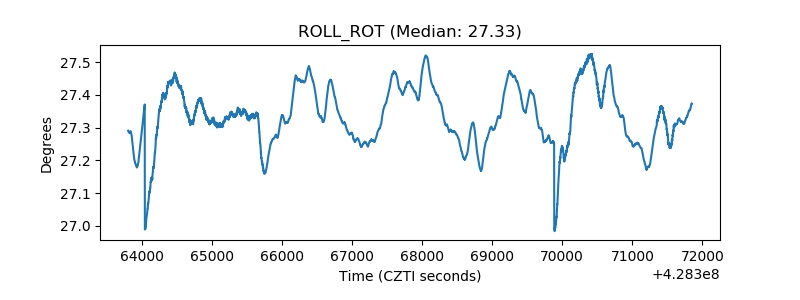 |
| _Roll_DEC | 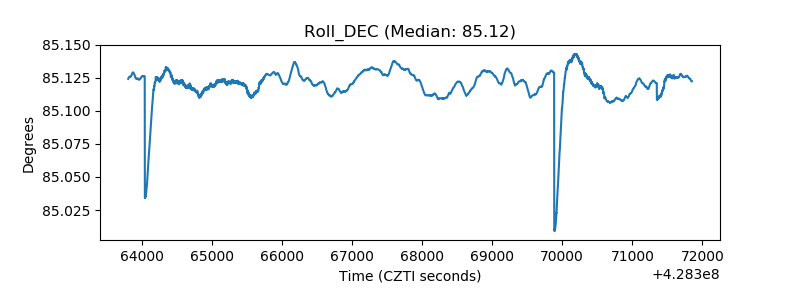 |
| _Roll_RA | 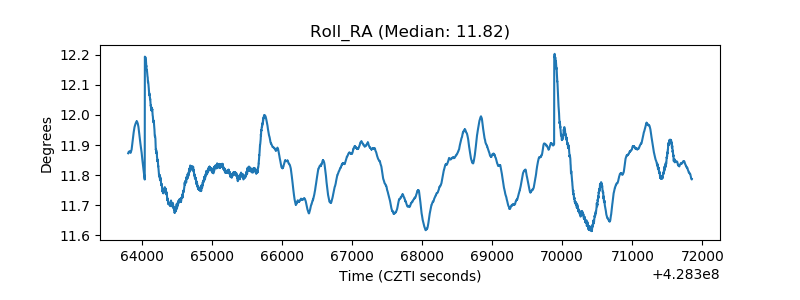 |
| Veto Counter | 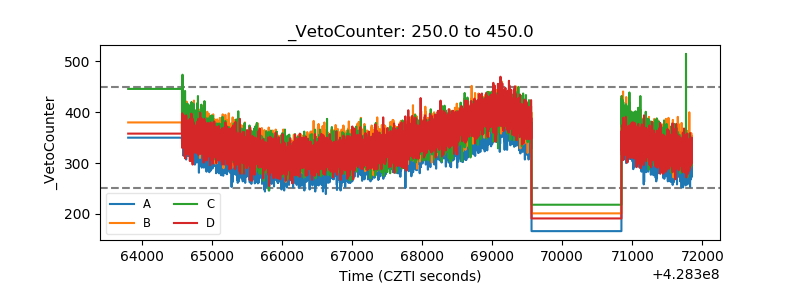 |