| Param | Original file | Final file |
|---|---|---|
| Filename | modeM0/AS1C06_010T01_9000005800_42366cztM0_level2.fits | modeM0/AS1C06_010T01_9000005800_42366cztM0_level2_quad_clean.evt |
| Size (bytes) | 350,654,400 | 98,009,280 |
| Size | 334.4 MB | 93.5 MB |
| Events in quadrant A | 3,235,303 | 646,424 |
| Events in quadrant B | 3,003,111 | 652,710 |
| Events in quadrant C | 2,784,640 | 645,745 |
| Events in quadrant D | 3,480,087 | 595,634 |
| Mode M9 | |||
|---|---|---|---|
| Quadrant | BADHDUFLAG | Total packets | Discarded packets |
| A | 0 | 27 | 0 |
| B | 0 | 27 | 0 |
| C | 0 | 27 | 0 |
| D | 0 | 27 | 0 |
| Mode M0 | |||
|---|---|---|---|
| Quadrant | BADHDUFLAG | Total packets | Discarded packets |
| A | 0 | 13534 | 2 |
| B | 0 | 13567 | 2 |
| C | 0 | 12481 | 2 |
| D | 0 | 14824 | 2 |
| Mode SS | |||
|---|---|---|---|
| Quadrant | BADHDUFLAG | Total packets | Discarded packets |
| A | 0 | 124 | 0 |
| B | 0 | 124 | 0 |
| C | 0 | 124 | 0 |
| D | 0 | 124 | 0 |
| Quadrant | Total seconds | Saturated seconds | Saturation percentage |
|---|---|---|---|
| A | 6123 | 11 | 0.179650% |
| B | 6123 | 34 | 0.555283% |
| C | 6124 | 4 | 0.065317% |
| D | 6124 | 144 | 2.351404% |
Noise dominated data is calculated using 1-second bins in cleaned event files. If a bin has >2000 counts, and if more than 50% of those come from <1% of pixels, then it is considered to be noise-dominated and hence unusable.
| Quadrant | # 1 sec bins | Bins with >0 counts | Bins with >2000 counts | High rate bins dominated by noise | Noise dominated (total time) | Noise dominated (detector-on time) | Marked lightcurve |
|---|---|---|---|---|---|---|---|
| A | 8718 | 6125 | 3 | 3 | 0.03% | 0.05% | 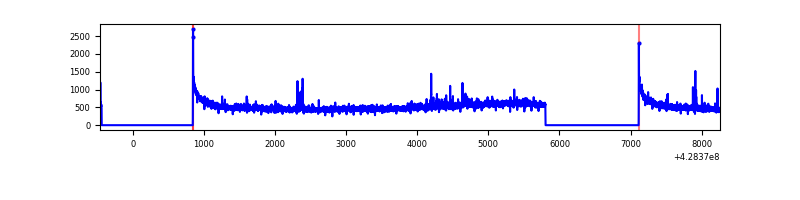 |
| B | 8718 | 6125 | 12 | 12 | 0.14% | 0.20% | 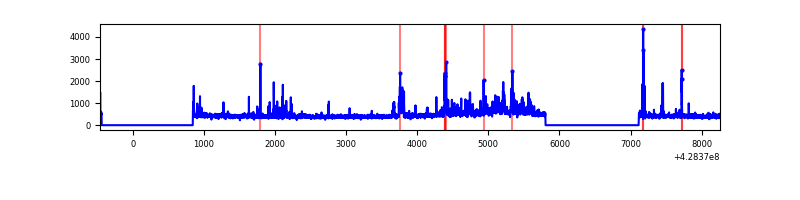 |
| C | 8719 | 6126 | 1 | 1 | 0.01% | 0.02% | 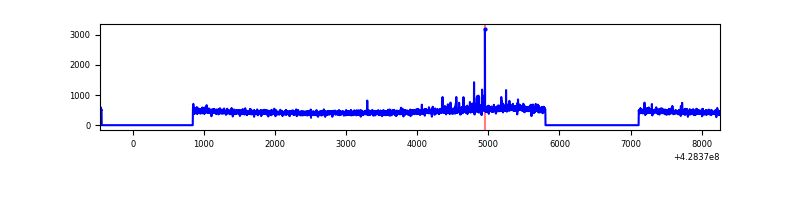 |
| D | 8719 | 6126 | 127 | 127 | 1.46% | 2.07% | 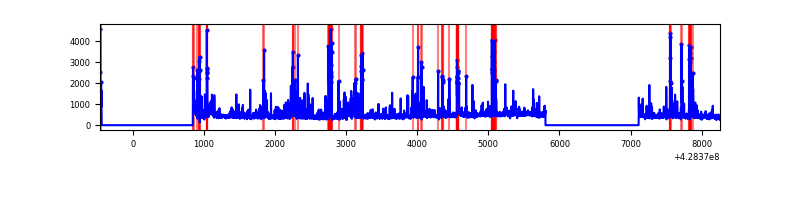 |
Top three noisy pixels from each quadrant. If the there are fewer than three noisy pixels in the level2.evt file, extra rows are filled as -1
| Pixel properties | Quadrant properties | ||||||
|---|---|---|---|---|---|---|---|
| Quadrant | DetID | PixID | Counts | Sigma | Mean | Median | Sigma |
| A | 10 | 83 | 629255 | 4752.7 | 647 | 633 | 132.3 |
| A | 2 | 79 | 33974 | 252.07 | 647 | 633 | 132.3 |
| A | 13 | 248 | 29481 | 218.11 | 647 | 633 | 132.3 |
| B | 0 | 189 | 101166 | 805.06 | 641 | 623 | 124.9 |
| B | 5 | 255 | 84689 | 673.13 | 641 | 623 | 124.9 |
| B | 3 | 112 | 52800 | 417.79 | 641 | 623 | 124.9 |
| C | 15 | 214 | 259828 | 1751.49 | 634 | 638 | 148.0 |
| C | 15 | 111 | 35993 | 238.91 | 634 | 638 | 148.0 |
| C | 12 | 249 | 9223 | 58.01 | 634 | 638 | 148.0 |
| D | 1 | 52 | 309583 | 2002.88 | 629 | 611 | 154.3 |
| D | 12 | 6 | 250155 | 1617.64 | 629 | 611 | 154.3 |
| D | 5 | 70 | 97400 | 627.42 | 629 | 611 | 154.3 |
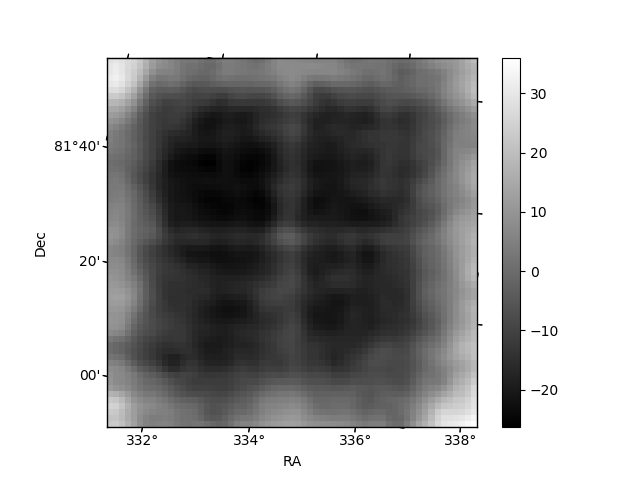
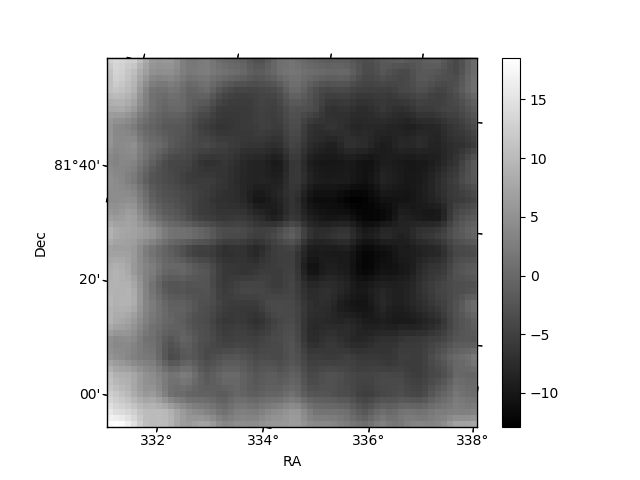
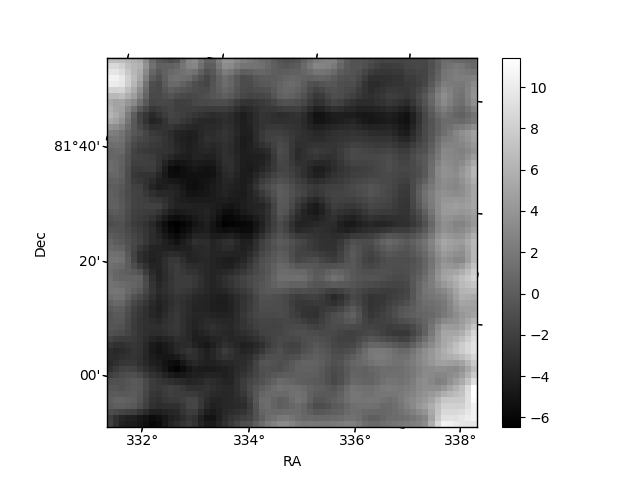
Histogram calculated using DETX and DETY for each event in the final _common_clean file
| Quadrant A | 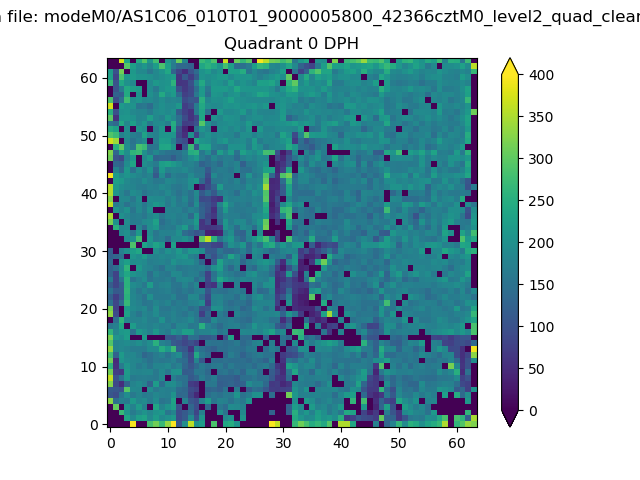 |
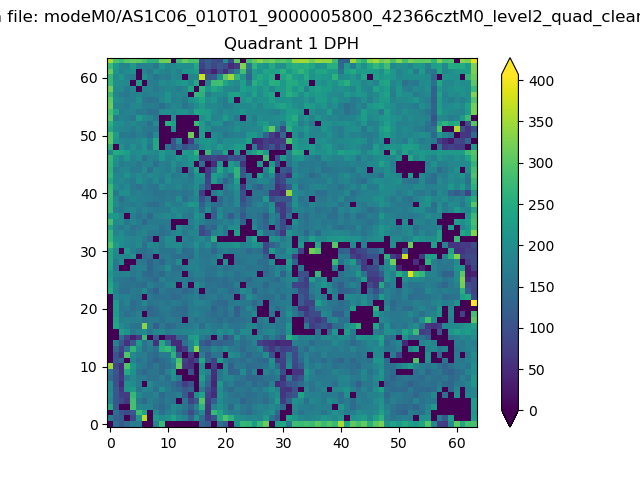 |
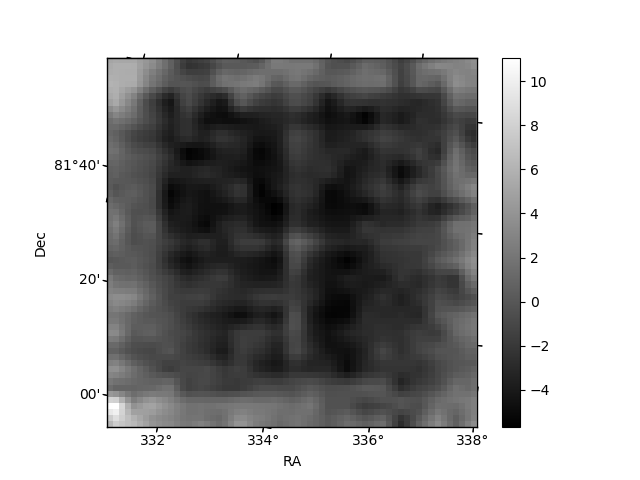
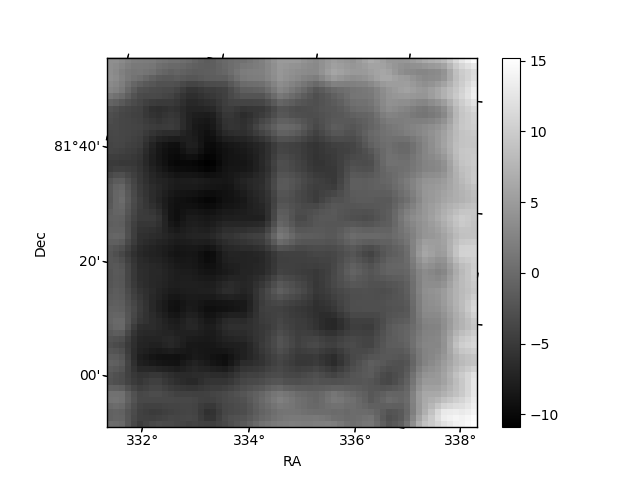
Quadrant B |
|---|---|---|---|
| Quadrant D |  |
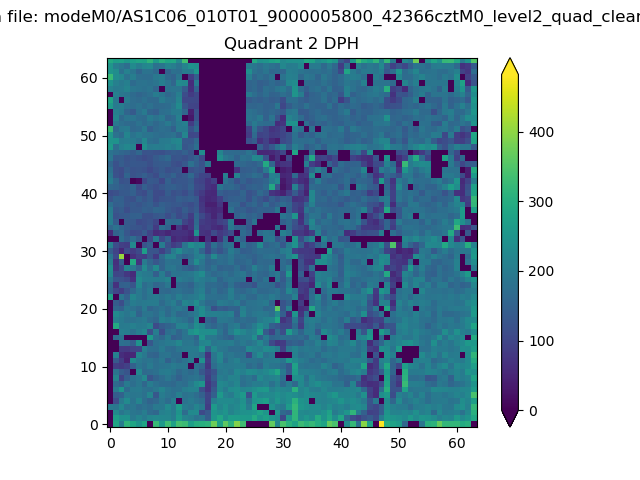 |
Quadrant C |
| Plot type | Count rate plots | Images |
|---|---|---|
| Comparison with Poisson distribution Blue bars denote a histogram of data divided into 1 sec bins. Red curve is a Poisson curve with rate = median count rate of data. |
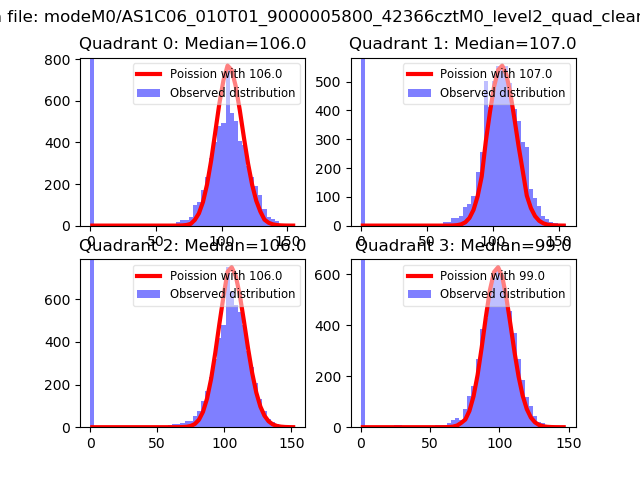 |
 |
| Quadrant-wise count rates Data is divided into 100 sec bins |
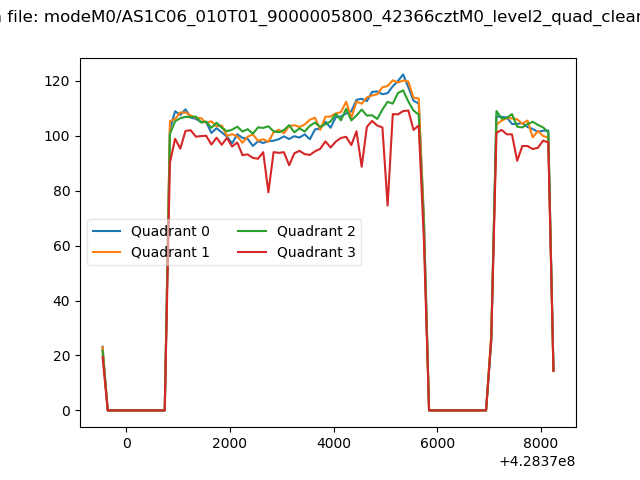 |
|
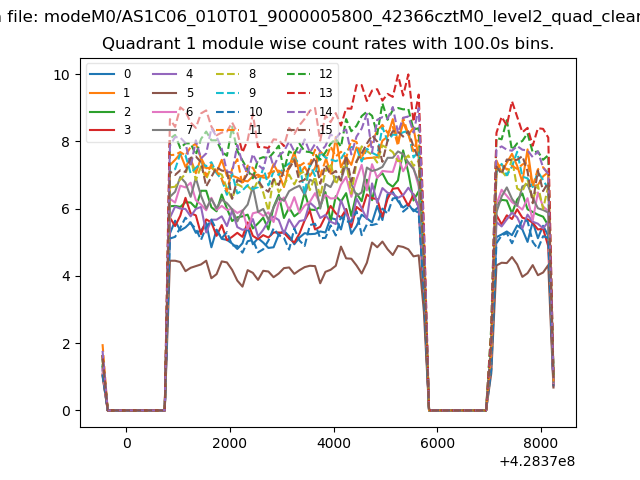
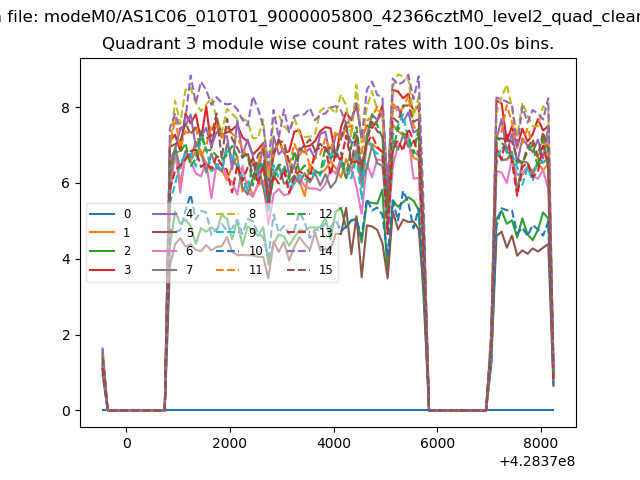
| Module-wise count rates for Quadrant A Data is divided into 100 sec bins |
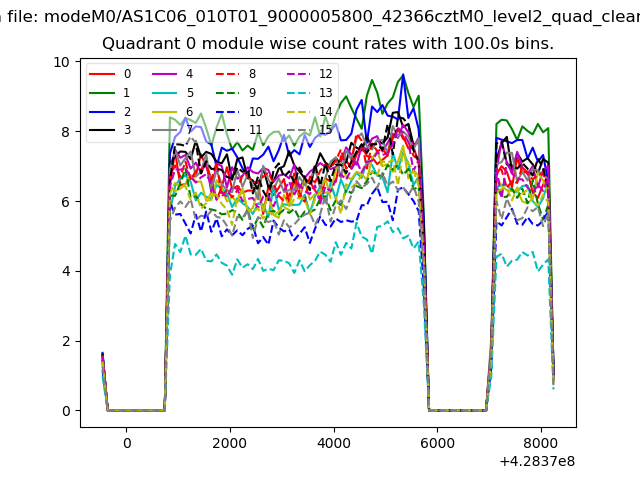 |
 |
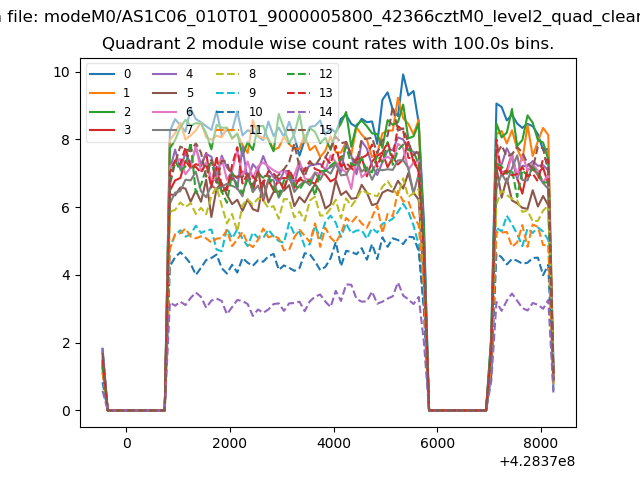
| Module-wise count rates for Quadrant B Data is divided into 100 sec bins |
 |
 |
| Module-wise count rates for Quadrant C Data is divided into 100 sec bins |
 |
 |
| Module-wise count rates for Quadrant D Data is divided into 100 sec bins |
 |
 |
| Parameter | Plot |
|---|---|
| CZT HV Monitor | 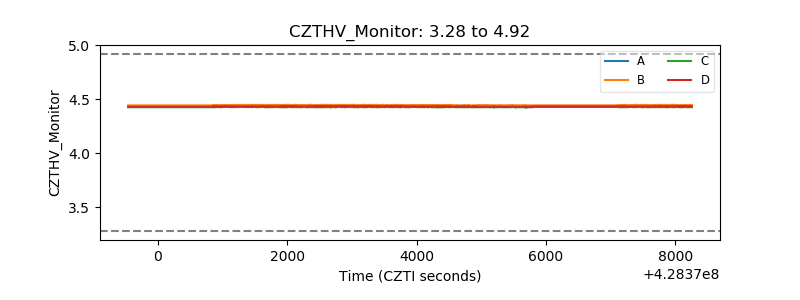 |
| D_VDD | 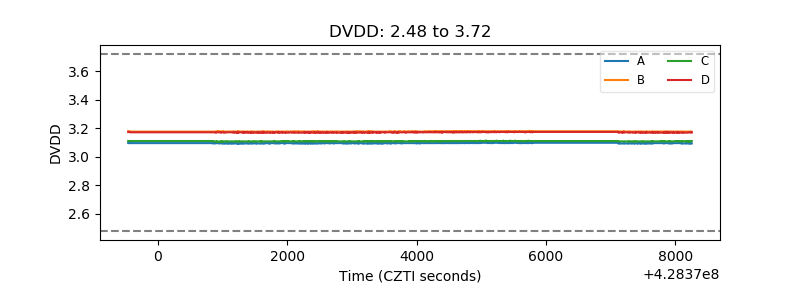 |
| Temperature 1 | 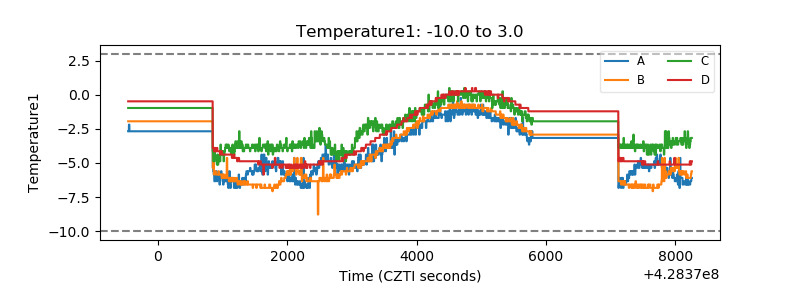 |
| Veto HV Monitor | 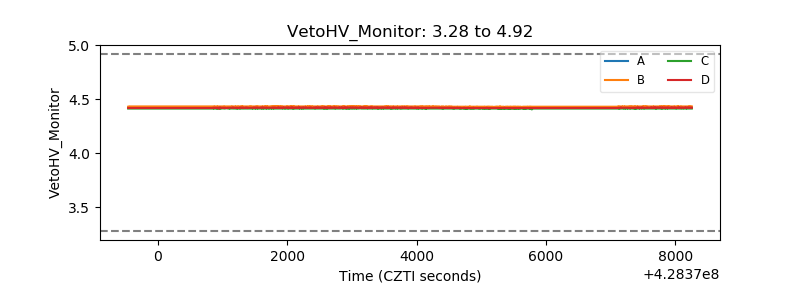 |
| Veto LLD | 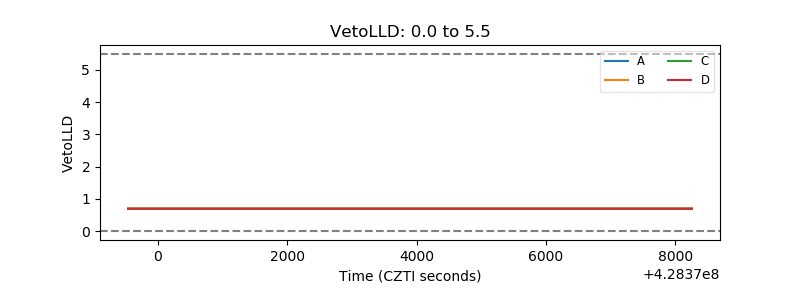 |
| Alpha Counter | 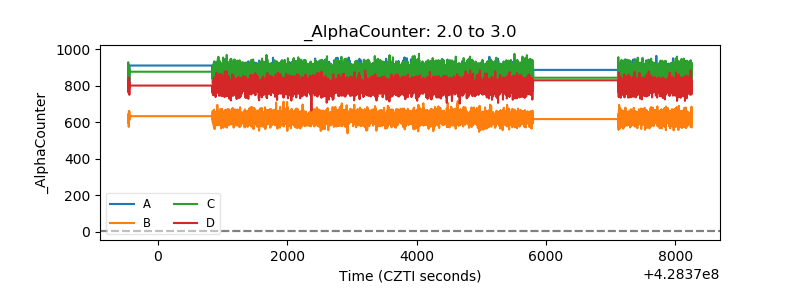 |
| _CPM_Rate | 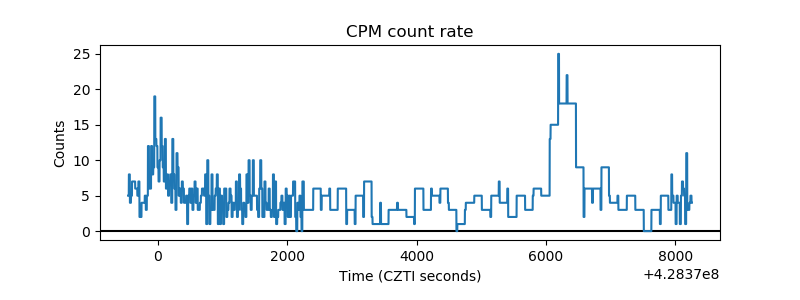 |
| CZT Counter | 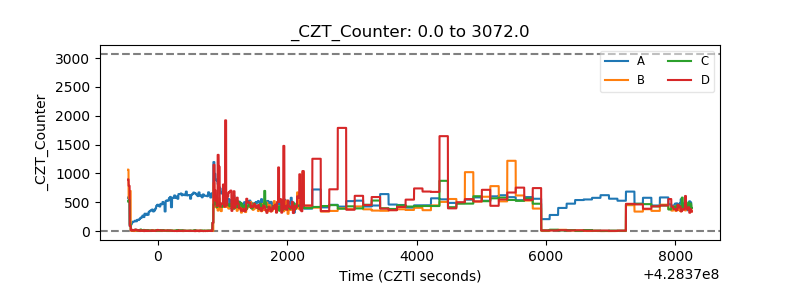 |
| +2.5 Volts monitor | 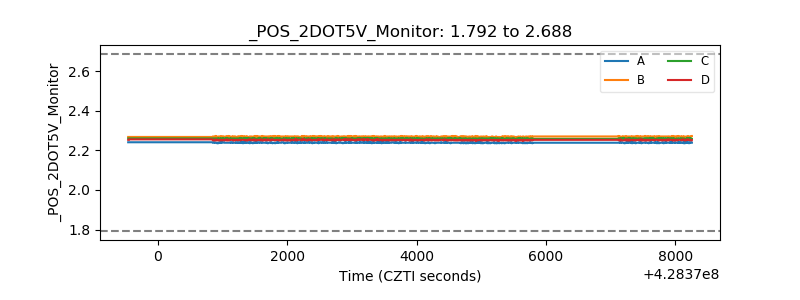 |
| +5 Volts monitor | 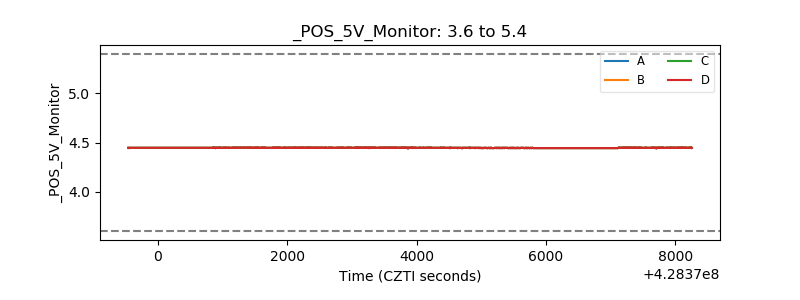 |
| _ROLL_ROT | 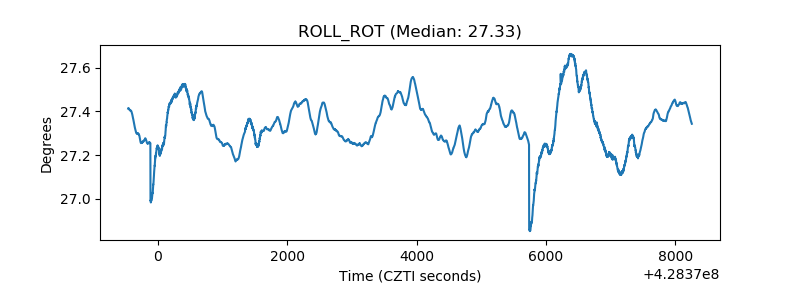 |
| _Roll_DEC | 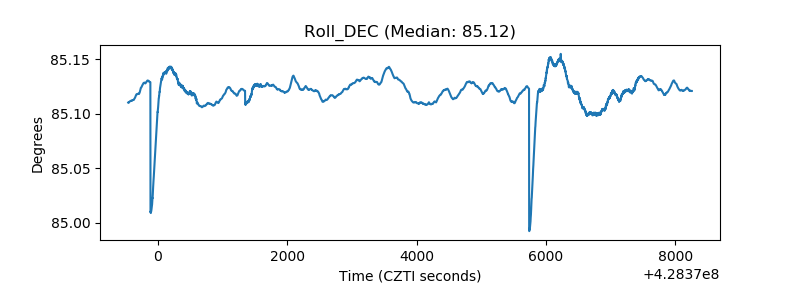 |
| _Roll_RA | 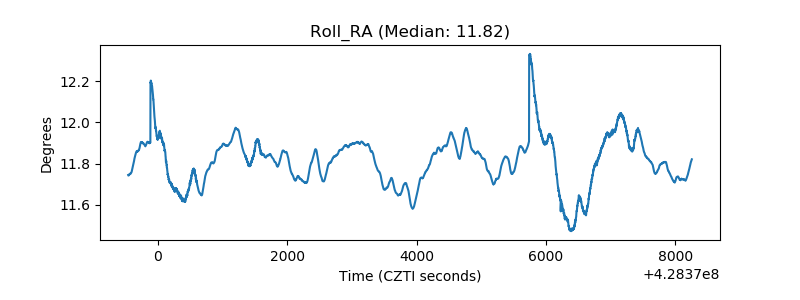 |
| Veto Counter |  |