| Param | Original file | Final file |
|---|---|---|
| Filename | modeM0/AS1C06_010T01_9000005800_42367cztM0_level2.fits | modeM0/AS1C06_010T01_9000005800_42367cztM0_level2_quad_clean.evt |
| Size (bytes) | 574,712,640 | 159,419,520 |
| Size | 548.1 MB | 152.0 MB |
| Events in quadrant A | 5,288,974 | 1,057,338 |
| Events in quadrant B | 4,945,116 | 1,066,861 |
| Events in quadrant C | 4,610,498 | 1,049,345 |
| Events in quadrant D | 5,653,789 | 961,246 |
| Mode M9 | |||
|---|---|---|---|
| Quadrant | BADHDUFLAG | Total packets | Discarded packets |
| A | 0 | 30 | 0 |
| B | 0 | 30 | 0 |
| C | 0 | 30 | 0 |
| D | 0 | 30 | 0 |
| Mode M0 | |||
|---|---|---|---|
| Quadrant | BADHDUFLAG | Total packets | Discarded packets |
| A | 0 | 21805 | 2 |
| B | 0 | 22030 | 2 |
| C | 0 | 20406 | 2 |
| D | 0 | 24126 | 2 |
| Mode SS | |||
|---|---|---|---|
| Quadrant | BADHDUFLAG | Total packets | Discarded packets |
| A | 0 | 202 | 0 |
| B | 0 | 202 | 0 |
| C | 0 | 202 | 0 |
| D | 0 | 202 | 0 |
| Quadrant | Total seconds | Saturated seconds | Saturation percentage |
|---|---|---|---|
| A | 9988 | 49 | 0.490589% |
| B | 9988 | 120 | 1.201442% |
| C | 9989 | 11 | 0.110121% |
| D | 9988 | 213 | 2.132559% |
Noise dominated data is calculated using 1-second bins in cleaned event files. If a bin has >2000 counts, and if more than 50% of those come from <1% of pixels, then it is considered to be noise-dominated and hence unusable.
| Quadrant | # 1 sec bins | Bins with >0 counts | Bins with >2000 counts | High rate bins dominated by noise | Noise dominated (total time) | Noise dominated (detector-on time) | Marked lightcurve |
|---|---|---|---|---|---|---|---|
| A | 12973 | 9990 | 35 | 35 | 0.27% | 0.35% | 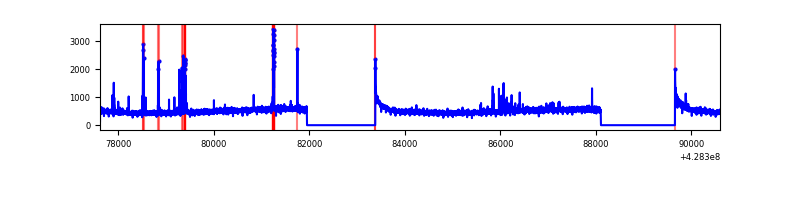 |
| B | 12973 | 9990 | 67 | 67 | 0.52% | 0.67% | 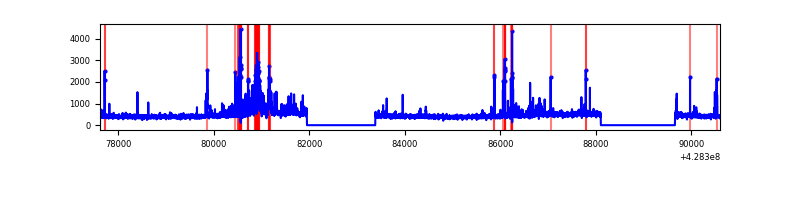 |
| C | 12974 | 9991 | 3 | 3 | 0.02% | 0.03% | 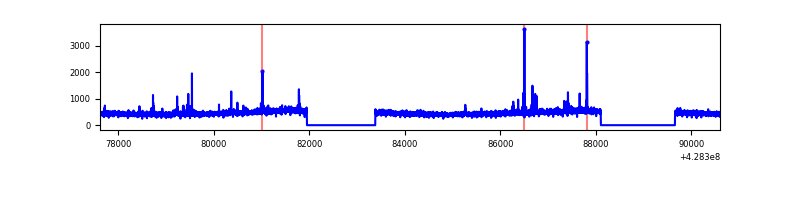 |
| D | 12973 | 9990 | 162 | 162 | 1.25% | 1.62% | 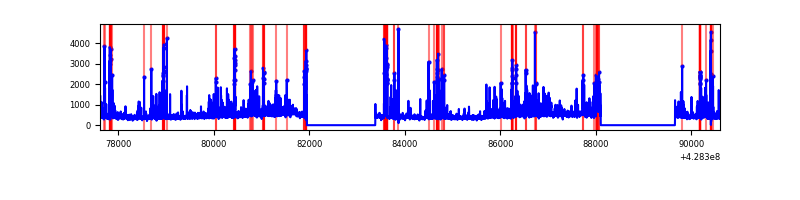 |
Top three noisy pixels from each quadrant. If the there are fewer than three noisy pixels in the level2.evt file, extra rows are filled as -1
| Pixel properties | Quadrant properties | ||||||
|---|---|---|---|---|---|---|---|
| Quadrant | DetID | PixID | Counts | Sigma | Mean | Median | Sigma |
| A | 10 | 83 | 946236 | 4366.4 | 1063 | 1042 | 216.5 |
| A | 13 | 248 | 126474 | 579.44 | 1063 | 1042 | 216.5 |
| A | 7 | 3 | 90773 | 414.52 | 1063 | 1042 | 216.5 |
| B | 0 | 189 | 217575 | 1069.65 | 1054 | 1024 | 202.4 |
| B | 5 | 172 | 183383 | 900.76 | 1054 | 1024 | 202.4 |
| B | 5 | 255 | 97249 | 475.3 | 1054 | 1024 | 202.4 |
| C | 15 | 214 | 421223 | 1739.51 | 1039 | 1044 | 241.6 |
| C | 15 | 111 | 85735 | 350.61 | 1039 | 1044 | 241.6 |
| C | 8 | 79 | 37328 | 150.21 | 1039 | 1044 | 241.6 |
| D | 12 | 6 | 366857 | 1450.02 | 1035 | 1004 | 252.3 |
| D | 1 | 52 | 273387 | 1079.56 | 1035 | 1004 | 252.3 |
| D | 12 | 233 | 213374 | 841.71 | 1035 | 1004 | 252.3 |
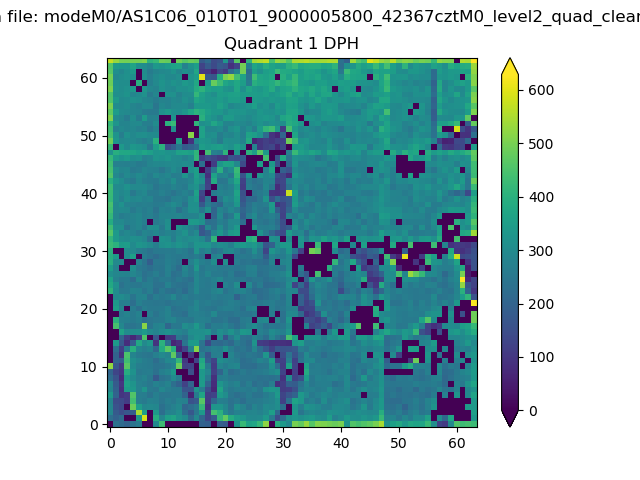
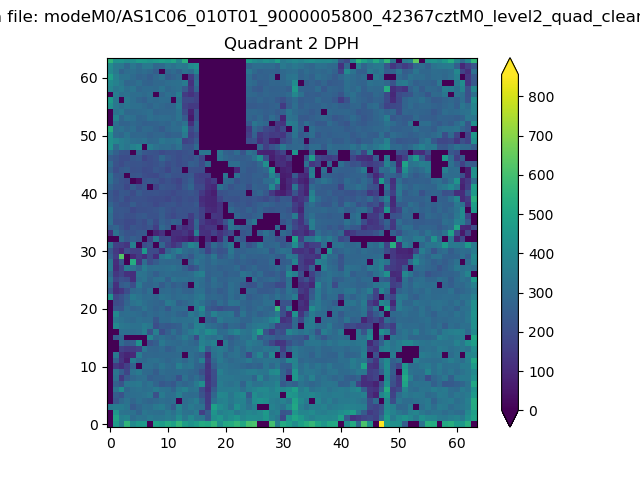
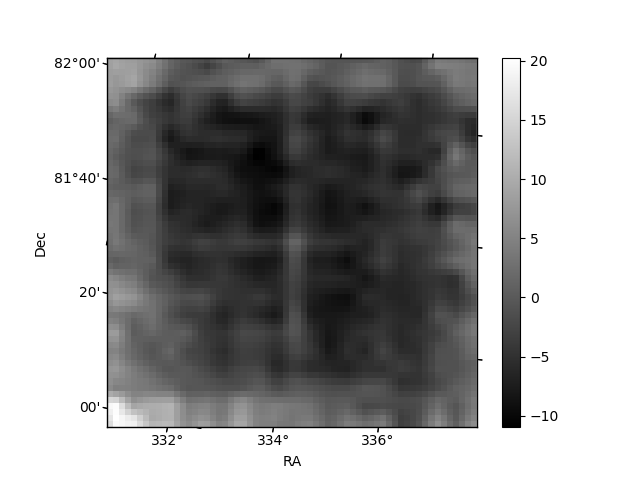
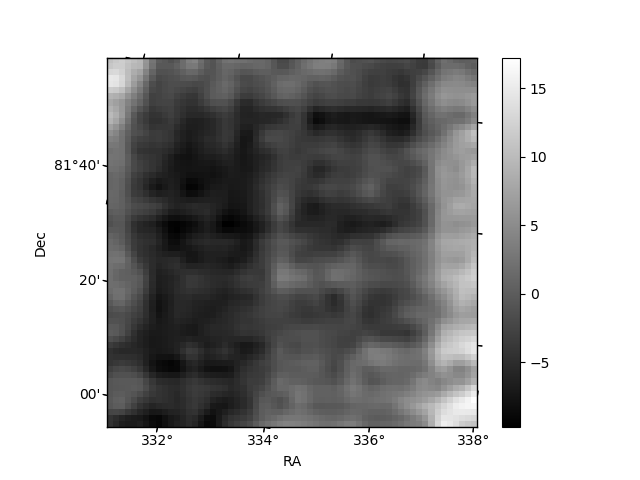
Histogram calculated using DETX and DETY for each event in the final _common_clean file
| Quadrant A |  |
 |
Quadrant B |
|---|---|---|---|
| Quadrant D |  |
 |
Quadrant C |
| Plot type | Count rate plots | Images |
|---|---|---|
| Comparison with Poisson distribution Blue bars denote a histogram of data divided into 1 sec bins. Red curve is a Poisson curve with rate = median count rate of data. |
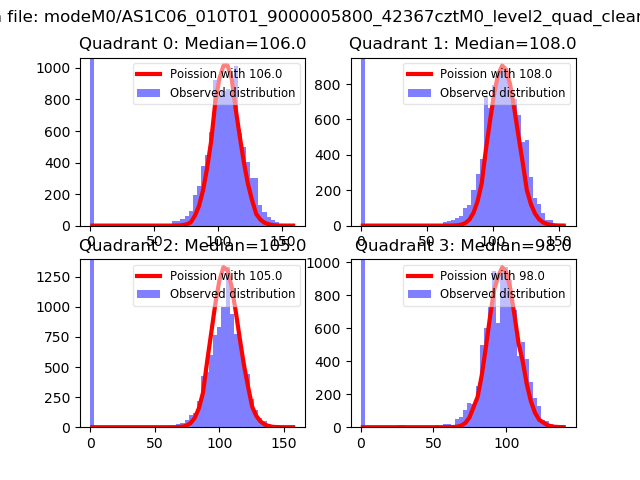 |
 |
| Quadrant-wise count rates Data is divided into 100 sec bins |
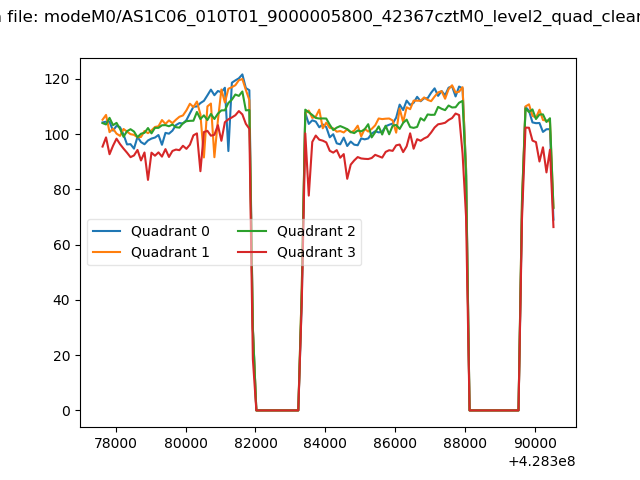 |
|
| Module-wise count rates for Quadrant A Data is divided into 100 sec bins |
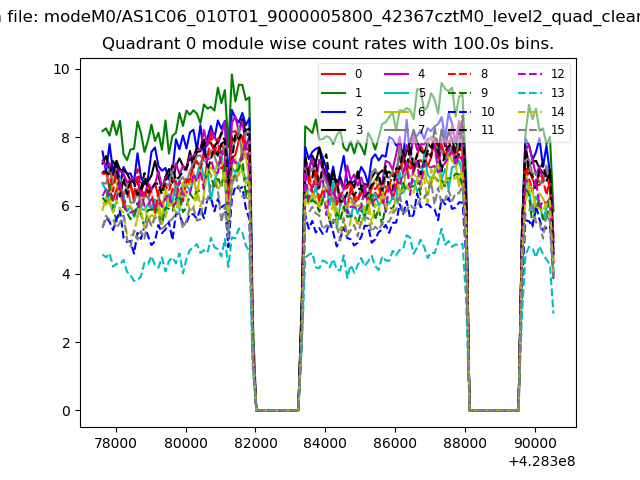 |
 |
| Module-wise count rates for Quadrant B Data is divided into 100 sec bins |
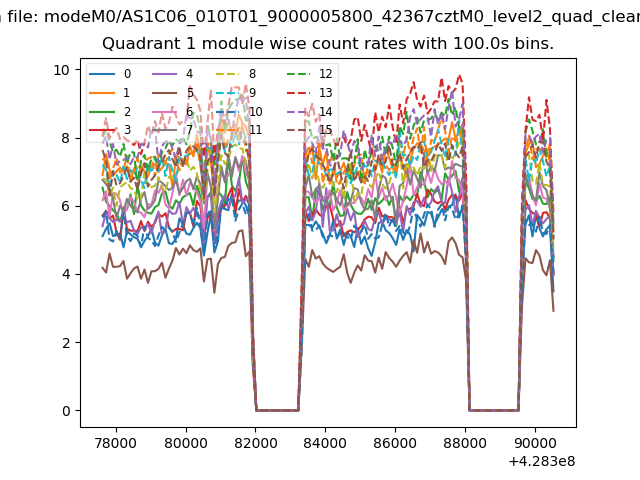 |
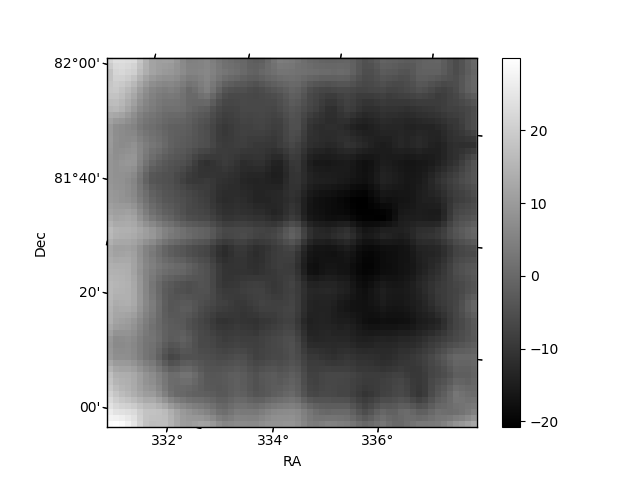 |
| Module-wise count rates for Quadrant C Data is divided into 100 sec bins |
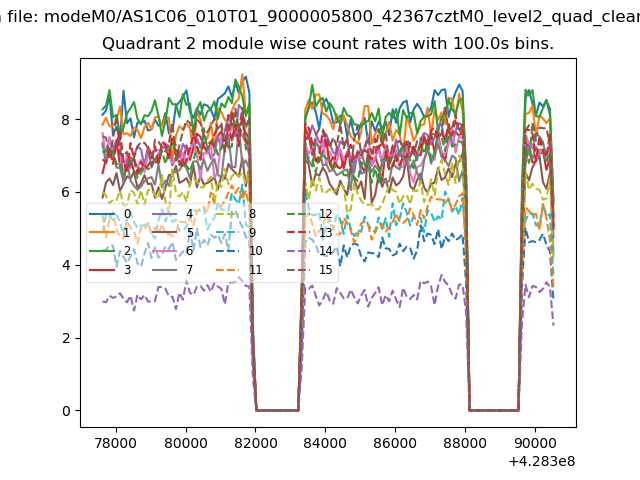 |
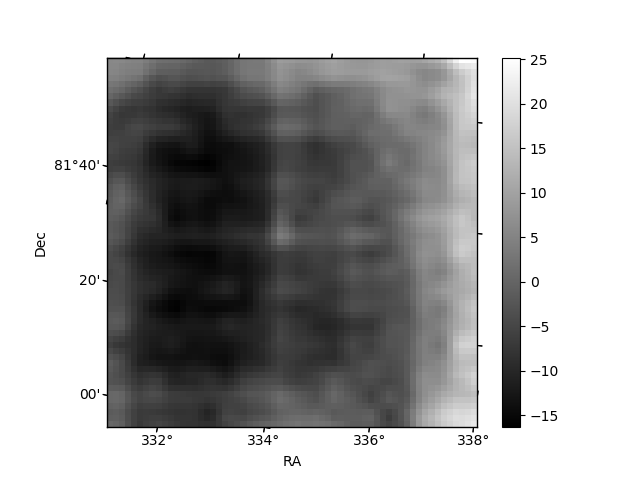 |
| Module-wise count rates for Quadrant D Data is divided into 100 sec bins |
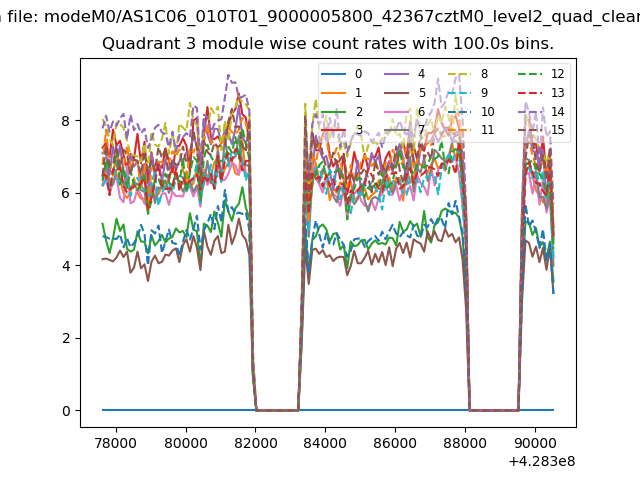 |
 |
| Parameter | Plot |
|---|---|
| CZT HV Monitor | 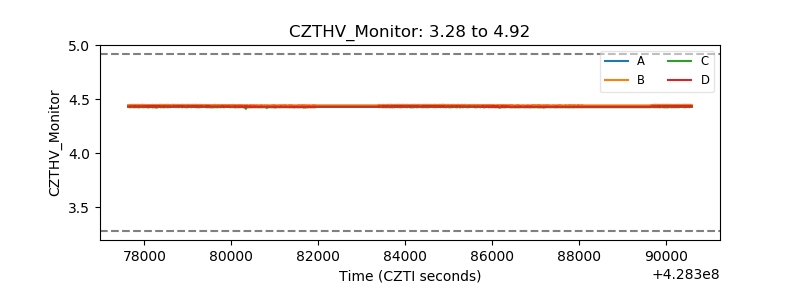 |
| D_VDD | 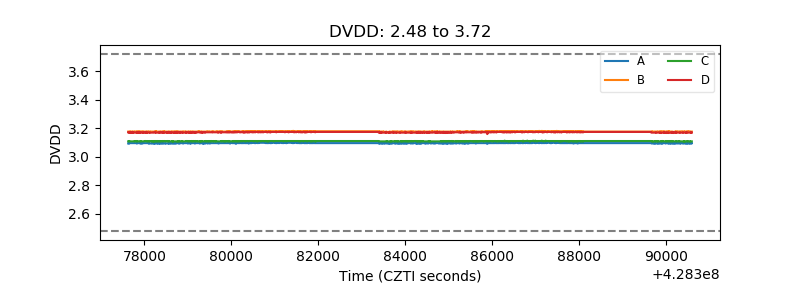 |
| Temperature 1 | 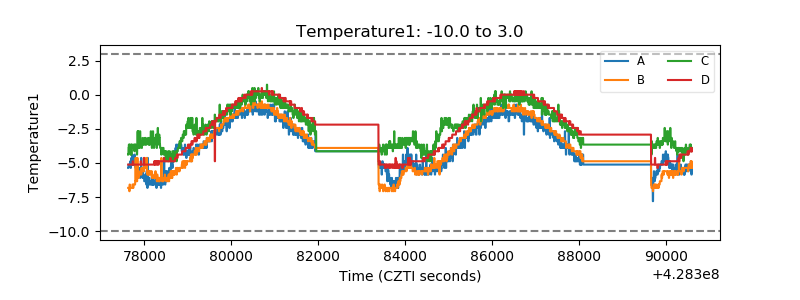 |
| Veto HV Monitor | 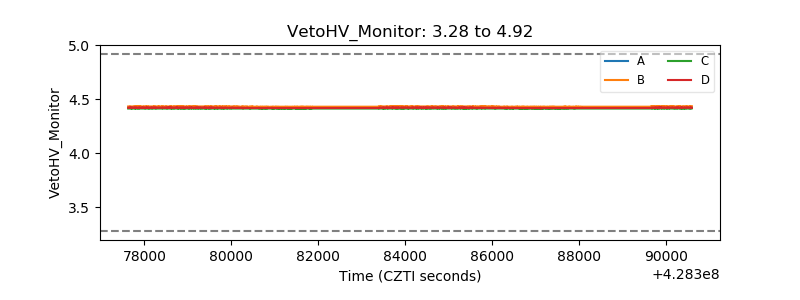 |
| Veto LLD | 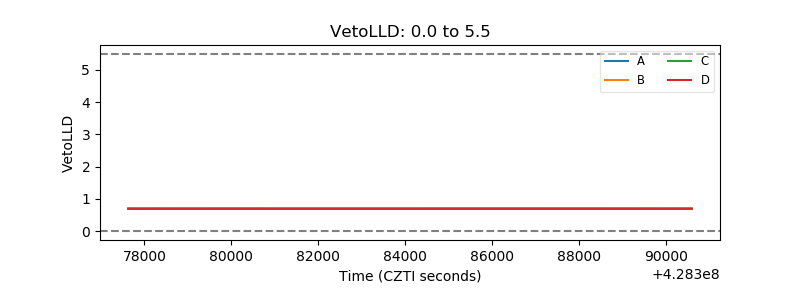 |
| Alpha Counter |  |
| _CPM_Rate | 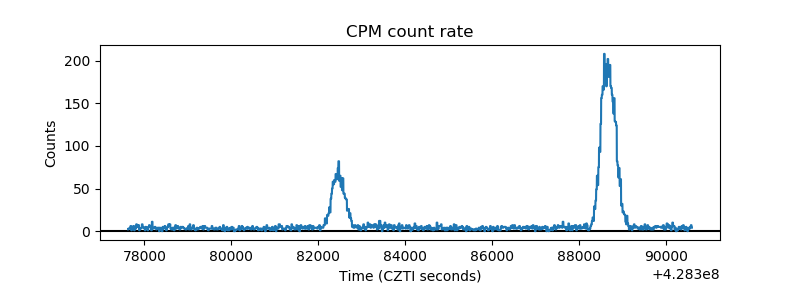 |
| CZT Counter | 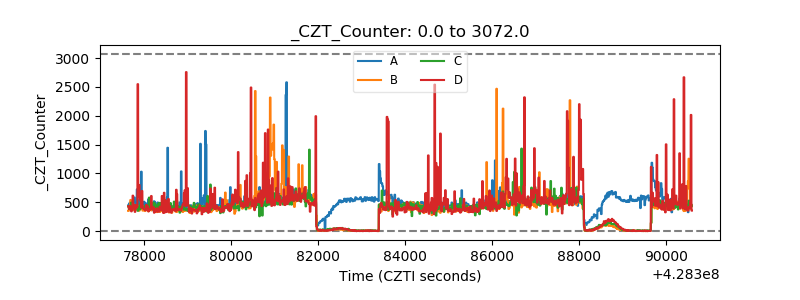 |
| +2.5 Volts monitor | 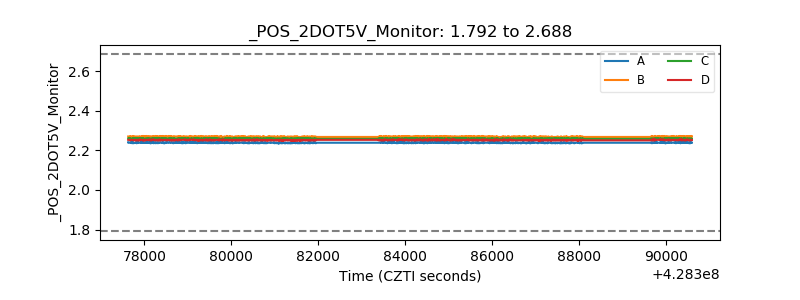 |
| +5 Volts monitor | 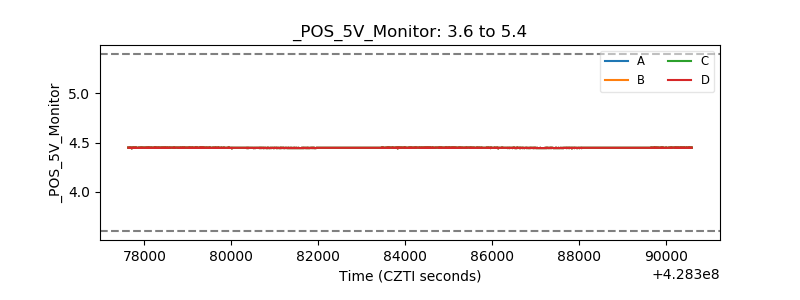 |
| _ROLL_ROT | 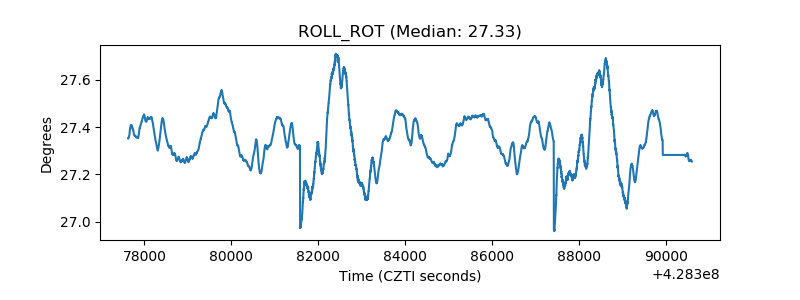 |
| _Roll_DEC | 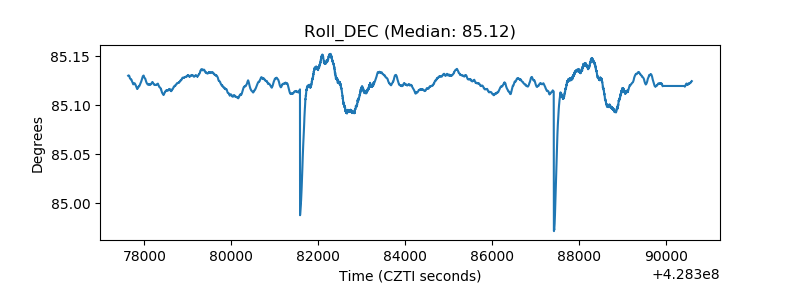 |
| _Roll_RA | 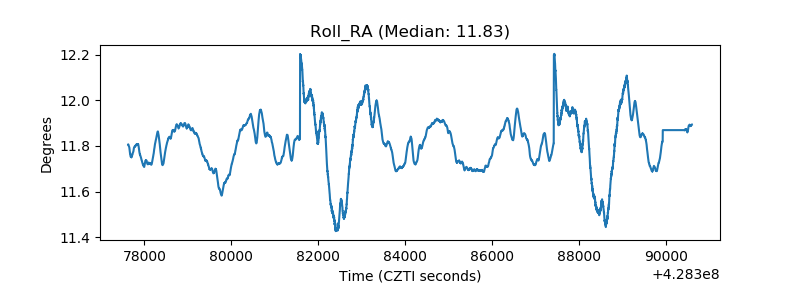 |
| Veto Counter | 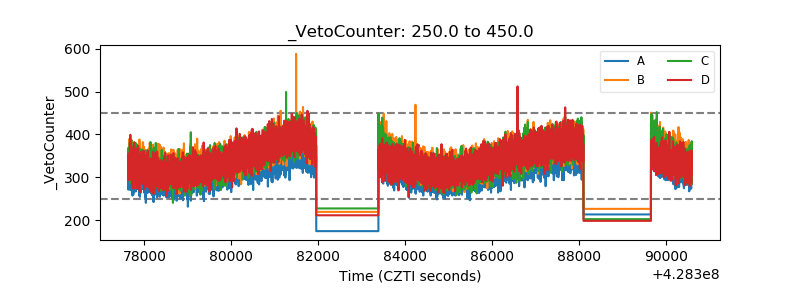 |