| Param | Original file | Final file |
|---|---|---|
| Filename | modeM0/AS1C06_010T01_9000005800_42370cztM0_level2.fits | modeM0/AS1C06_010T01_9000005800_42370cztM0_level2_quad_clean.evt |
| Size (bytes) | 330,796,800 | 87,886,080 |
| Size | 315.5 MB | 83.8 MB |
| Events in quadrant A | 2,866,503 | 595,140 |
| Events in quadrant B | 2,610,537 | 602,096 |
| Events in quadrant C | 2,594,331 | 578,182 |
| Events in quadrant D | 3,758,295 | 512,023 |
| Mode M9 | |||
|---|---|---|---|
| Quadrant | BADHDUFLAG | Total packets | Discarded packets |
| A | 0 | 21 | 0 |
| B | 0 | 22 | 0 |
| C | 0 | 22 | 0 |
| D | 0 | 22 | 0 |
| Mode M0 | |||
|---|---|---|---|
| Quadrant | BADHDUFLAG | Total packets | Discarded packets |
| A | 0 | 11566 | 2 |
| B | 0 | 11404 | 2 |
| C | 0 | 11062 | 2 |
| D | 0 | 14926 | 2 |
| Mode SS | |||
|---|---|---|---|
| Quadrant | BADHDUFLAG | Total packets | Discarded packets |
| A | 0 | 110 | 0 |
| B | 0 | 110 | 0 |
| C | 0 | 110 | 0 |
| D | 0 | 110 | 0 |
| Quadrant | Total seconds | Saturated seconds | Saturation percentage |
|---|---|---|---|
| A | 5329 | 14 | 0.262713% |
| B | 5329 | 20 | 0.375305% |
| C | 5329 | 3 | 0.056296% |
| D | 5329 | 345 | 6.474010% |
Noise dominated data is calculated using 1-second bins in cleaned event files. If a bin has >2000 counts, and if more than 50% of those come from <1% of pixels, then it is considered to be noise-dominated and hence unusable.
| Quadrant | # 1 sec bins | Bins with >0 counts | Bins with >2000 counts | High rate bins dominated by noise | Noise dominated (total time) | Noise dominated (detector-on time) | Marked lightcurve |
|---|---|---|---|---|---|---|---|
| A | 7122 | 5330 | 3 | 3 | 0.04% | 0.06% | 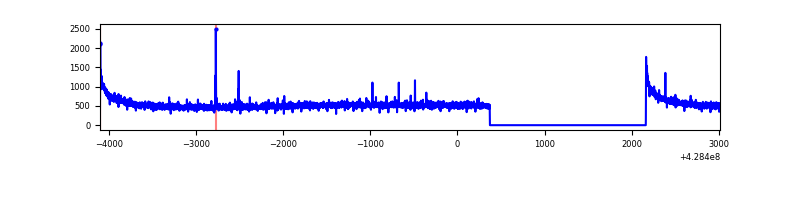 |
| B | 7122 | 5330 | 8 | 8 | 0.11% | 0.15% | 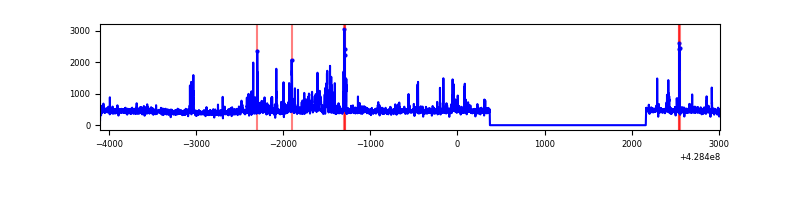 |
| C | 7122 | 5330 | 5 | 5 | 0.07% | 0.09% | 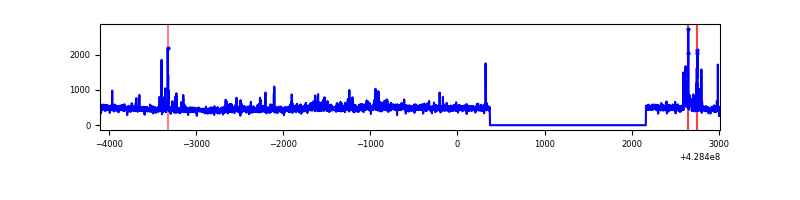 |
| D | 7122 | 5330 | 305 | 305 | 4.28% | 5.72% | 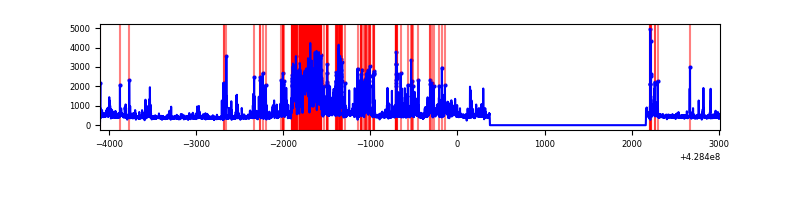 |
Top three noisy pixels from each quadrant. If the there are fewer than three noisy pixels in the level2.evt file, extra rows are filled as -1
| Pixel properties | Quadrant properties | ||||||
|---|---|---|---|---|---|---|---|
| Quadrant | DetID | PixID | Counts | Sigma | Mean | Median | Sigma |
| A | 10 | 83 | 588916 | 5008.85 | 580 | 568 | 117.5 |
| A | 13 | 248 | 17336 | 142.75 | 580 | 568 | 117.5 |
| A | 13 | 254 | 9242 | 73.85 | 580 | 568 | 117.5 |
| B | 0 | 189 | 138213 | 1257.12 | 572 | 557 | 109.5 |
| B | 5 | 255 | 53066 | 479.53 | 572 | 557 | 109.5 |
| B | 0 | 230 | 48572 | 438.49 | 572 | 557 | 109.5 |
| C | 15 | 214 | 231006 | 1771.35 | 559 | 561 | 130.1 |
| C | 8 | 79 | 77485 | 591.29 | 559 | 561 | 130.1 |
| C | 7 | 220 | 52498 | 399.22 | 559 | 561 | 130.1 |
| D | 12 | 233 | 703402 | 5236.78 | 554 | 538 | 134.2 |
| D | 10 | 199 | 256688 | 1908.48 | 554 | 538 | 134.2 |
| D | 12 | 6 | 98804 | 732.14 | 554 | 538 | 134.2 |
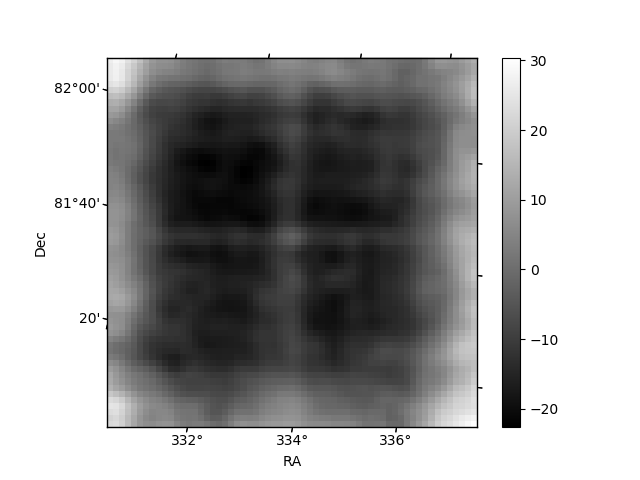
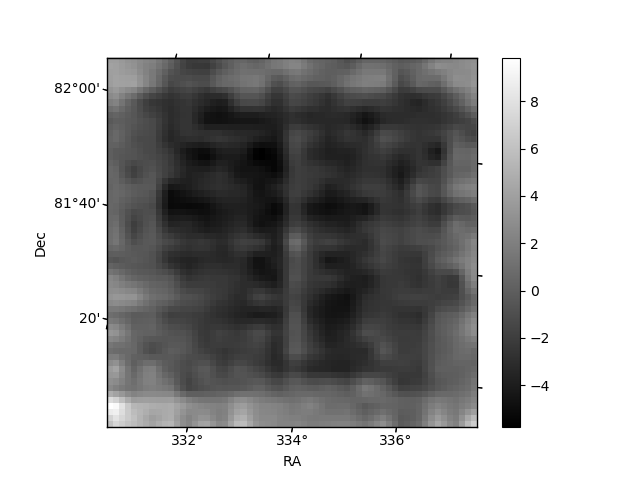
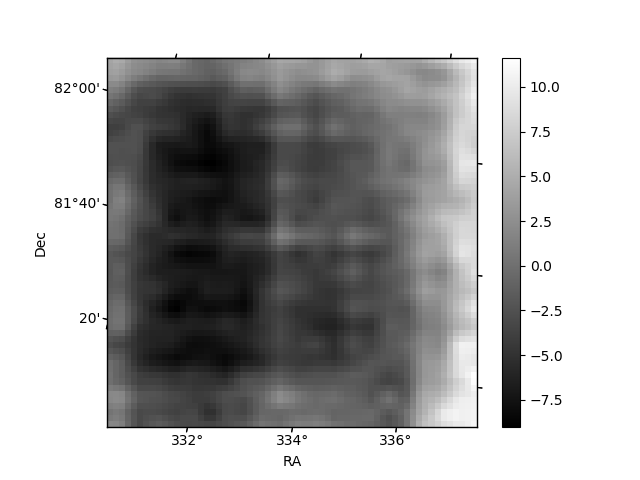
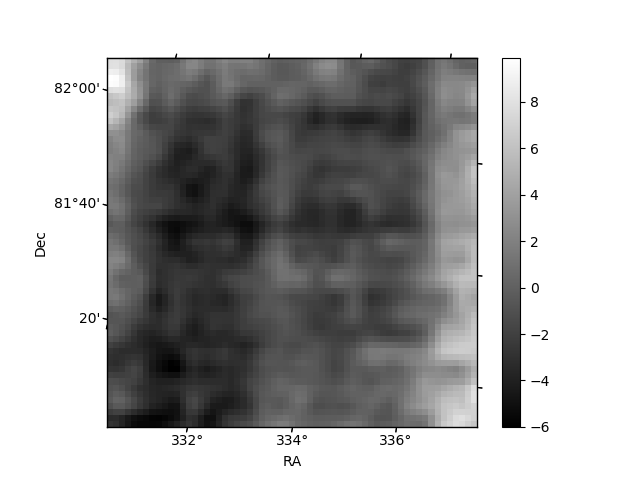
Histogram calculated using DETX and DETY for each event in the final _common_clean file
| Quadrant A | 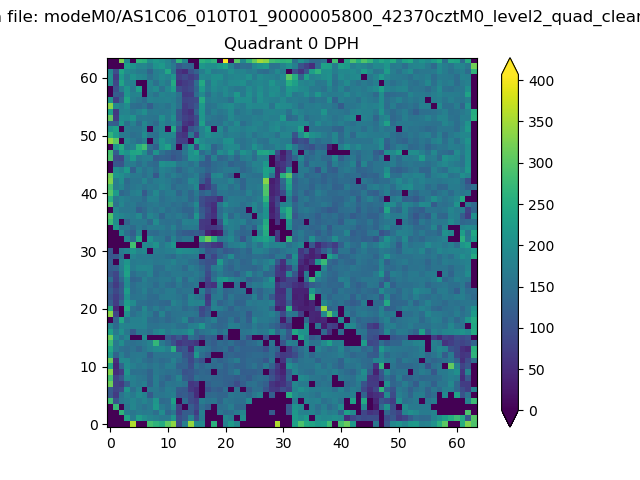 |
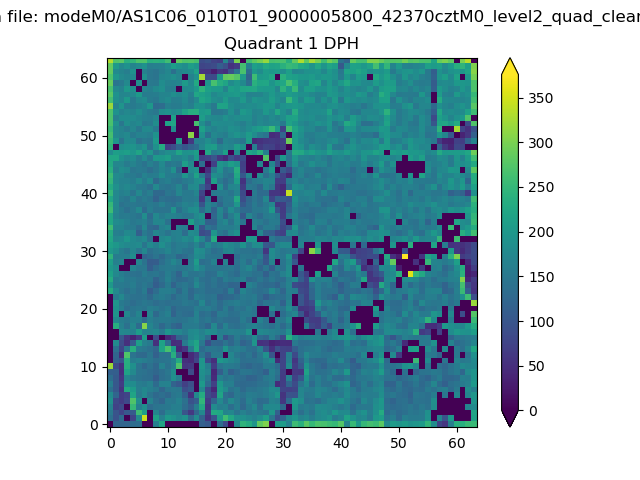 |
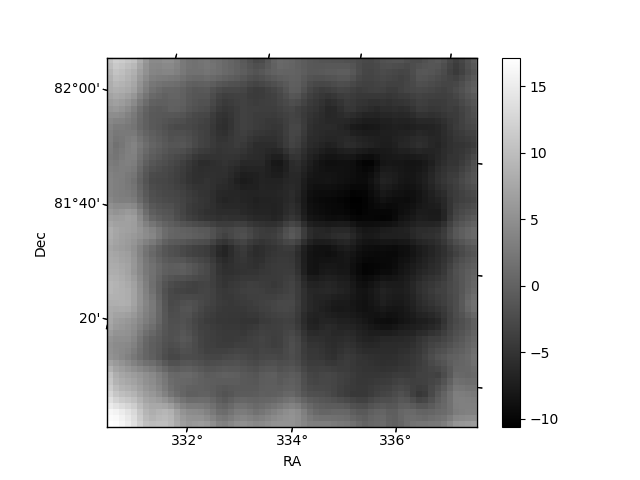
Quadrant B |
|---|---|---|---|
| Quadrant D | 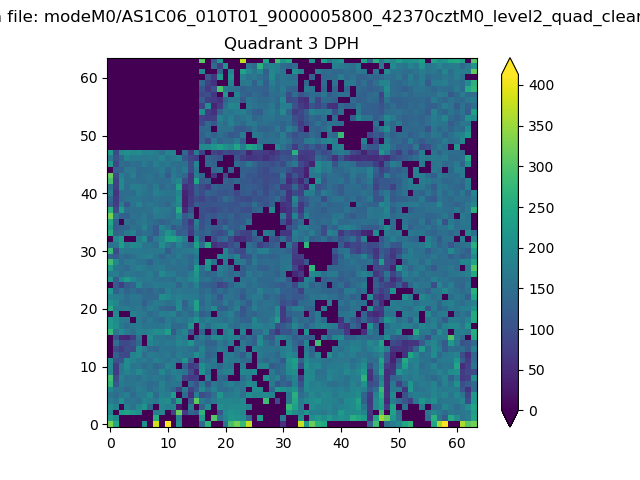 |
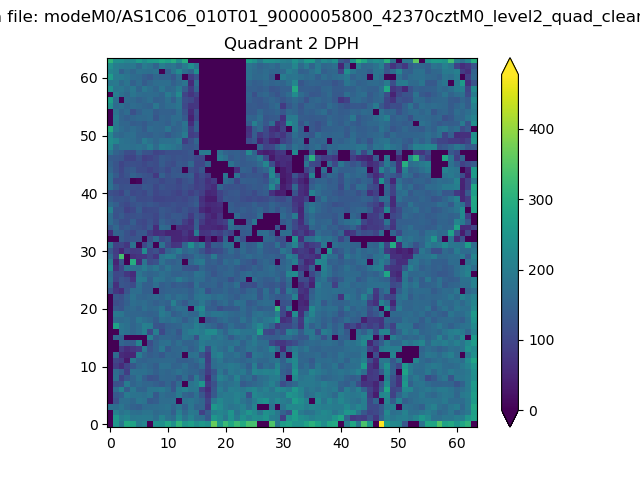 |
Quadrant C |
| Plot type | Count rate plots | Images |
|---|---|---|
| Comparison with Poisson distribution Blue bars denote a histogram of data divided into 1 sec bins. Red curve is a Poisson curve with rate = median count rate of data. |
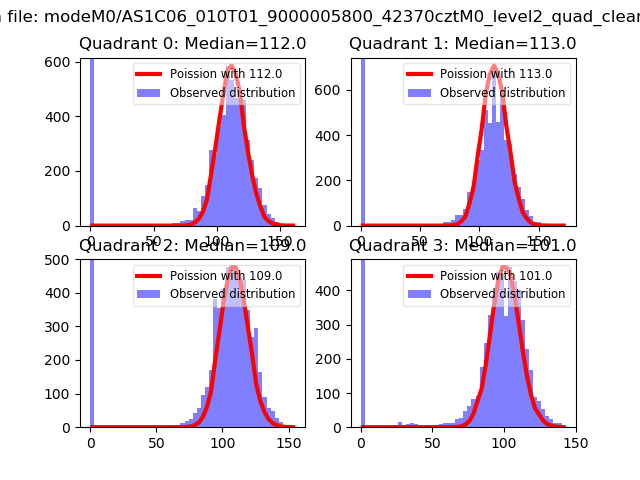 |
 |
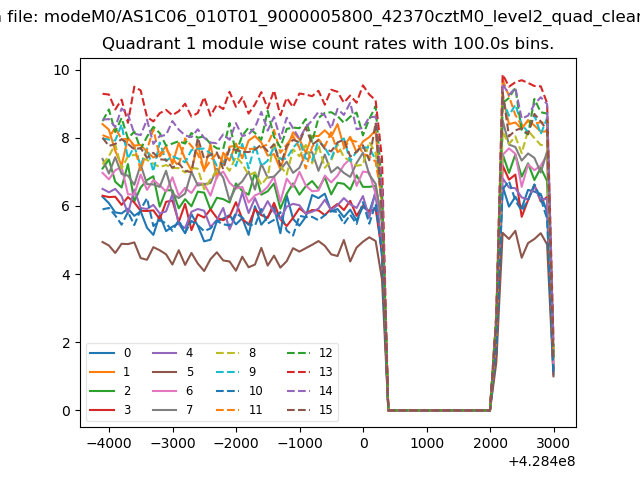
| Quadrant-wise count rates Data is divided into 100 sec bins |
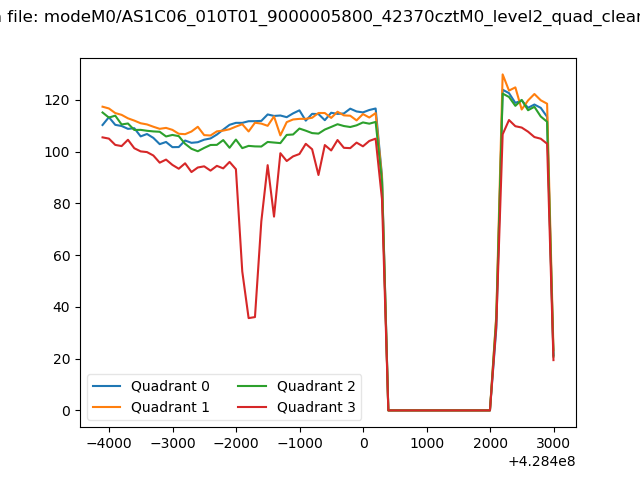 |
|
| Module-wise count rates for Quadrant A Data is divided into 100 sec bins |
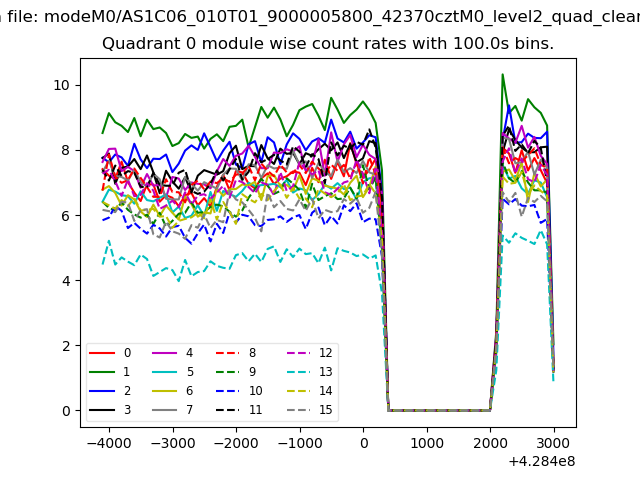 |
 |
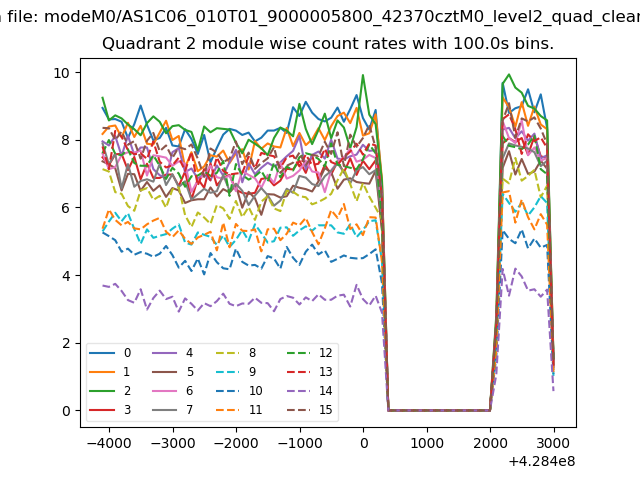
| Module-wise count rates for Quadrant B Data is divided into 100 sec bins |
 |
 |
| Module-wise count rates for Quadrant C Data is divided into 100 sec bins |
 |
 |
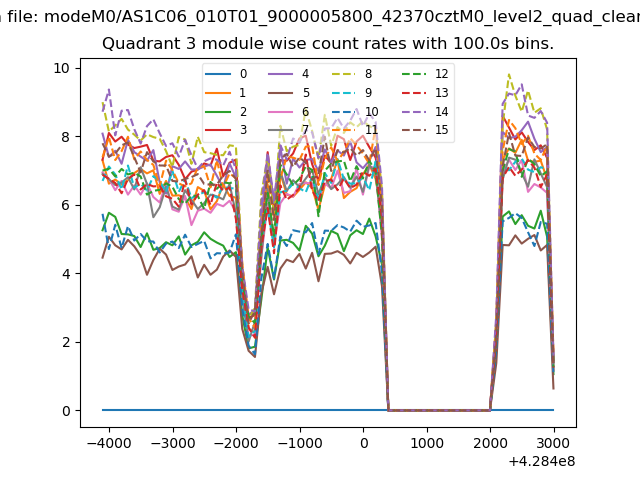
| Module-wise count rates for Quadrant D Data is divided into 100 sec bins |
 |
 |
| Parameter | Plot |
|---|---|
| CZT HV Monitor | 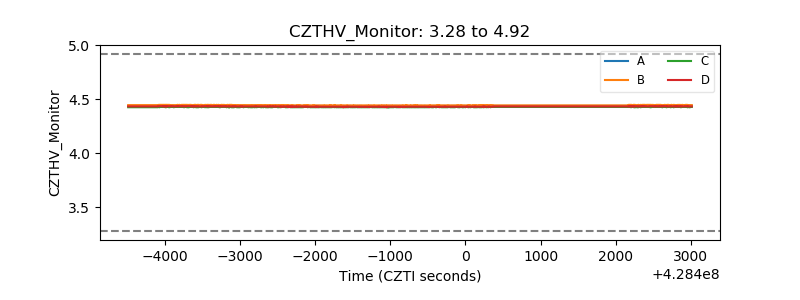 |
| D_VDD | 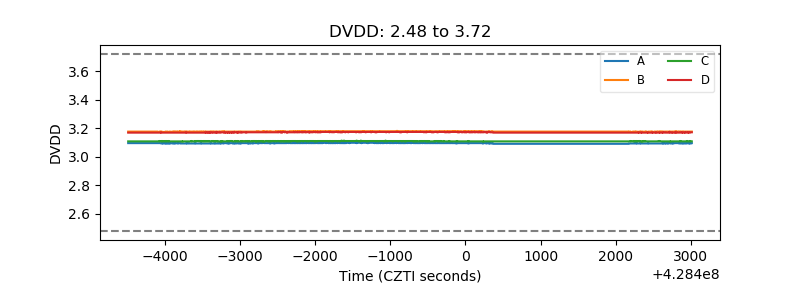 |
| Temperature 1 | 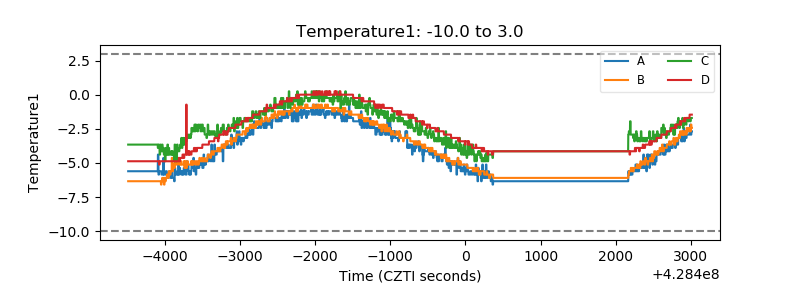 |
| Veto HV Monitor | 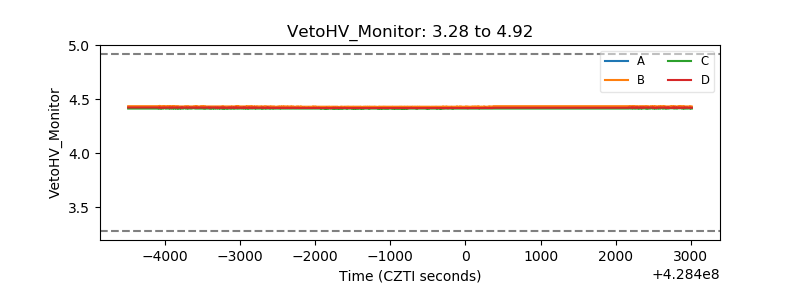 |
| Veto LLD | 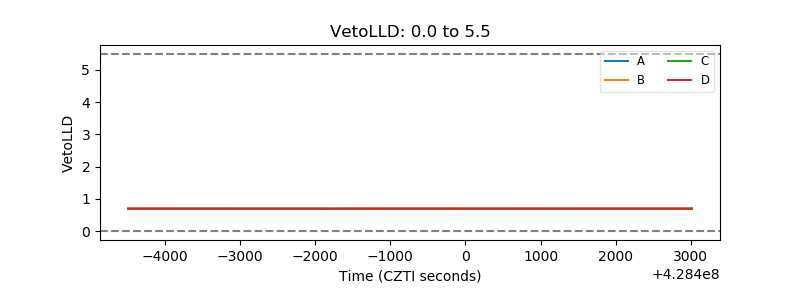 |
| Alpha Counter | 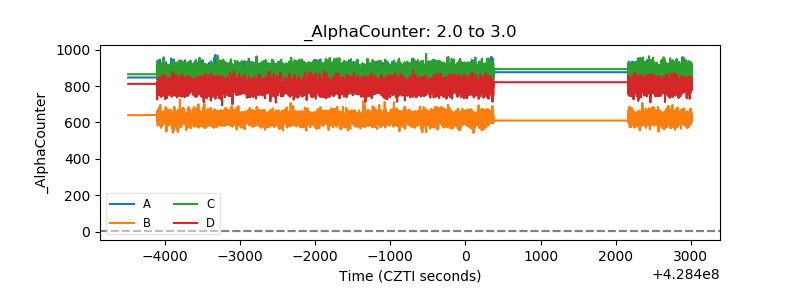 |
| _CPM_Rate |  |
| CZT Counter | 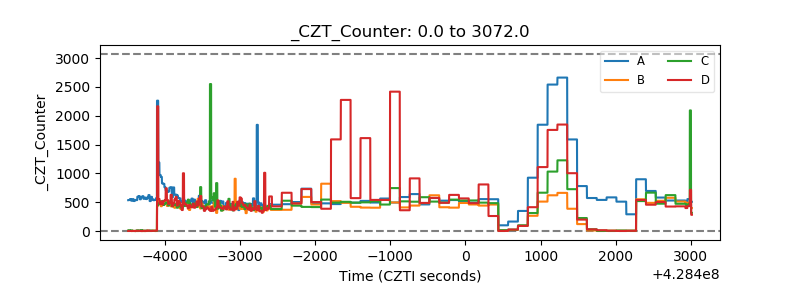 |
| +2.5 Volts monitor | 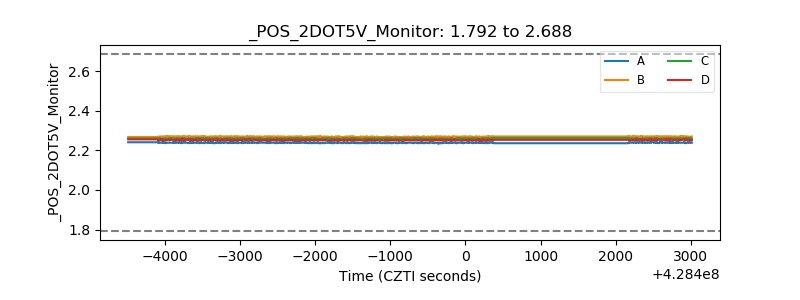 |
| +5 Volts monitor | 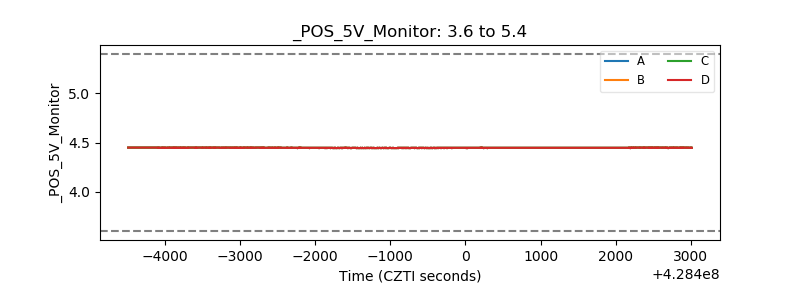 |
| _ROLL_ROT |  |
| _Roll_DEC | 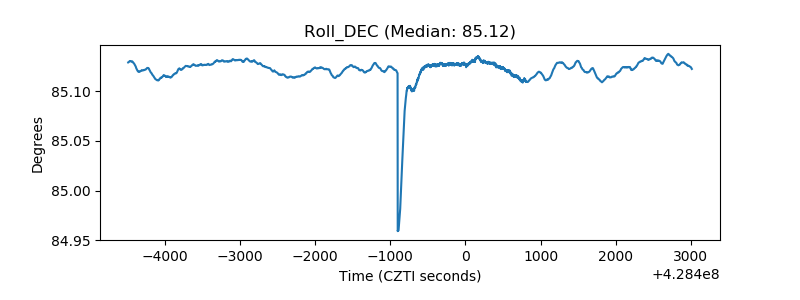 |
| _Roll_RA | 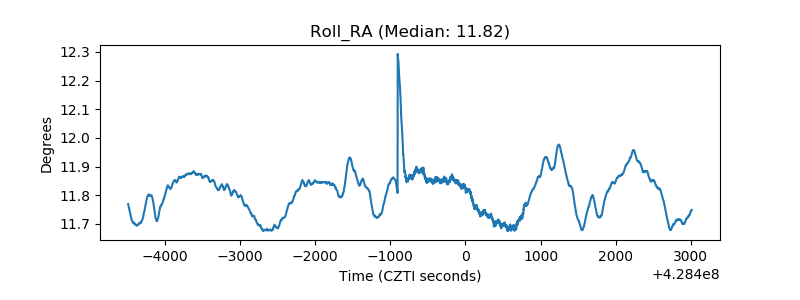 |
| Veto Counter | 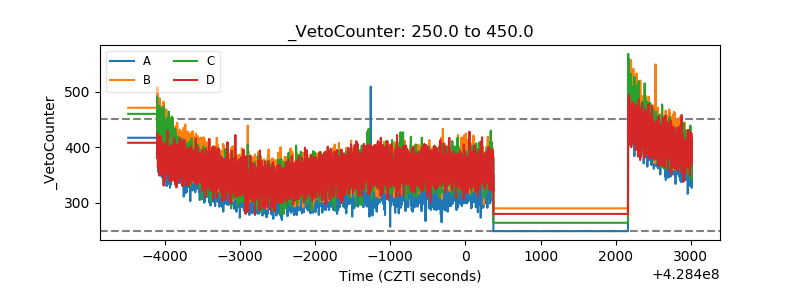 |