| Param | Original file | Final file |
|---|---|---|
| Filename | modeM0/AS1C06_010T01_9000005800_42371cztM0_level2.fits | modeM0/AS1C06_010T01_9000005800_42371cztM0_level2_quad_clean.evt |
| Size (bytes) | 333,950,400 | 90,017,280 |
| Size | 318.5 MB | 85.8 MB |
| Events in quadrant A | 3,070,831 | 613,359 |
| Events in quadrant B | 2,736,230 | 616,752 |
| Events in quadrant C | 2,554,887 | 591,359 |
| Events in quadrant D | 3,593,009 | 538,742 |
| Mode M9 | |||
|---|---|---|---|
| Quadrant | BADHDUFLAG | Total packets | Discarded packets |
| A | 0 | 26 | 0 |
| B | 0 | 27 | 0 |
| C | 0 | 27 | 0 |
| D | 0 | 27 | 0 |
| Mode M0 | |||
|---|---|---|---|
| Quadrant | BADHDUFLAG | Total packets | Discarded packets |
| A | 0 | 12117 | 2 |
| B | 0 | 11536 | 2 |
| C | 0 | 10771 | 2 |
| D | 0 | 14193 | 2 |
| Mode SS | |||
|---|---|---|---|
| Quadrant | BADHDUFLAG | Total packets | Discarded packets |
| A | 0 | 106 | 0 |
| B | 0 | 106 | 0 |
| C | 0 | 106 | 0 |
| D | 0 | 106 | 0 |
| Quadrant | Total seconds | Saturated seconds | Saturation percentage |
|---|---|---|---|
| A | 5221 | 62 | 1.187512% |
| B | 5221 | 65 | 1.244972% |
| C | 5221 | 5 | 0.095767% |
| D | 5221 | 221 | 4.232906% |
Noise dominated data is calculated using 1-second bins in cleaned event files. If a bin has >2000 counts, and if more than 50% of those come from <1% of pixels, then it is considered to be noise-dominated and hence unusable.
| Quadrant | # 1 sec bins | Bins with >0 counts | Bins with >2000 counts | High rate bins dominated by noise | Noise dominated (total time) | Noise dominated (detector-on time) | Marked lightcurve |
|---|---|---|---|---|---|---|---|
| A | 7133 | 5222 | 41 | 41 | 0.57% | 0.79% | 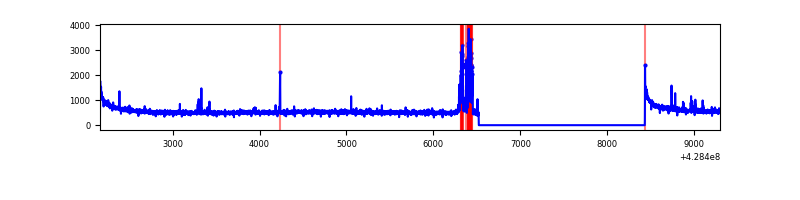 |
| B | 7133 | 5222 | 43 | 43 | 0.60% | 0.82% | 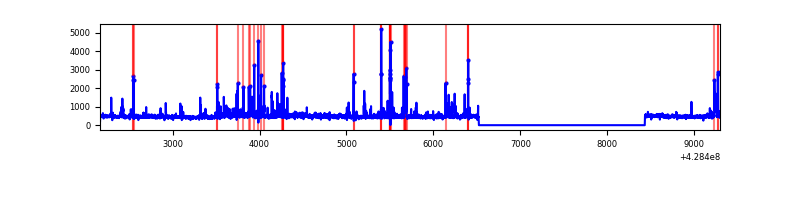 |
| C | 7133 | 5222 | 4 | 4 | 0.06% | 0.08% | 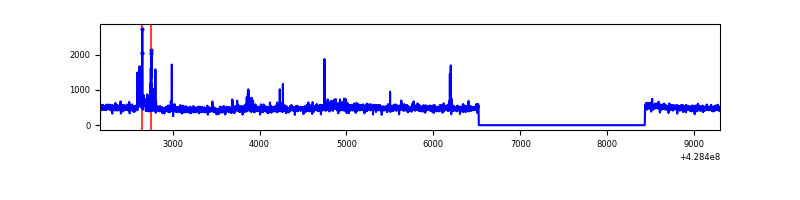 |
| D | 7133 | 5222 | 179 | 179 | 2.51% | 3.43% | 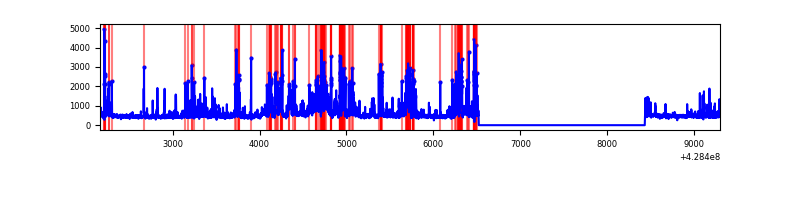 |
Top three noisy pixels from each quadrant. If the there are fewer than three noisy pixels in the level2.evt file, extra rows are filled as -1
| Pixel properties | Quadrant properties | ||||||
|---|---|---|---|---|---|---|---|
| Quadrant | DetID | PixID | Counts | Sigma | Mean | Median | Sigma |
| A | 10 | 83 | 585534 | 4945.69 | 584 | 573 | 118.3 |
| A | 13 | 248 | 192426 | 1622.07 | 584 | 573 | 118.3 |
| A | 7 | 3 | 14452 | 117.34 | 584 | 573 | 118.3 |
| B | 5 | 255 | 123561 | 1132.51 | 570 | 556 | 108.6 |
| B | 5 | 172 | 106005 | 970.87 | 570 | 556 | 108.6 |
| B | 0 | 230 | 52281 | 476.23 | 570 | 556 | 108.6 |
| C | 15 | 214 | 225257 | 1730.12 | 561 | 563 | 129.9 |
| C | 8 | 79 | 52622 | 400.85 | 561 | 563 | 129.9 |
| C | 7 | 220 | 52478 | 399.74 | 561 | 563 | 129.9 |
| D | 10 | 118 | 276210 | 2017.14 | 562 | 544 | 136.7 |
| D | 1 | 47 | 225299 | 1644.61 | 562 | 544 | 136.7 |
| D | 10 | 199 | 221231 | 1614.84 | 562 | 544 | 136.7 |
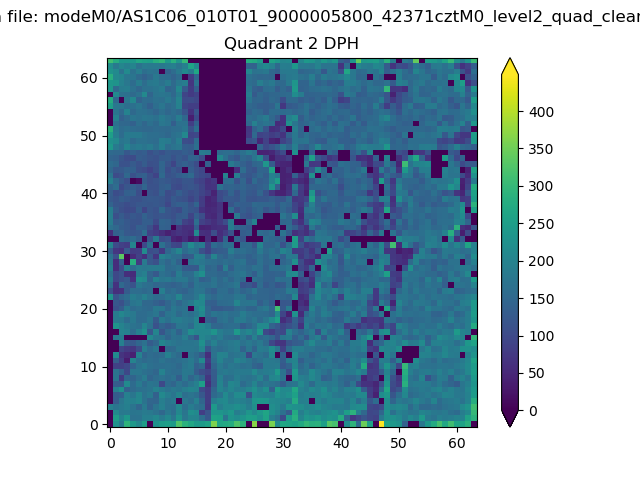
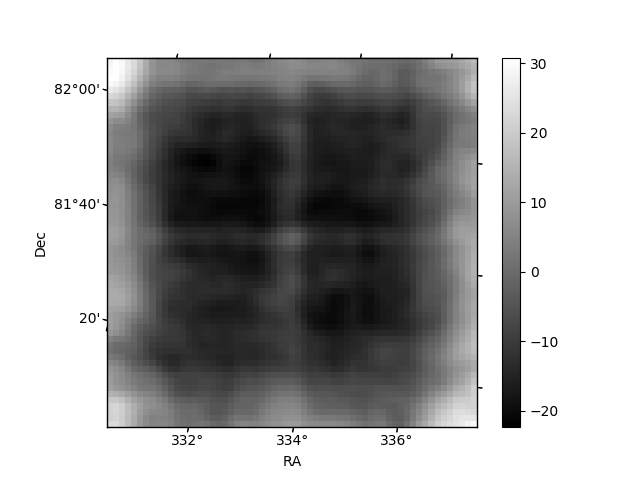
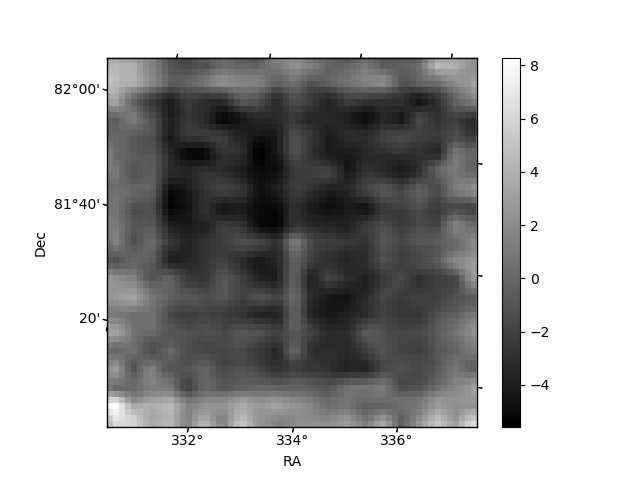
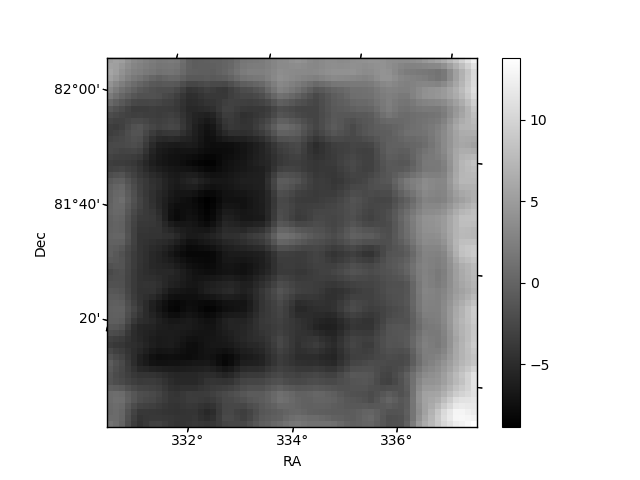
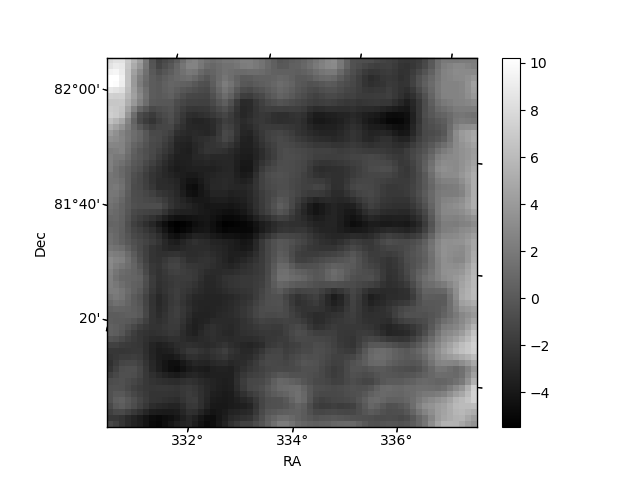
Histogram calculated using DETX and DETY for each event in the final _common_clean file
| Quadrant A | 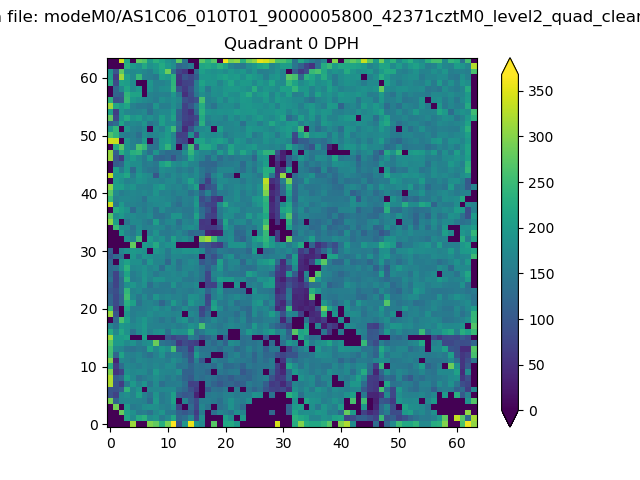 |
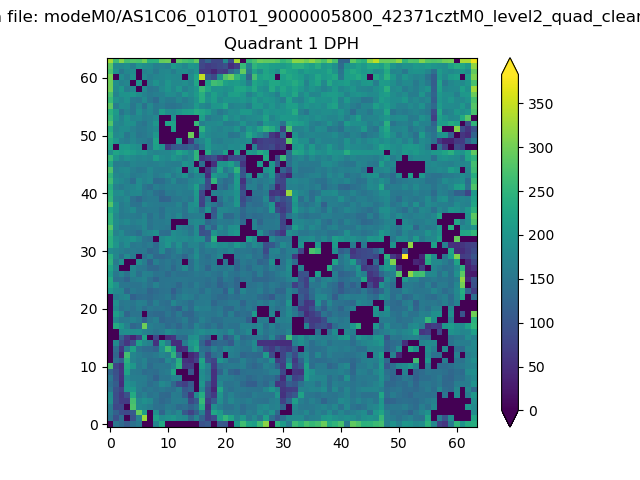 |
Quadrant B |
|---|---|---|---|
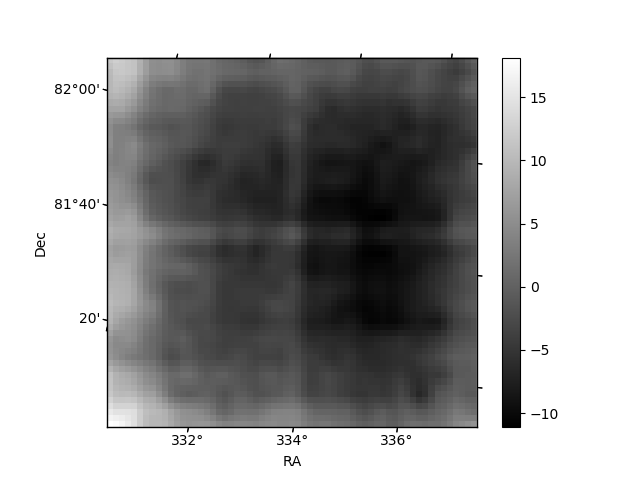
| Quadrant D | 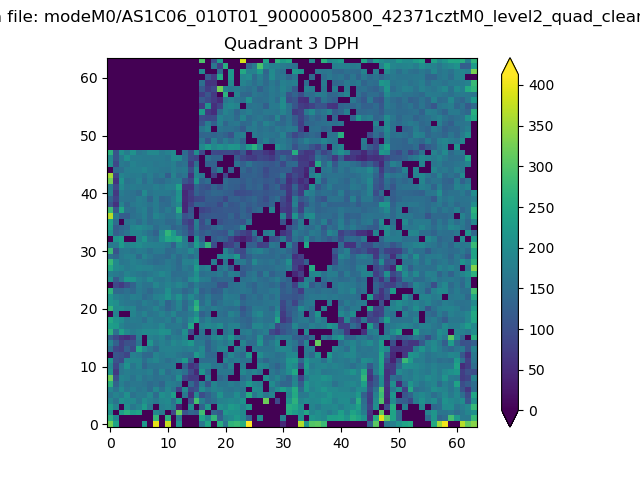 |
 |
Quadrant C |
| Plot type | Count rate plots | Images |
|---|---|---|
| Comparison with Poisson distribution Blue bars denote a histogram of data divided into 1 sec bins. Red curve is a Poisson curve with rate = median count rate of data. |
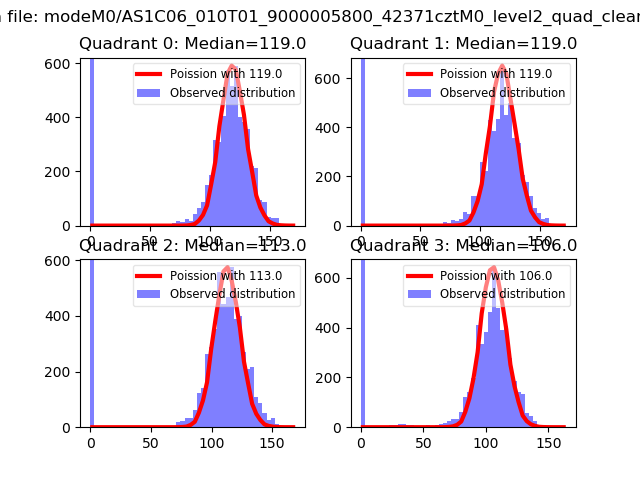 |
 |
| Quadrant-wise count rates Data is divided into 100 sec bins |
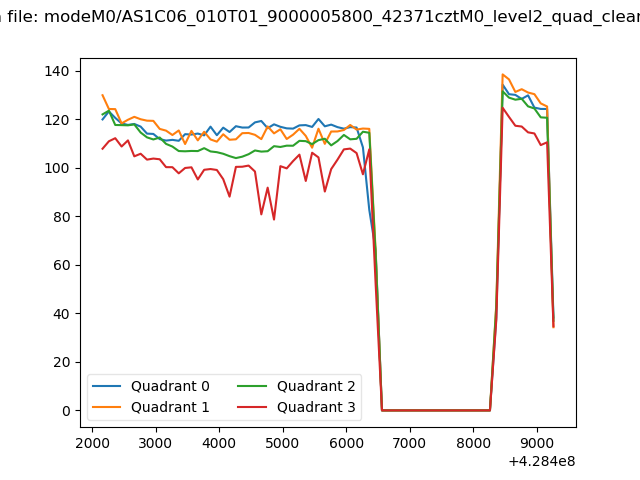 |
|
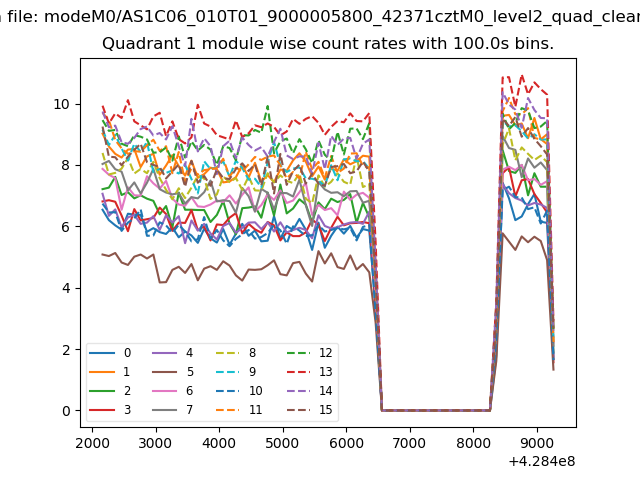
| Module-wise count rates for Quadrant A Data is divided into 100 sec bins |
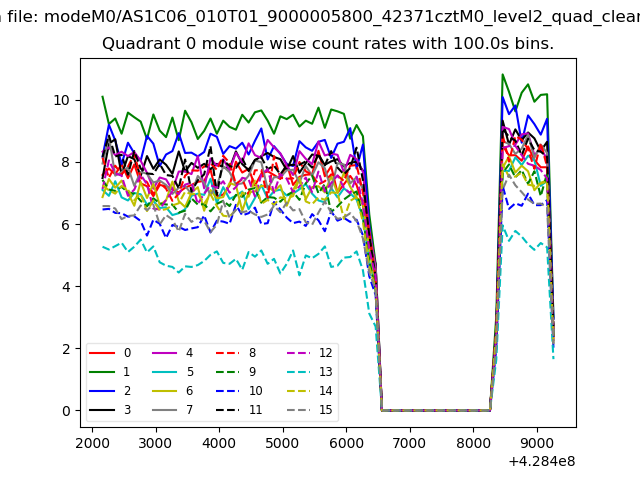 |
 |
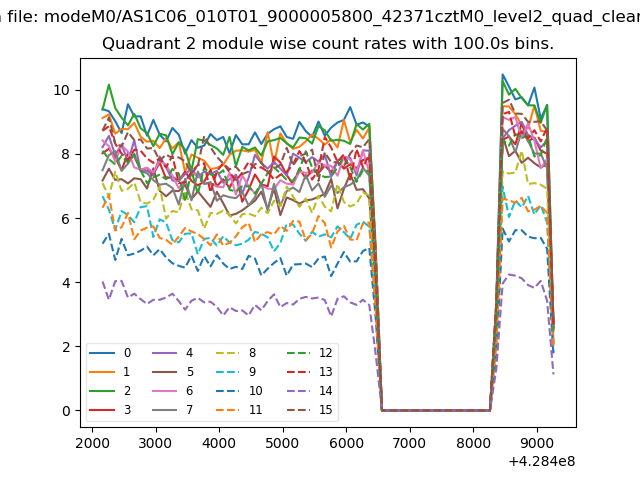
| Module-wise count rates for Quadrant B Data is divided into 100 sec bins |
 |
 |
| Module-wise count rates for Quadrant C Data is divided into 100 sec bins |
 |
 |
| Module-wise count rates for Quadrant D Data is divided into 100 sec bins |
 |
 |
| Parameter | Plot |
|---|---|
| CZT HV Monitor | 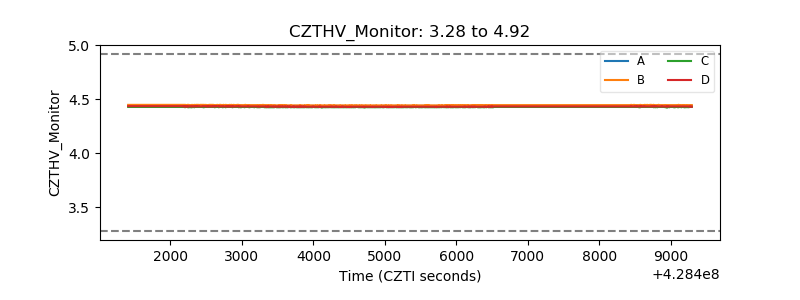 |
| D_VDD | 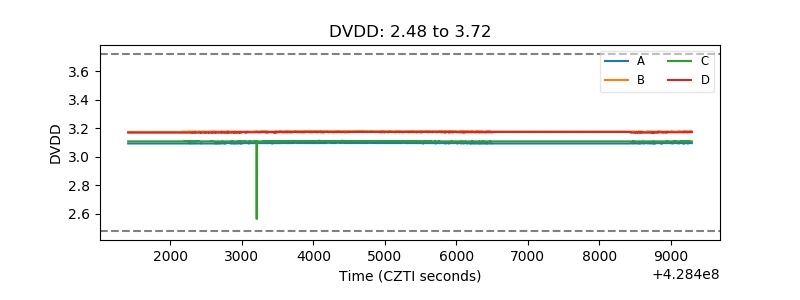 |
| Temperature 1 | 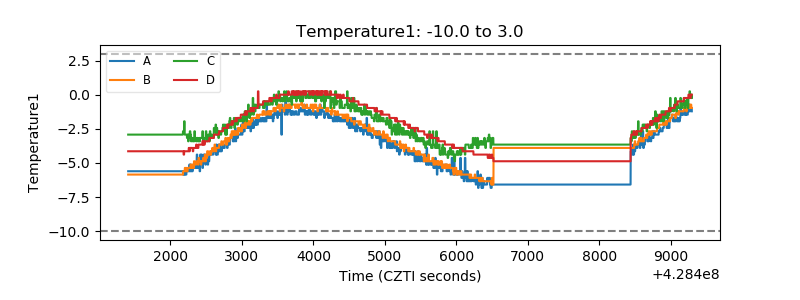 |
| Veto HV Monitor |  |
| Veto LLD | 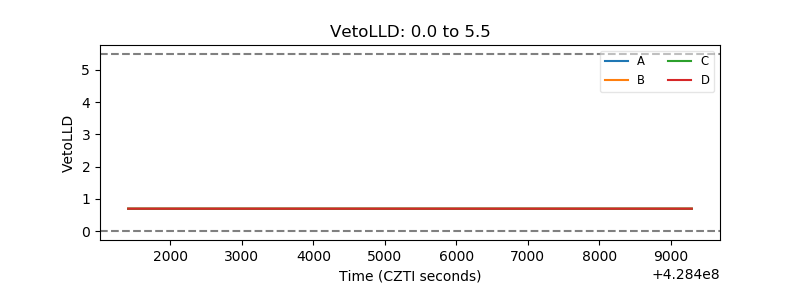 |
| Alpha Counter | 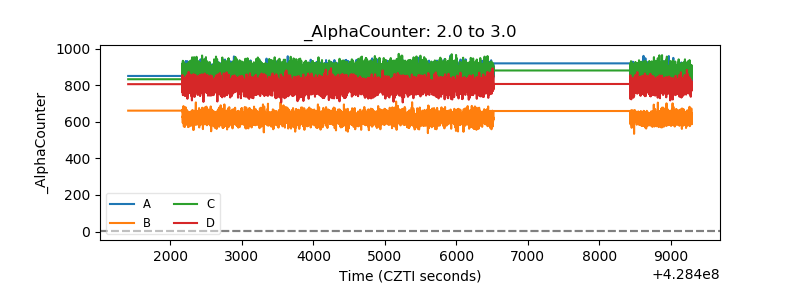 |
| _CPM_Rate | 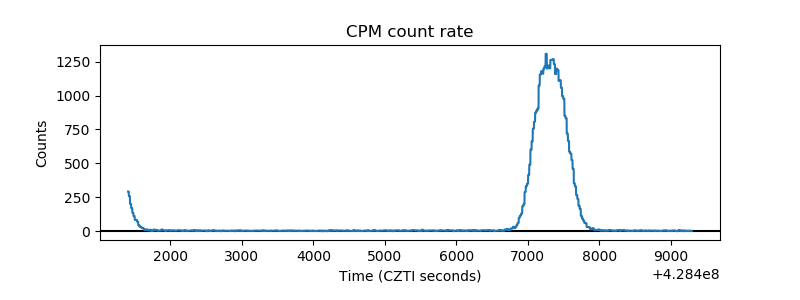 |
| CZT Counter | 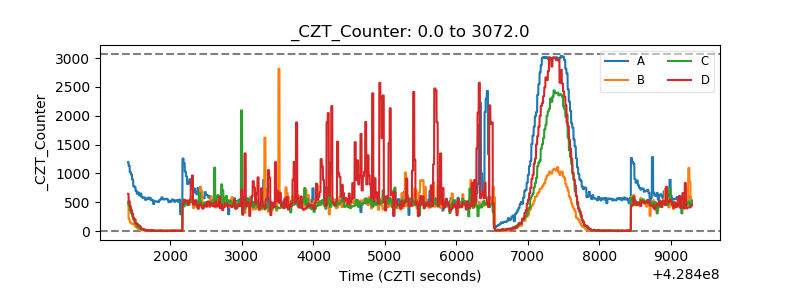 |
| +2.5 Volts monitor | 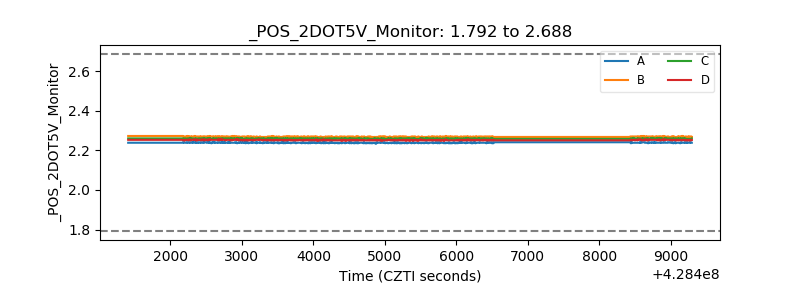 |
| +5 Volts monitor | 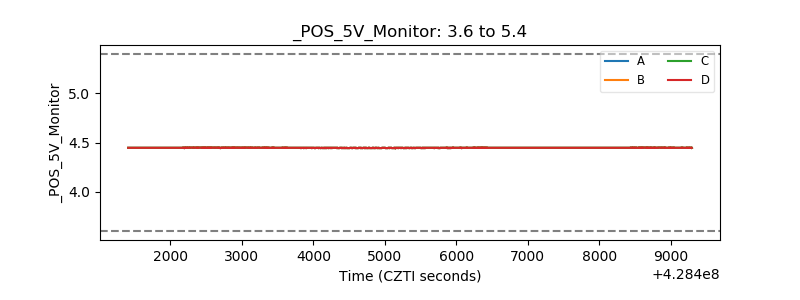 |
| _ROLL_ROT | 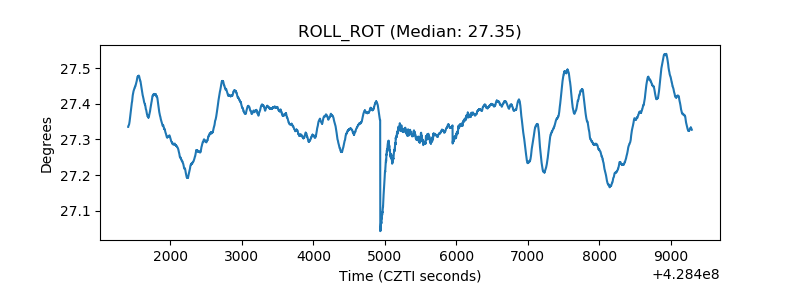 |
| _Roll_DEC | 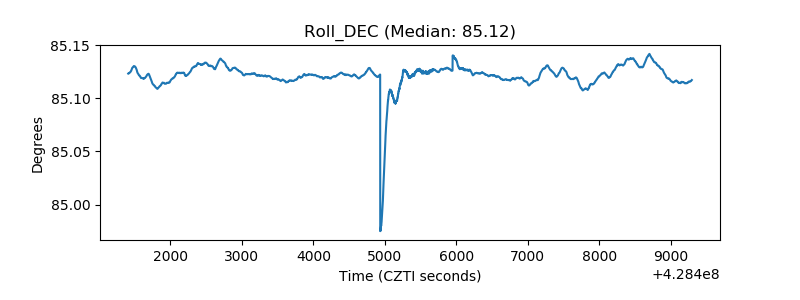 |
| _Roll_RA | 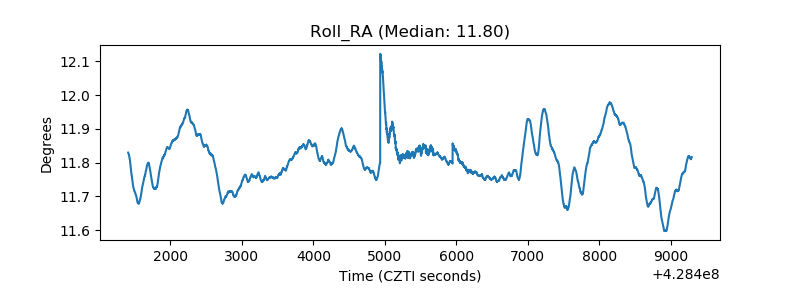 |
| Veto Counter | 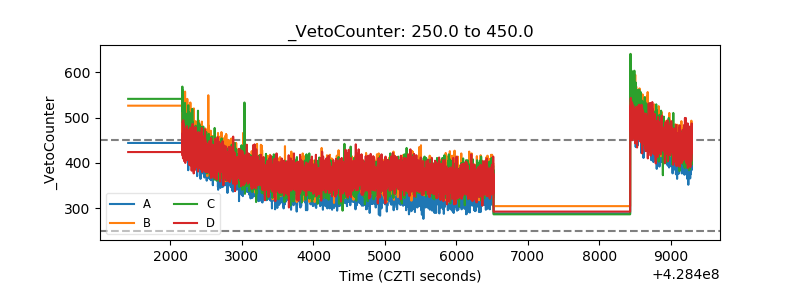 |