| Param | Original file | Final file |
|---|---|---|
| Filename | modeM0/AS1C06_010T01_9000005800_42372cztM0_level2.fits | modeM0/AS1C06_010T01_9000005800_42372cztM0_level2_quad_clean.evt |
| Size (bytes) | 330,240,960 | 89,579,520 |
| Size | 314.9 MB | 85.4 MB |
| Events in quadrant A | 2,891,018 | 622,973 |
| Events in quadrant B | 2,704,321 | 617,731 |
| Events in quadrant C | 2,498,949 | 592,817 |
| Events in quadrant D | 3,738,435 | 526,689 |
| Mode M9 | |||
|---|---|---|---|
| Quadrant | BADHDUFLAG | Total packets | Discarded packets |
| A | 0 | 20 | 0 |
| B | 0 | 20 | 0 |
| C | 0 | 20 | 0 |
| D | 0 | 20 | 0 |
| Mode M0 | |||
|---|---|---|---|
| Quadrant | BADHDUFLAG | Total packets | Discarded packets |
| A | 0 | 11513 | 2 |
| B | 0 | 11249 | 3 |
| C | 0 | 10260 | 2 |
| D | 0 | 14441 | 2 |
| Mode SS | |||
|---|---|---|---|
| Quadrant | BADHDUFLAG | Total packets | Discarded packets |
| A | 0 | 102 | 0 |
| B | 0 | 102 | 0 |
| C | 0 | 102 | 0 |
| D | 0 | 102 | 0 |
| Quadrant | Total seconds | Saturated seconds | Saturation percentage |
|---|---|---|---|
| A | 5027 | 12 | 0.238711% |
| B | 5026 | 58 | 1.153999% |
| C | 5027 | 2 | 0.039785% |
| D | 5027 | 360 | 7.161329% |
Noise dominated data is calculated using 1-second bins in cleaned event files. If a bin has >2000 counts, and if more than 50% of those come from <1% of pixels, then it is considered to be noise-dominated and hence unusable.
| Quadrant | # 1 sec bins | Bins with >0 counts | Bins with >2000 counts | High rate bins dominated by noise | Noise dominated (total time) | Noise dominated (detector-on time) | Marked lightcurve |
|---|---|---|---|---|---|---|---|
| A | 7060 | 5028 | 2 | 2 | 0.03% | 0.04% | 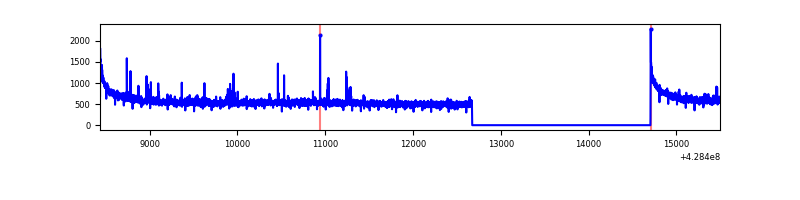 |
| B | 7059 | 5027 | 35 | 35 | 0.50% | 0.70% | 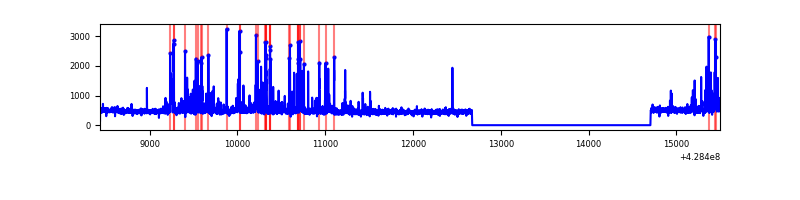 |
| C | 7060 | 5028 | 0 | 0 | 0.00% | 0.00% | 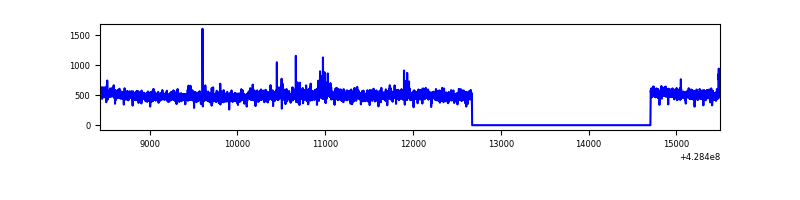 |
| D | 7060 | 5028 | 312 | 312 | 4.42% | 6.21% | 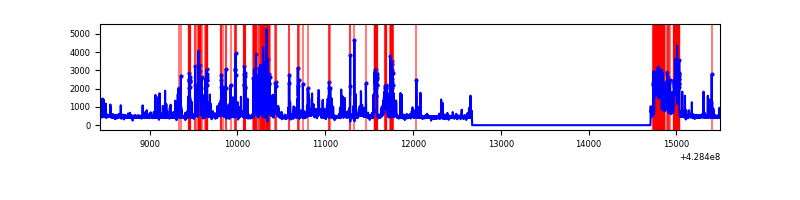 |
Top three noisy pixels from each quadrant. If the there are fewer than three noisy pixels in the level2.evt file, extra rows are filled as -1
| Pixel properties | Quadrant properties | ||||||
|---|---|---|---|---|---|---|---|
| Quadrant | DetID | PixID | Counts | Sigma | Mean | Median | Sigma |
| A | 10 | 83 | 598481 | 5107.57 | 576 | 565 | 117.1 |
| A | 13 | 248 | 30133 | 252.58 | 576 | 565 | 117.1 |
| A | 10 | 255 | 12465 | 101.65 | 576 | 565 | 117.1 |
| B | 5 | 172 | 120378 | 1131.11 | 561 | 547 | 105.9 |
| B | 7 | 221 | 96127 | 902.2 | 561 | 547 | 105.9 |
| B | 15 | 35 | 60597 | 566.82 | 561 | 547 | 105.9 |
| C | 15 | 214 | 217809 | 1699.81 | 554 | 557 | 127.8 |
| C | 8 | 79 | 96565 | 751.18 | 554 | 557 | 127.8 |
| C | 12 | 249 | 7819 | 56.82 | 554 | 557 | 127.8 |
| D | 12 | 233 | 738471 | 5583.53 | 549 | 534 | 132.2 |
| D | 10 | 118 | 256681 | 1938.11 | 549 | 534 | 132.2 |
| D | 10 | 199 | 147596 | 1112.73 | 549 | 534 | 132.2 |
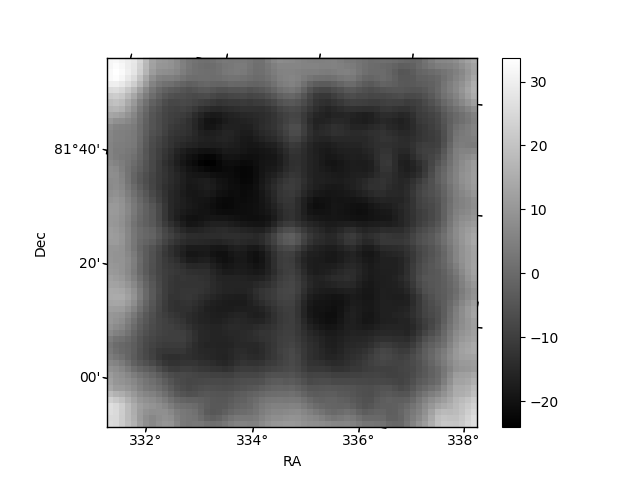
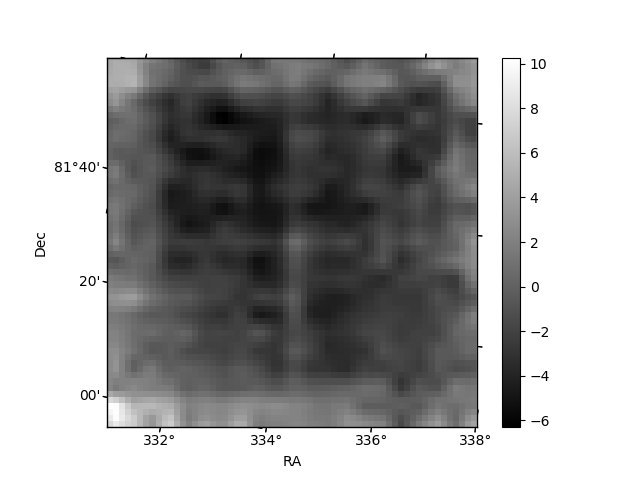
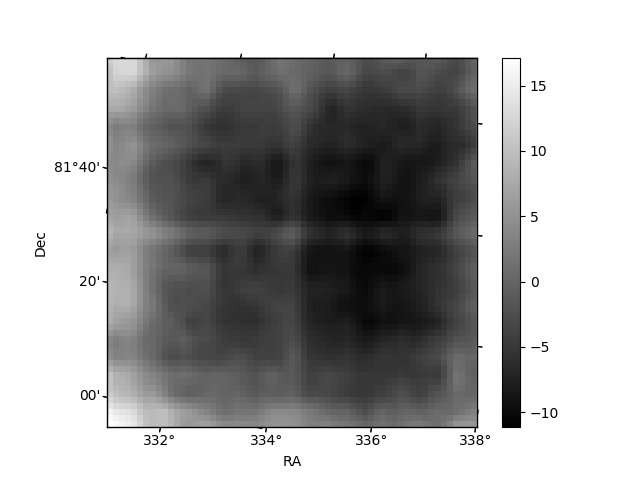
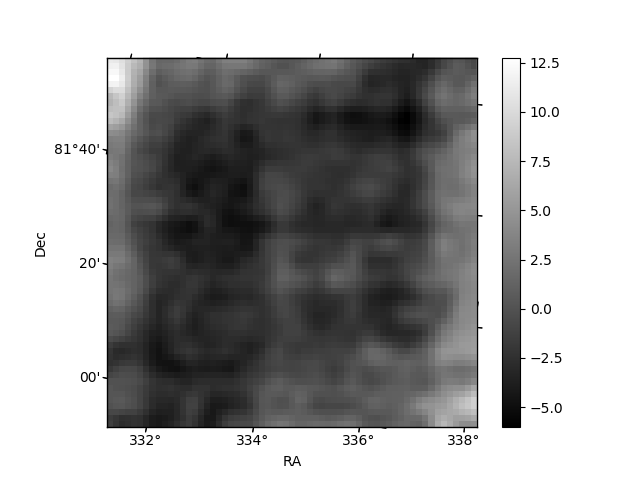
Histogram calculated using DETX and DETY for each event in the final _common_clean file
| Quadrant A | 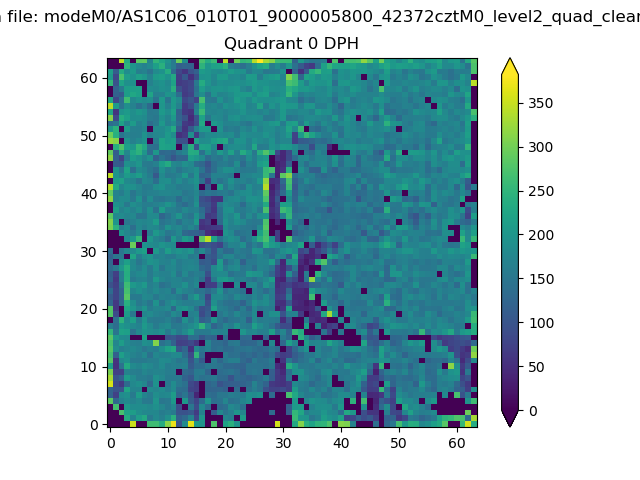 |
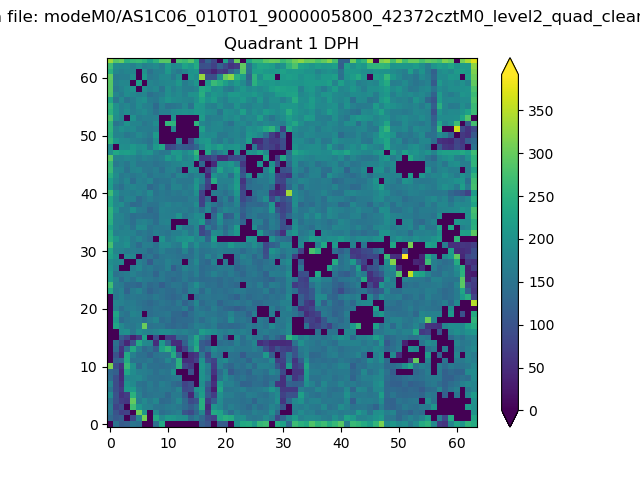 |
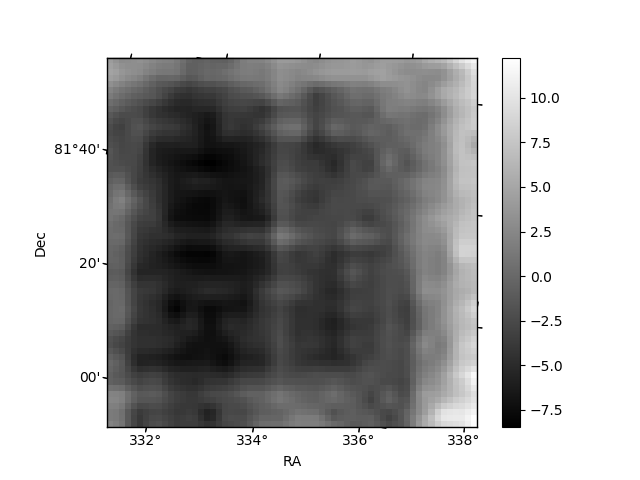
Quadrant B |
|---|---|---|---|
| Quadrant D | 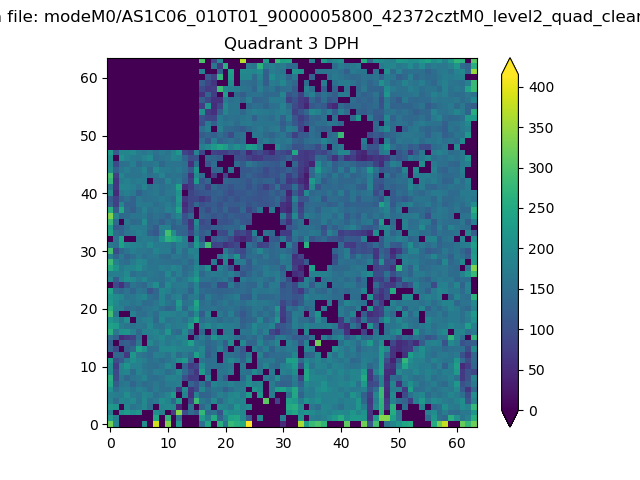 |
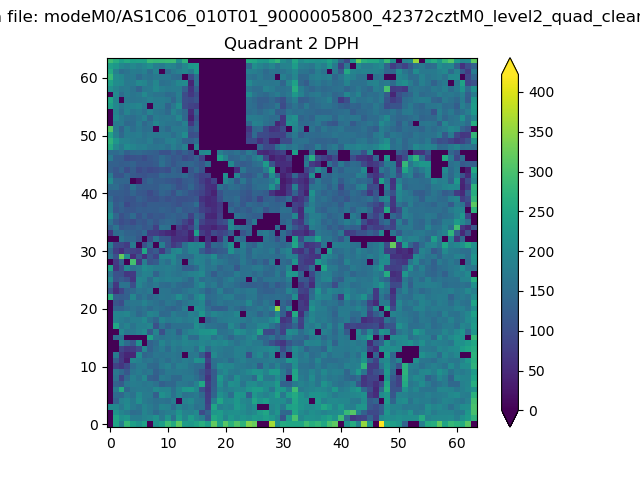 |
Quadrant C |
| Plot type | Count rate plots | Images |
|---|---|---|
| Comparison with Poisson distribution Blue bars denote a histogram of data divided into 1 sec bins. Red curve is a Poisson curve with rate = median count rate of data. |
 |
 |
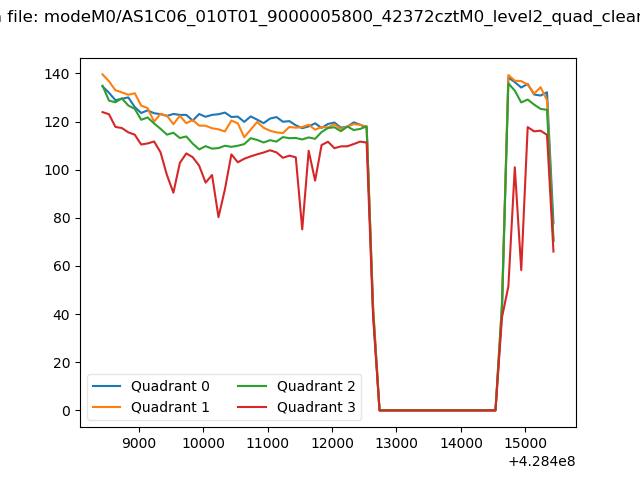
| Quadrant-wise count rates Data is divided into 100 sec bins |
 |
|
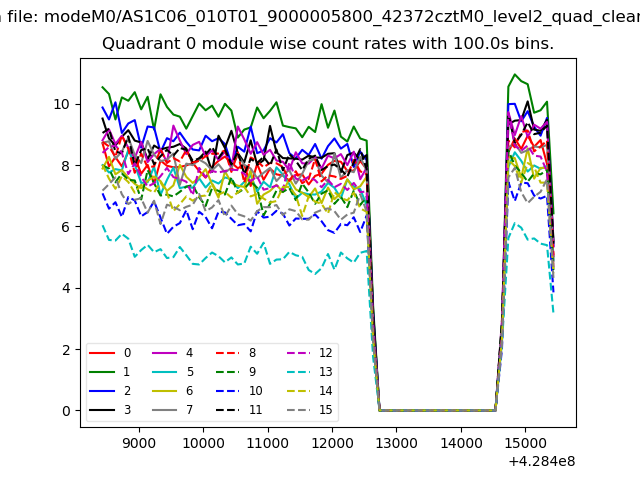
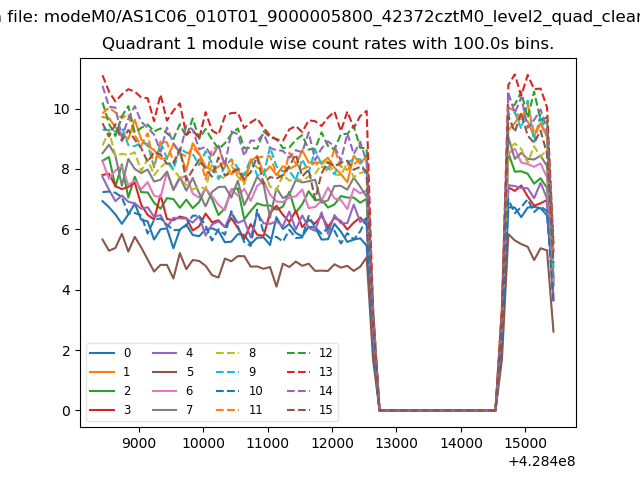
| Module-wise count rates for Quadrant A Data is divided into 100 sec bins |
 |
 |
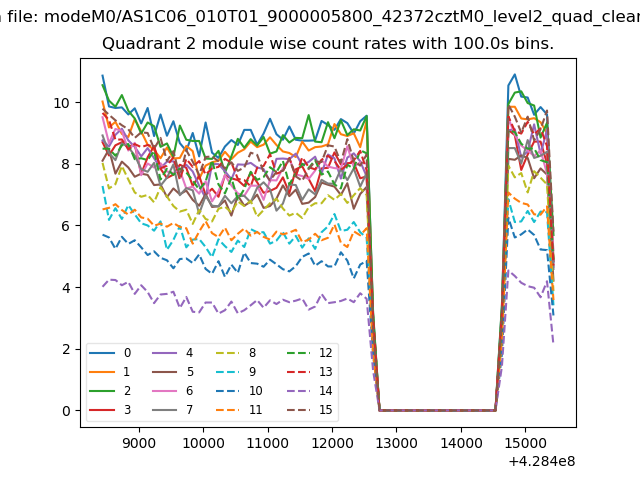
| Module-wise count rates for Quadrant B Data is divided into 100 sec bins |
 |
 |
| Module-wise count rates for Quadrant C Data is divided into 100 sec bins |
 |
 |
| Module-wise count rates for Quadrant D Data is divided into 100 sec bins |
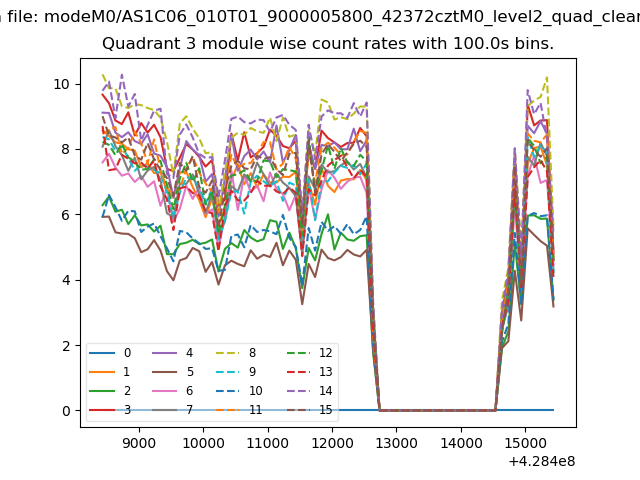 |
 |
| Parameter | Plot |
|---|---|
| CZT HV Monitor | 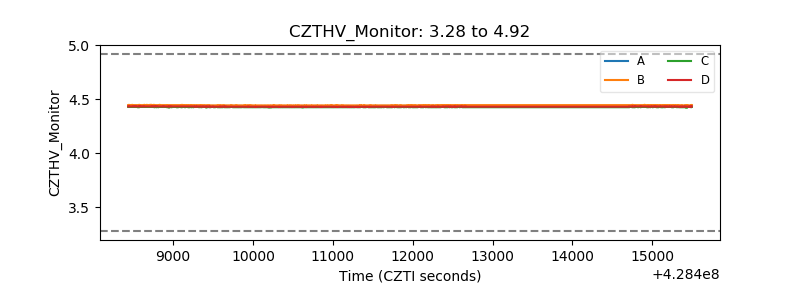 |
| D_VDD | 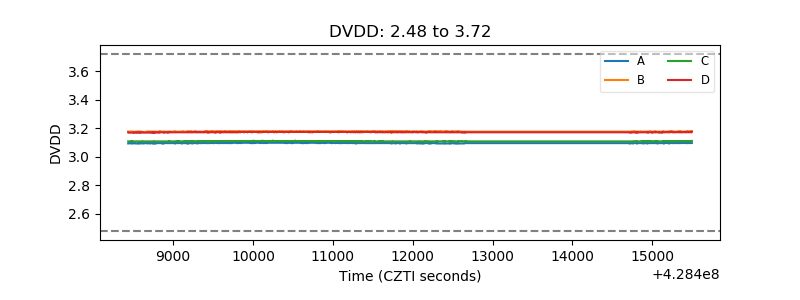 |
| Temperature 1 | 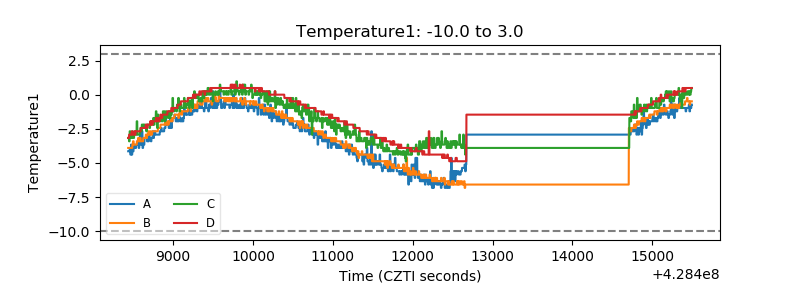 |
| Veto HV Monitor |  |
| Veto LLD | 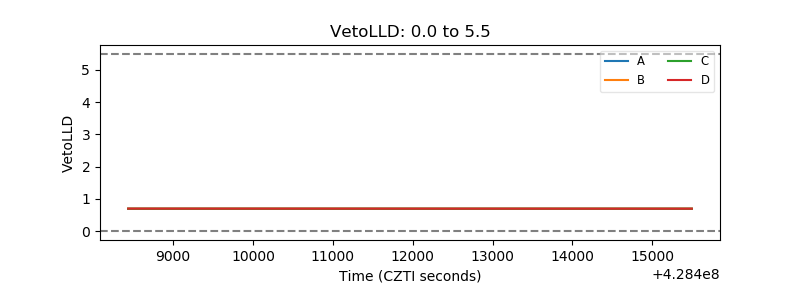 |
| Alpha Counter | 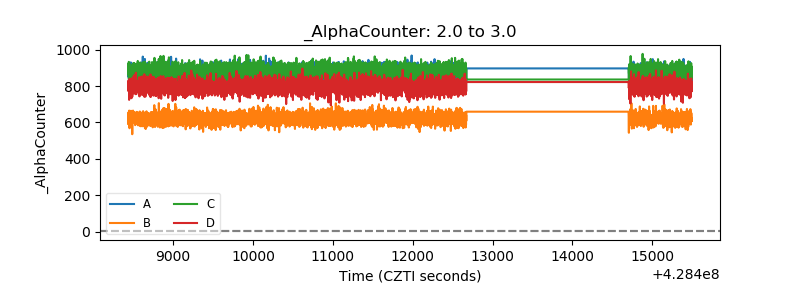 |
| _CPM_Rate | 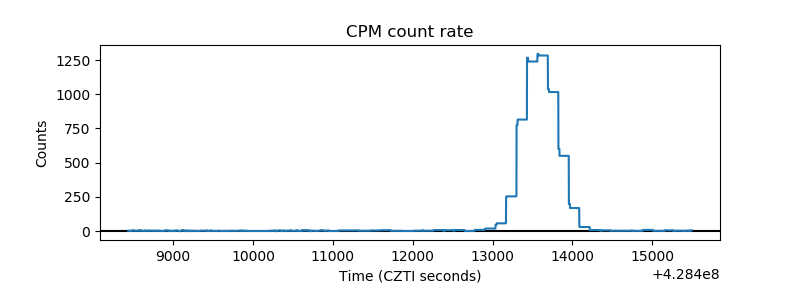 |
| CZT Counter | 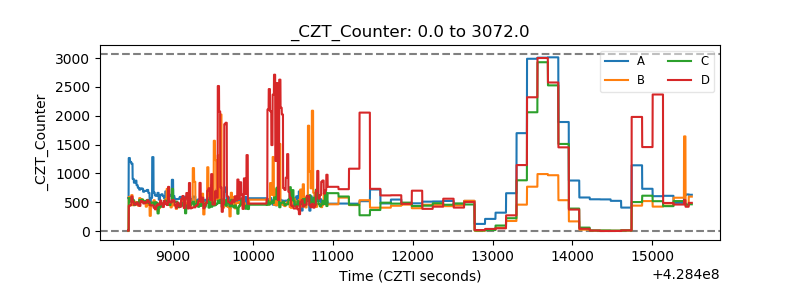 |
| +2.5 Volts monitor | 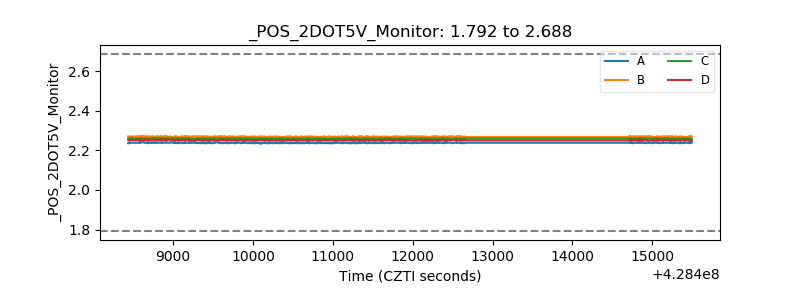 |
| +5 Volts monitor | 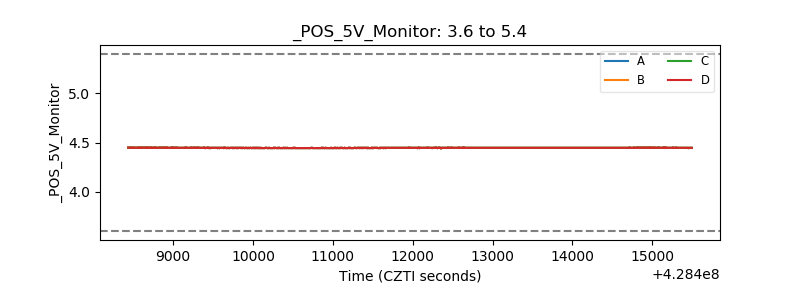 |
| _ROLL_ROT | 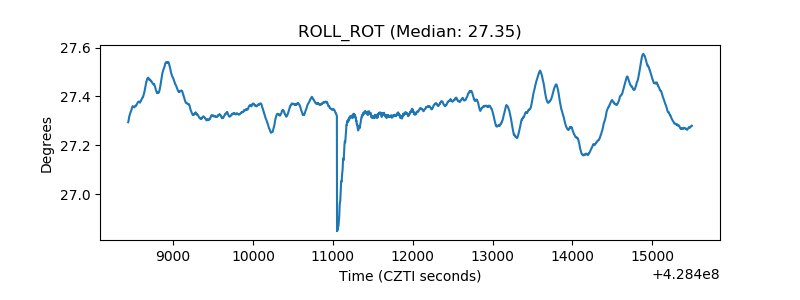 |
| _Roll_DEC | 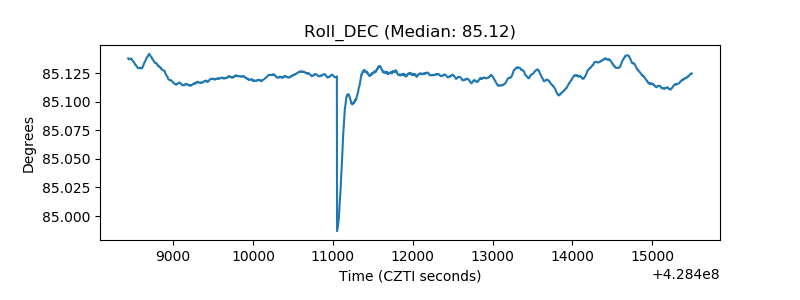 |
| _Roll_RA | 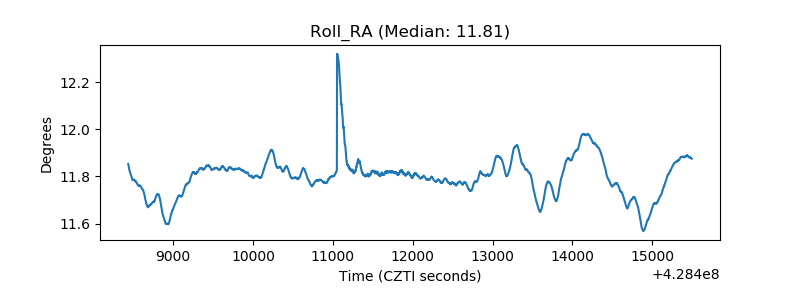 |
| Veto Counter | 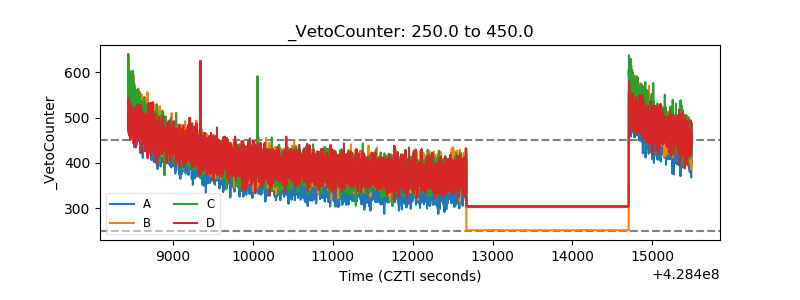 |