| Param | Original file | Final file |
|---|---|---|
| Filename | modeM0/AS1C06_010T01_9000005800_42373cztM0_level2.fits | modeM0/AS1C06_010T01_9000005800_42373cztM0_level2_quad_clean.evt |
| Size (bytes) | 336,384,000 | 94,155,840 |
| Size | 320.8 MB | 89.8 MB |
| Events in quadrant A | 3,009,964 | 656,381 |
| Events in quadrant B | 2,847,751 | 643,396 |
| Events in quadrant C | 2,778,046 | 618,443 |
| Events in quadrant D | 3,409,232 | 566,698 |
| Mode M9 | |||
|---|---|---|---|
| Quadrant | BADHDUFLAG | Total packets | Discarded packets |
| A | 0 | 21 | 0 |
| B | 0 | 22 | 0 |
| C | 0 | 22 | 0 |
| D | 0 | 22 | 0 |
| Mode M0 | |||
|---|---|---|---|
| Quadrant | BADHDUFLAG | Total packets | Discarded packets |
| A | 0 | 12014 | 2 |
| B | 0 | 11900 | 2 |
| C | 0 | 11286 | 2 |
| D | 0 | 13732 | 7 |
| Mode SS | |||
|---|---|---|---|
| Quadrant | BADHDUFLAG | Total packets | Discarded packets |
| A | 0 | 108 | 0 |
| B | 0 | 108 | 0 |
| C | 0 | 108 | 0 |
| D | 0 | 108 | 0 |
| Quadrant | Total seconds | Saturated seconds | Saturation percentage |
|---|---|---|---|
| A | 5223 | 15 | 0.287191% |
| B | 5223 | 86 | 1.646563% |
| C | 5223 | 26 | 0.497798% |
| D | 5222 | 228 | 4.366143% |
Noise dominated data is calculated using 1-second bins in cleaned event files. If a bin has >2000 counts, and if more than 50% of those come from <1% of pixels, then it is considered to be noise-dominated and hence unusable.
| Quadrant | # 1 sec bins | Bins with >0 counts | Bins with >2000 counts | High rate bins dominated by noise | Noise dominated (total time) | Noise dominated (detector-on time) | Marked lightcurve |
|---|---|---|---|---|---|---|---|
| A | 7345 | 5224 | 6 | 6 | 0.08% | 0.11% | 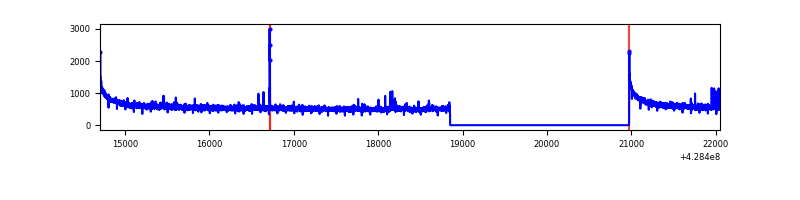 |
| B | 7345 | 5224 | 51 | 51 | 0.69% | 0.98% | 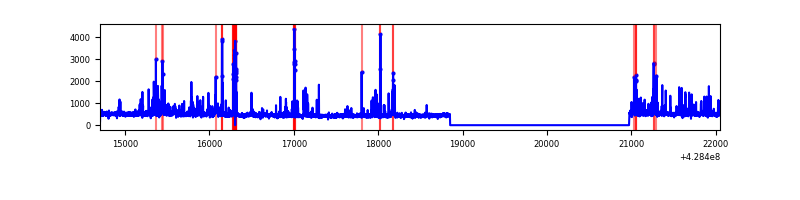 |
| C | 7345 | 5224 | 19 | 19 | 0.26% | 0.36% | 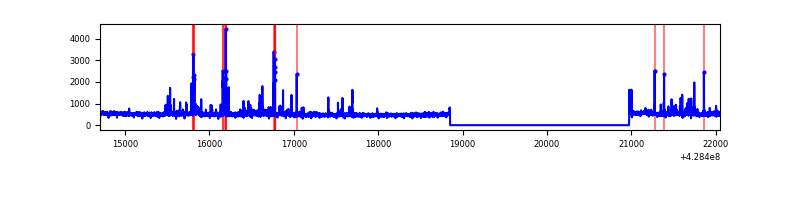 |
| D | 7344 | 5223 | 183 | 183 | 2.49% | 3.50% | 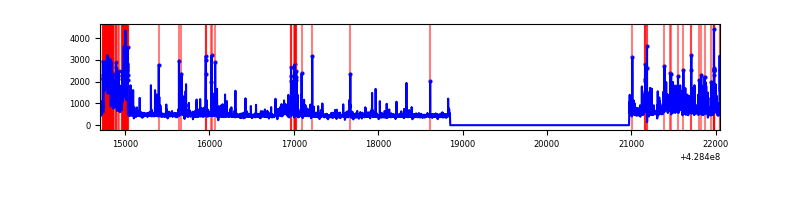 |
Top three noisy pixels from each quadrant. If the there are fewer than three noisy pixels in the level2.evt file, extra rows are filled as -1
| Pixel properties | Quadrant properties | ||||||
|---|---|---|---|---|---|---|---|
| Quadrant | DetID | PixID | Counts | Sigma | Mean | Median | Sigma |
| A | 10 | 83 | 625622 | 5138.43 | 599 | 588 | 121.6 |
| A | 7 | 3 | 28459 | 229.13 | 599 | 588 | 121.6 |
| A | 10 | 255 | 15196 | 120.09 | 599 | 588 | 121.6 |
| B | 5 | 172 | 168754 | 1550.17 | 582 | 568 | 108.5 |
| B | 5 | 255 | 137652 | 1263.5 | 582 | 568 | 108.5 |
| B | 7 | 221 | 74535 | 681.75 | 582 | 568 | 108.5 |
| C | 15 | 214 | 226119 | 1704.84 | 579 | 581 | 132.3 |
| C | 14 | 254 | 81952 | 615.08 | 579 | 581 | 132.3 |
| C | 15 | 111 | 68739 | 515.21 | 579 | 581 | 132.3 |
| D | 12 | 233 | 579106 | 4127.06 | 580 | 563 | 140.2 |
| D | 1 | 52 | 174447 | 1240.41 | 580 | 563 | 140.2 |
| D | 10 | 118 | 73038 | 517.0 | 580 | 563 | 140.2 |
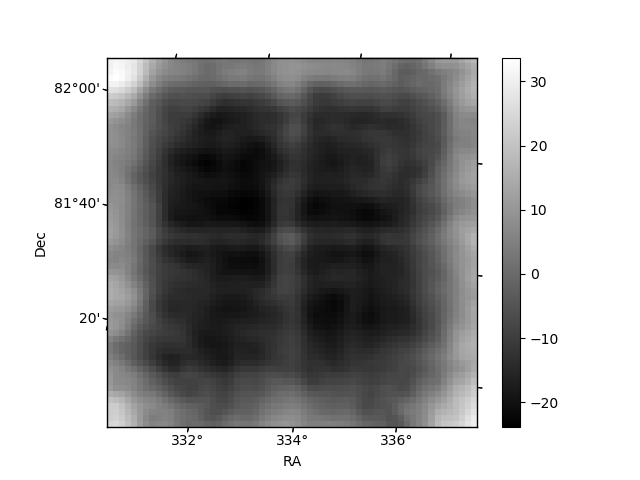
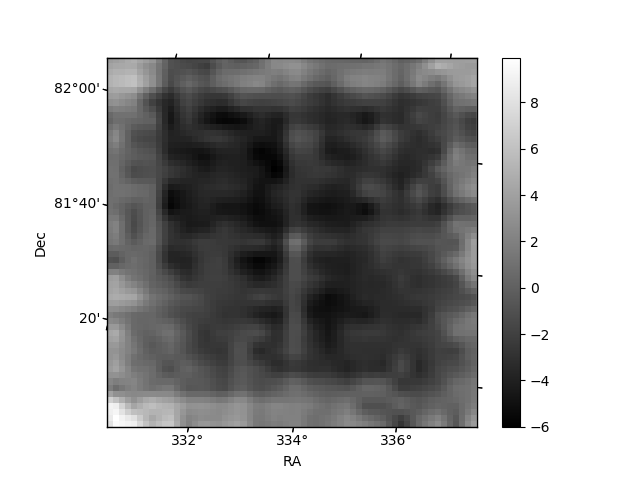
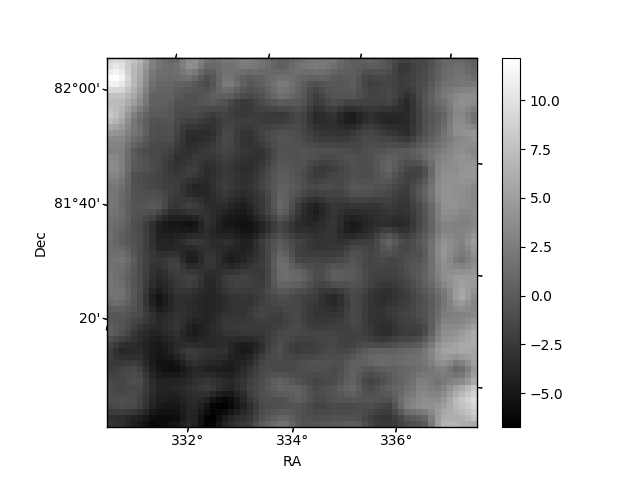
Histogram calculated using DETX and DETY for each event in the final _common_clean file
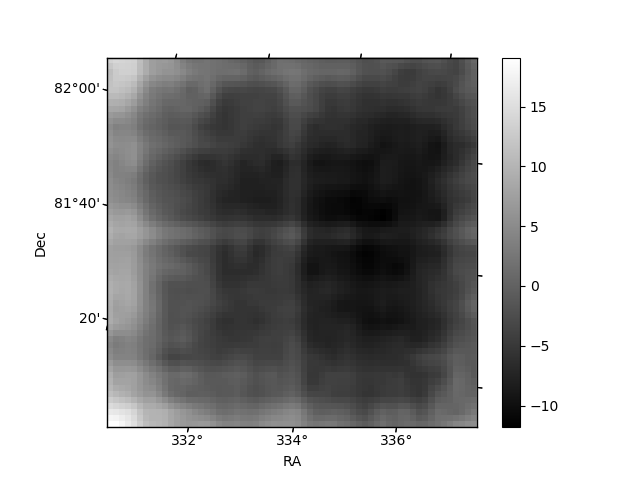
| Quadrant A | 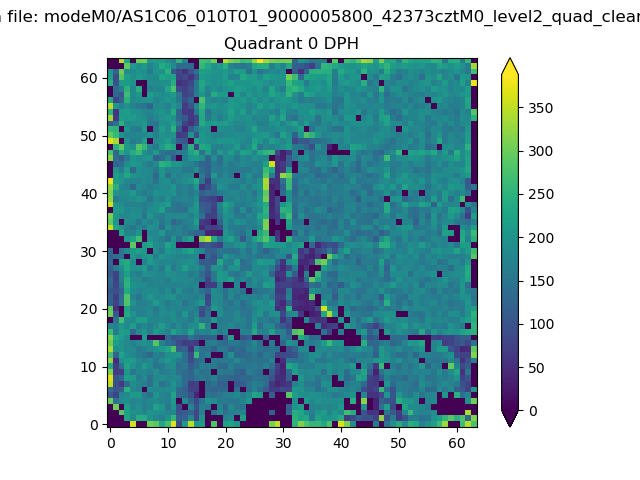 |
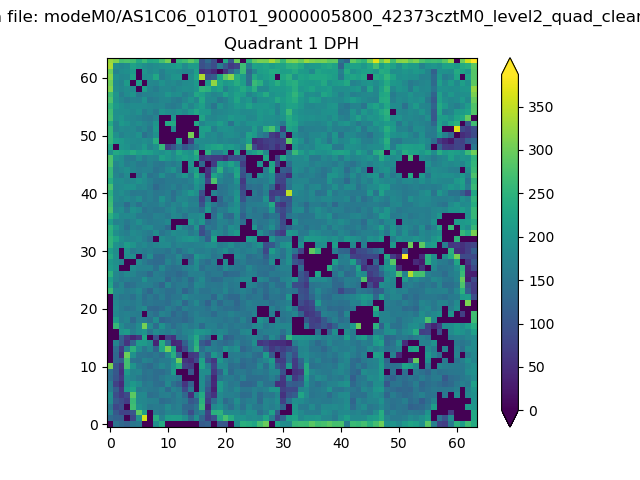 |
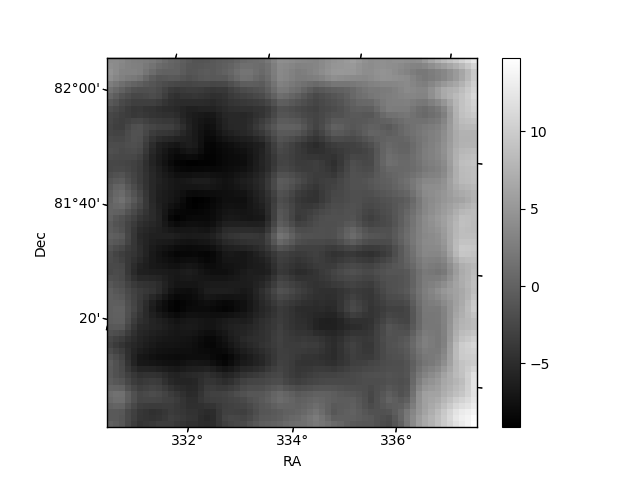
Quadrant B |
|---|---|---|---|
| Quadrant D |  |
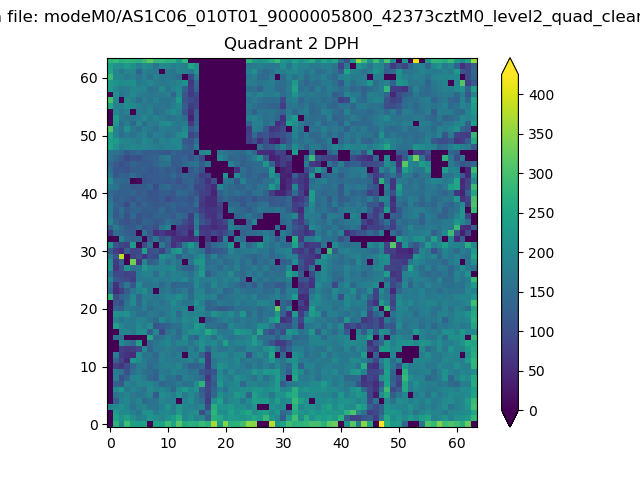 |
Quadrant C |
| Plot type | Count rate plots | Images |
|---|---|---|
| Comparison with Poisson distribution Blue bars denote a histogram of data divided into 1 sec bins. Red curve is a Poisson curve with rate = median count rate of data. |
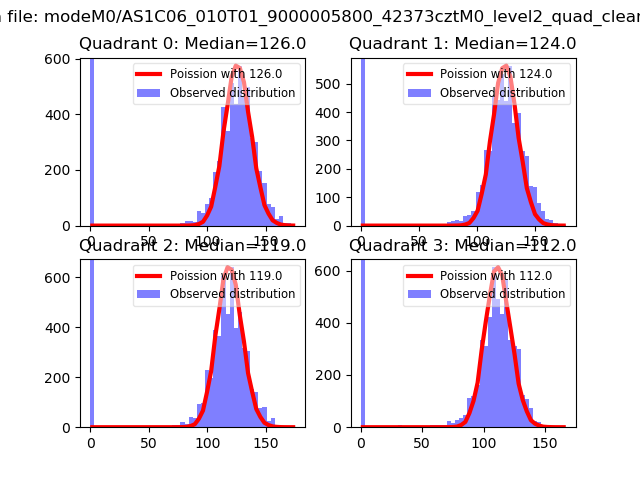 |
 |
| Quadrant-wise count rates Data is divided into 100 sec bins |
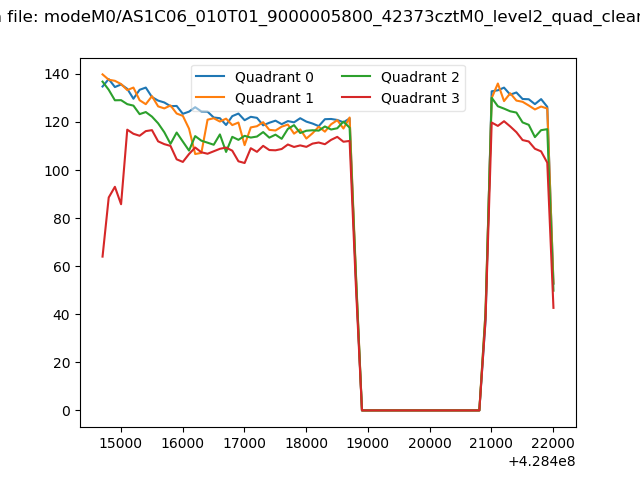 |
|
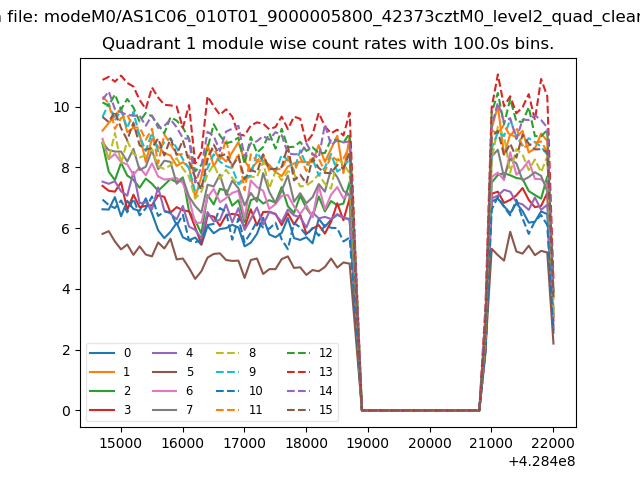
| Module-wise count rates for Quadrant A Data is divided into 100 sec bins |
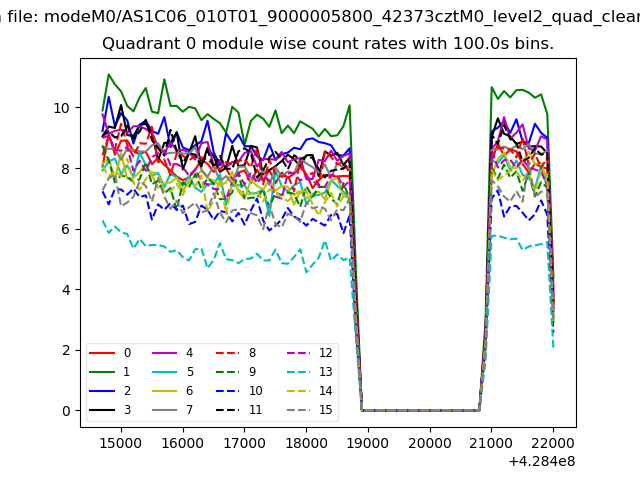 |
 |
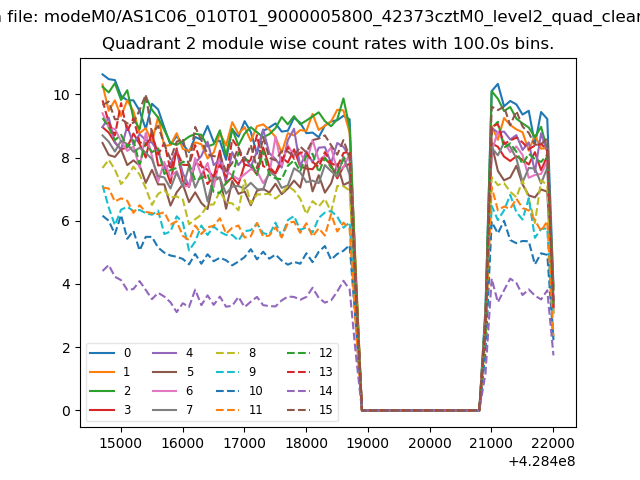
| Module-wise count rates for Quadrant B Data is divided into 100 sec bins |
 |
 |
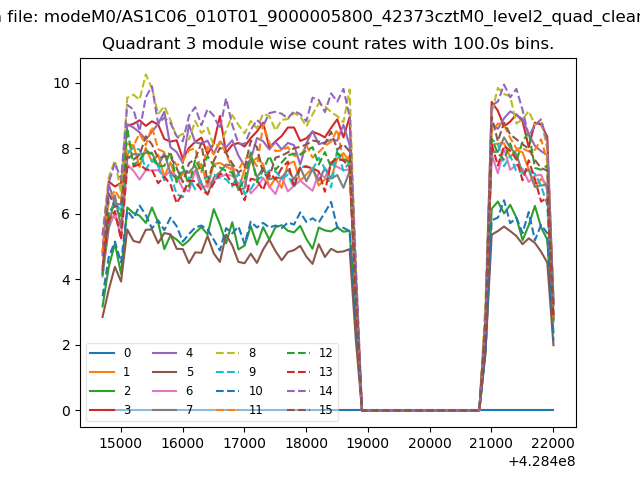
| Module-wise count rates for Quadrant C Data is divided into 100 sec bins |
 |
 |
| Module-wise count rates for Quadrant D Data is divided into 100 sec bins |
 |
 |
| Parameter | Plot |
|---|---|
| CZT HV Monitor | 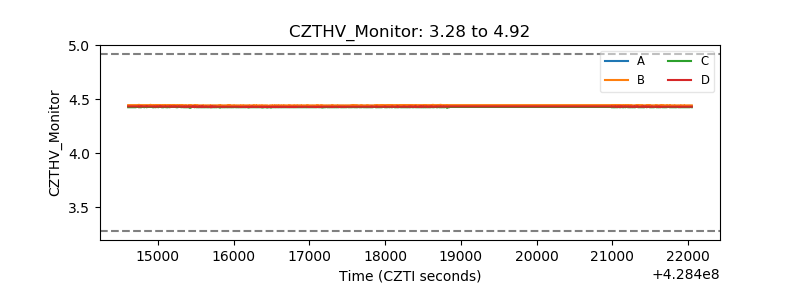 |
| D_VDD | 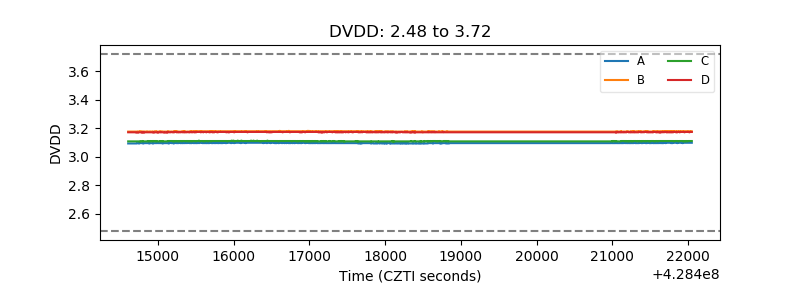 |
| Temperature 1 | 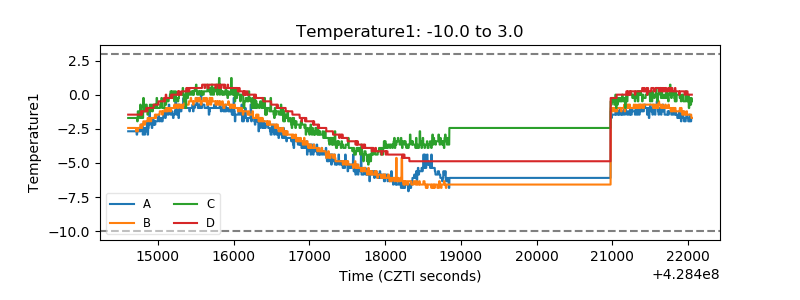 |
| Veto HV Monitor | 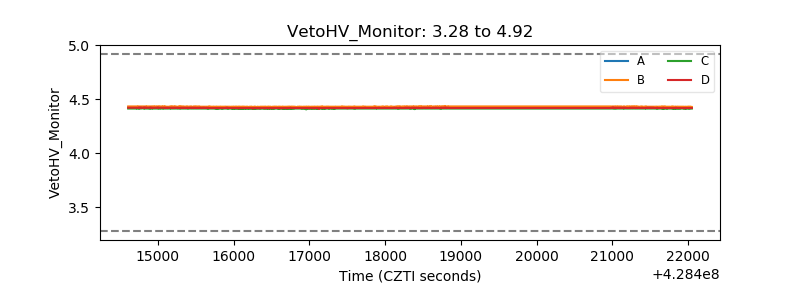 |
| Veto LLD | 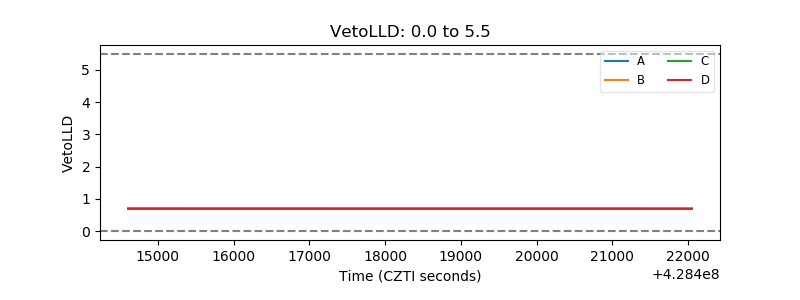 |
| Alpha Counter | 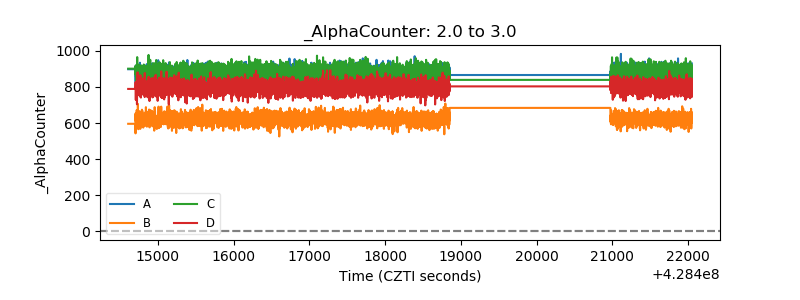 |
| _CPM_Rate | 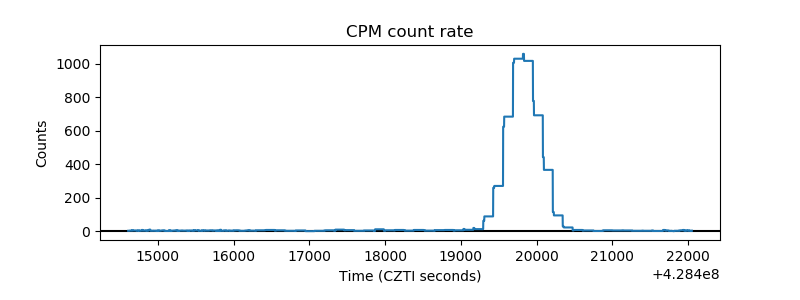 |
| CZT Counter | 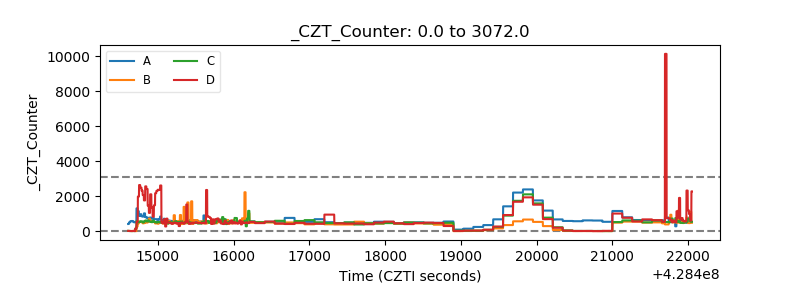 |
| +2.5 Volts monitor | 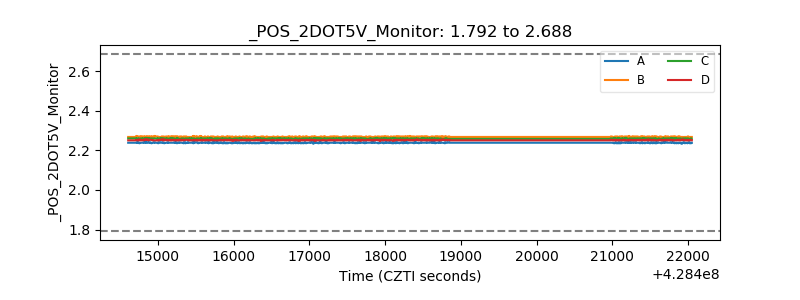 |
| +5 Volts monitor | 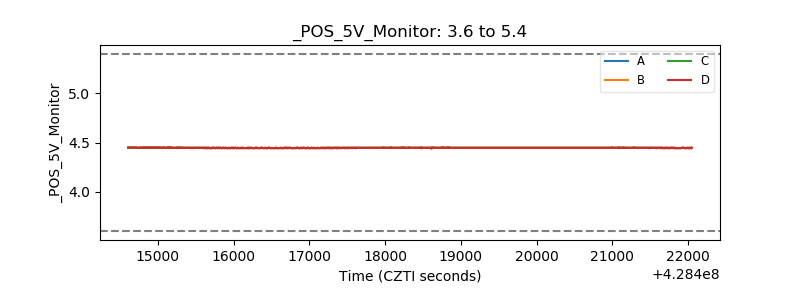 |
| _ROLL_ROT | 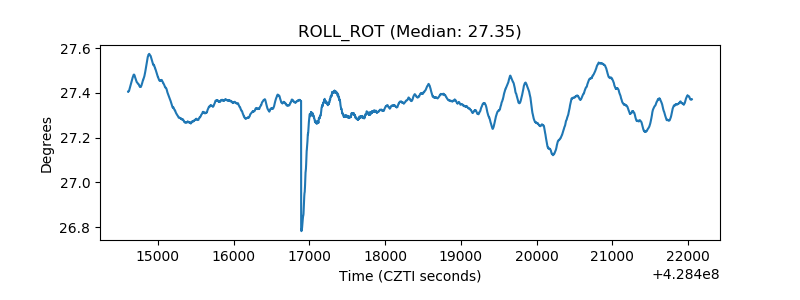 |
| _Roll_DEC | 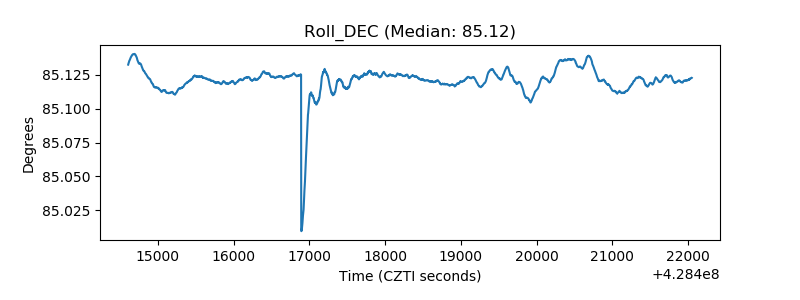 |
| _Roll_RA | 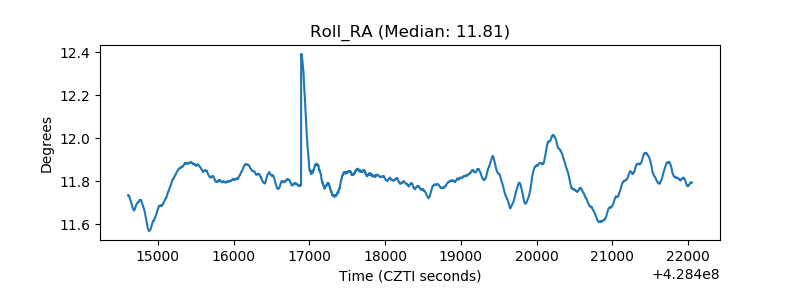 |
| Veto Counter | 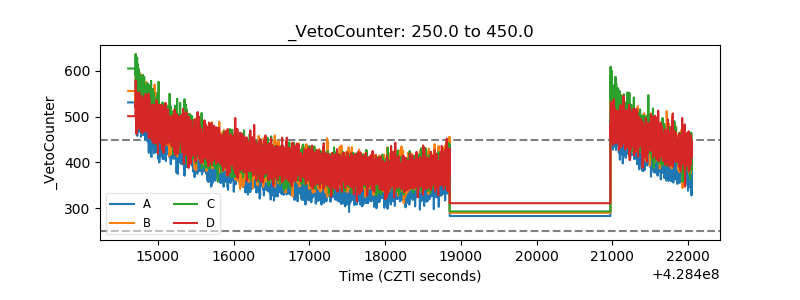 |