| Param | Original file | Final file |
|---|---|---|
| Filename | modeM0/AS1C06_010T01_9000005800_42374cztM0_level2.fits | modeM0/AS1C06_010T01_9000005800_42374cztM0_level2_quad_clean.evt |
| Size (bytes) | 321,868,800 | 88,980,480 |
| Size | 307.0 MB | 84.9 MB |
| Events in quadrant A | 2,861,917 | 611,765 |
| Events in quadrant B | 2,455,607 | 605,908 |
| Events in quadrant C | 2,569,811 | 583,731 |
| Events in quadrant D | 3,634,249 | 539,639 |
| Mode M9 | |||
|---|---|---|---|
| Quadrant | BADHDUFLAG | Total packets | Discarded packets |
| A | 0 | 24 | 0 |
| B | 0 | 25 | 0 |
| C | 0 | 25 | 0 |
| D | 0 | 25 | 0 |
| Mode M0 | |||
|---|---|---|---|
| Quadrant | BADHDUFLAG | Total packets | Discarded packets |
| A | 0 | 11537 | 2 |
| B | 0 | 10768 | 2 |
| C | 0 | 10697 | 2 |
| D | 0 | 14272 | 2 |
| Mode SS | |||
|---|---|---|---|
| Quadrant | BADHDUFLAG | Total packets | Discarded packets |
| A | 0 | 102 | 0 |
| B | 0 | 102 | 0 |
| C | 0 | 102 | 0 |
| D | 0 | 102 | 0 |
| Quadrant | Total seconds | Saturated seconds | Saturation percentage |
|---|---|---|---|
| A | 5043 | 10 | 0.198295% |
| B | 5043 | 27 | 0.535396% |
| C | 5043 | 16 | 0.317271% |
| D | 5043 | 181 | 3.589133% |
Noise dominated data is calculated using 1-second bins in cleaned event files. If a bin has >2000 counts, and if more than 50% of those come from <1% of pixels, then it is considered to be noise-dominated and hence unusable.
| Quadrant | # 1 sec bins | Bins with >0 counts | Bins with >2000 counts | High rate bins dominated by noise | Noise dominated (total time) | Noise dominated (detector-on time) | Marked lightcurve |
|---|---|---|---|---|---|---|---|
| A | 7196 | 5044 | 4 | 4 | 0.06% | 0.08% | 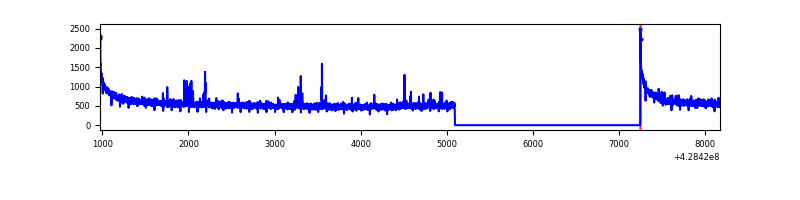 |
| B | 7196 | 5044 | 9 | 9 | 0.13% | 0.18% | 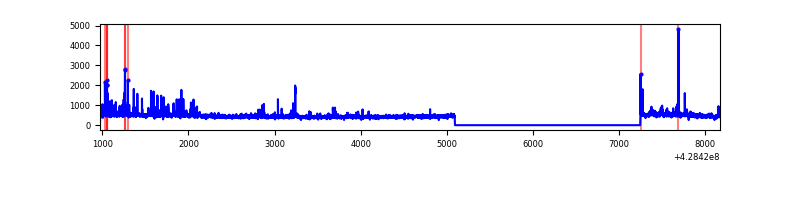 |
| C | 7196 | 5044 | 7 | 7 | 0.10% | 0.14% | 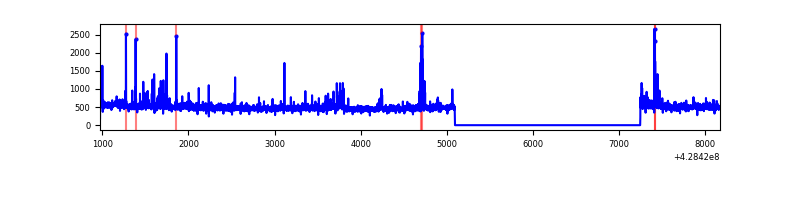 |
| D | 7196 | 5044 | 147 | 147 | 2.04% | 2.91% | 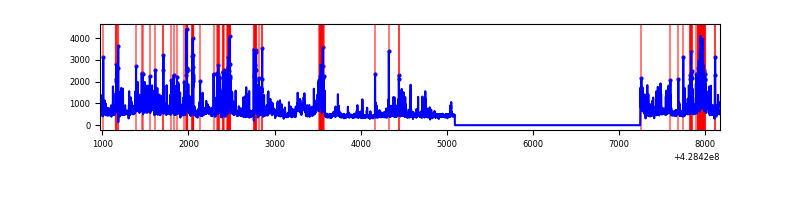 |
Top three noisy pixels from each quadrant. If the there are fewer than three noisy pixels in the level2.evt file, extra rows are filled as -1
| Pixel properties | Quadrant properties | ||||||
|---|---|---|---|---|---|---|---|
| Quadrant | DetID | PixID | Counts | Sigma | Mean | Median | Sigma |
| A | 10 | 83 | 616483 | 5334.61 | 563 | 551 | 115.5 |
| A | 7 | 3 | 28804 | 244.7 | 563 | 551 | 115.5 |
| A | 13 | 6 | 15273 | 127.51 | 563 | 551 | 115.5 |
| B | 5 | 172 | 75204 | 721.33 | 553 | 539 | 103.5 |
| B | 5 | 255 | 55702 | 532.92 | 553 | 539 | 103.5 |
| B | 0 | 230 | 49307 | 471.14 | 553 | 539 | 103.5 |
| C | 15 | 214 | 215723 | 1694.63 | 549 | 552 | 127.0 |
| C | 14 | 254 | 105116 | 823.52 | 549 | 552 | 127.0 |
| C | 9 | 54 | 35569 | 275.78 | 549 | 552 | 127.0 |
| D | 12 | 233 | 507253 | 3831.08 | 548 | 532 | 132.3 |
| D | 1 | 52 | 445106 | 3361.21 | 548 | 532 | 132.3 |
| D | 1 | 47 | 199134 | 1501.54 | 548 | 532 | 132.3 |
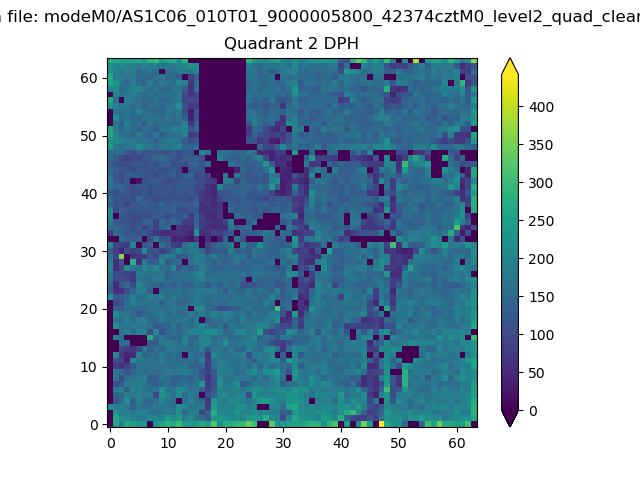
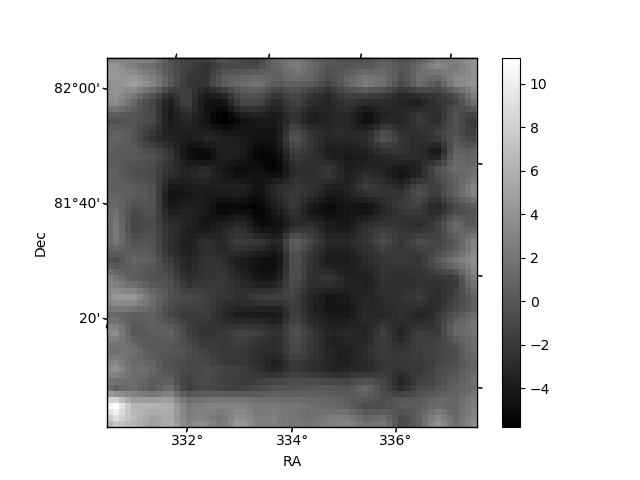
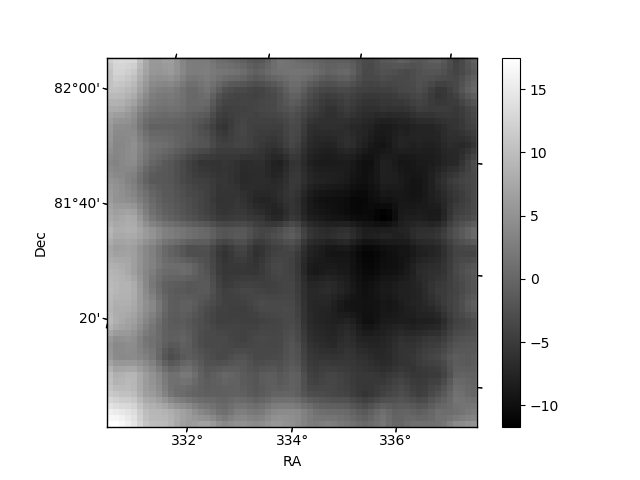
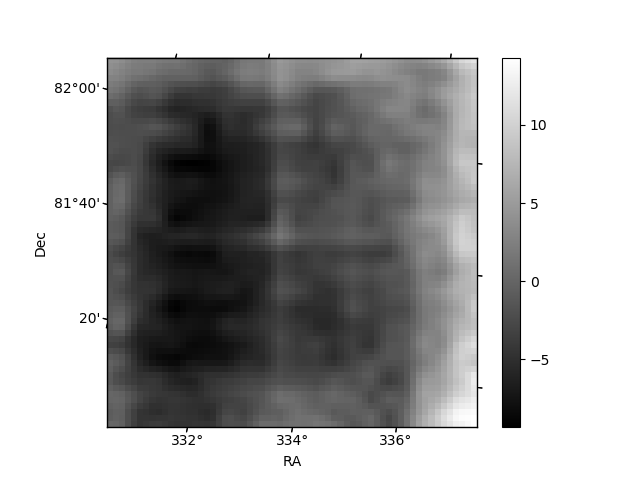
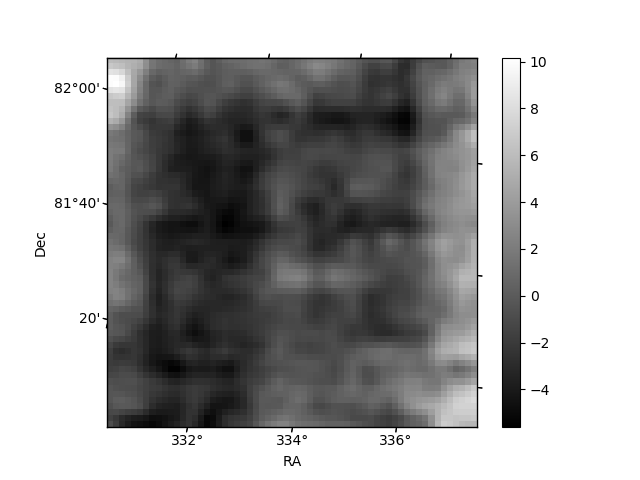
Histogram calculated using DETX and DETY for each event in the final _common_clean file
| Quadrant A | 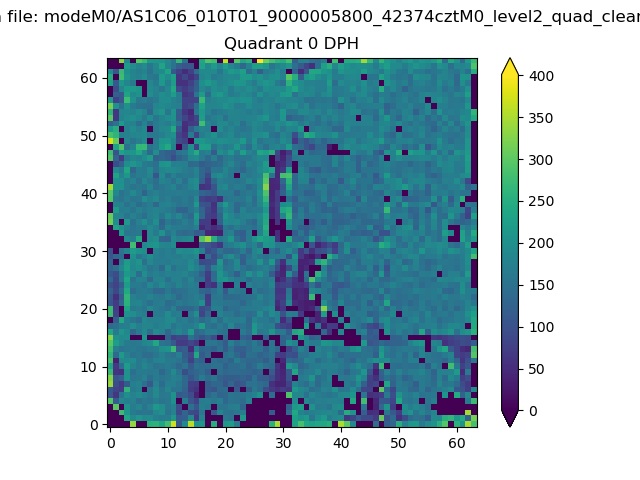 |
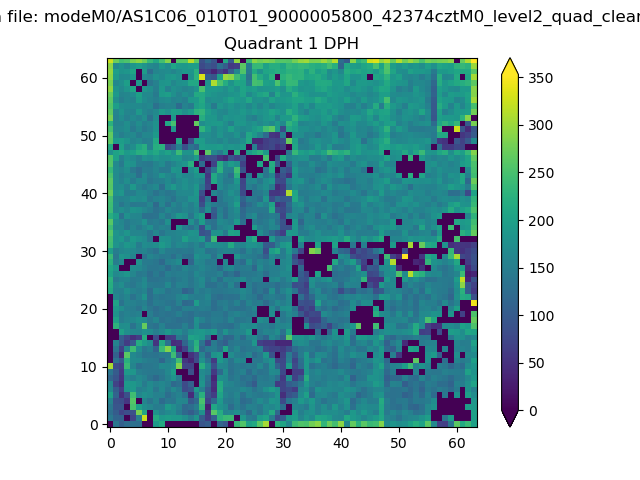 |
Quadrant B |
|---|---|---|---|
| Quadrant D | 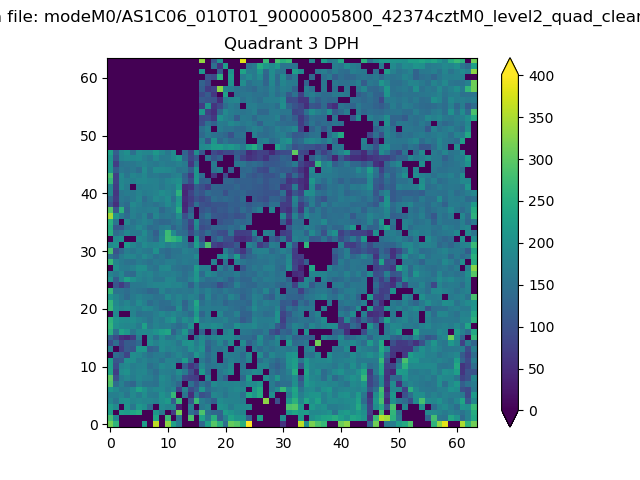 |
 |
Quadrant C |
| Plot type | Count rate plots | Images |
|---|---|---|
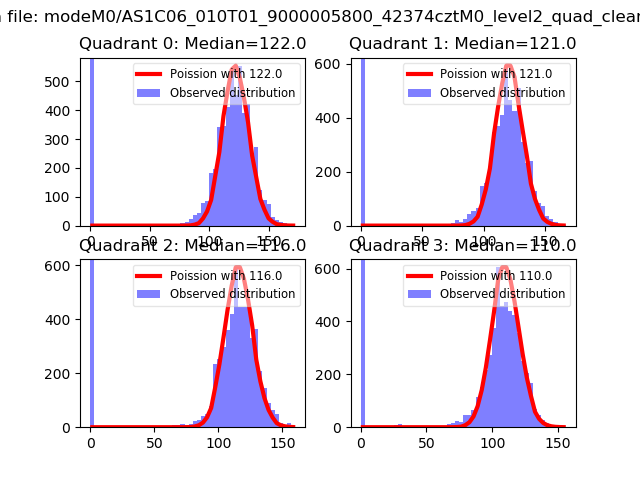
| Comparison with Poisson distribution Blue bars denote a histogram of data divided into 1 sec bins. Red curve is a Poisson curve with rate = median count rate of data. |
 |
 |
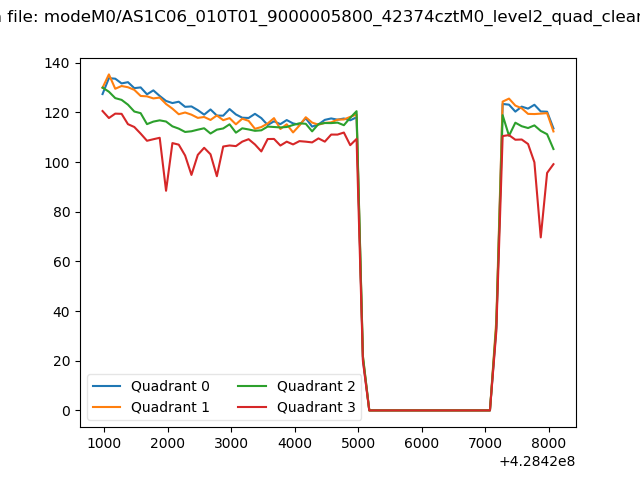
| Quadrant-wise count rates Data is divided into 100 sec bins |
 |
|
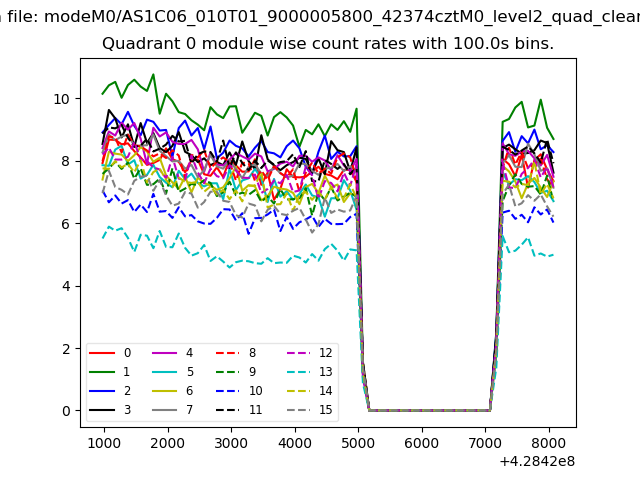
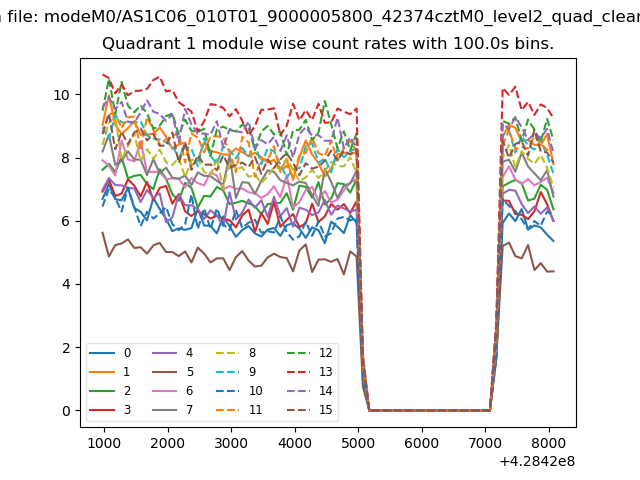
| Module-wise count rates for Quadrant A Data is divided into 100 sec bins |
 |
 |
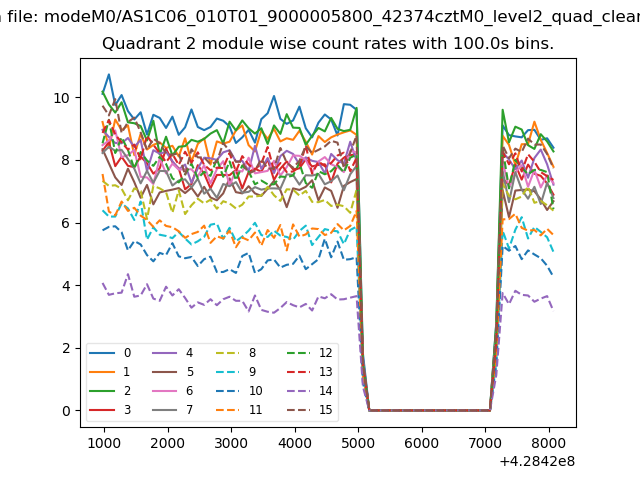
| Module-wise count rates for Quadrant B Data is divided into 100 sec bins |
 |
 |
| Module-wise count rates for Quadrant C Data is divided into 100 sec bins |
 |
 |
| Module-wise count rates for Quadrant D Data is divided into 100 sec bins |
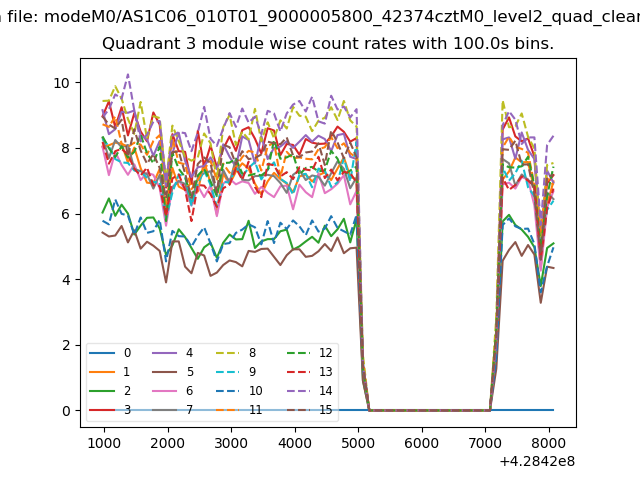 |
 |
| Parameter | Plot |
|---|---|
| CZT HV Monitor | 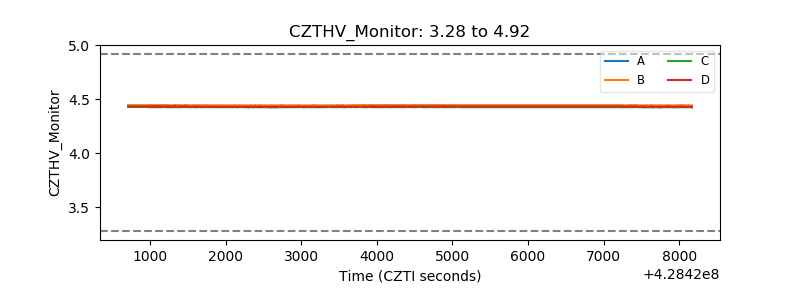 |
| D_VDD | 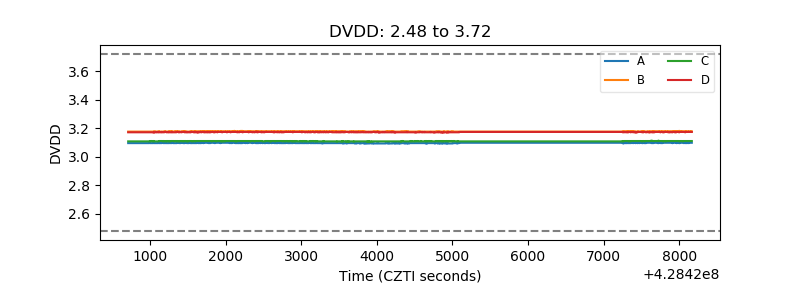 |
| Temperature 1 | 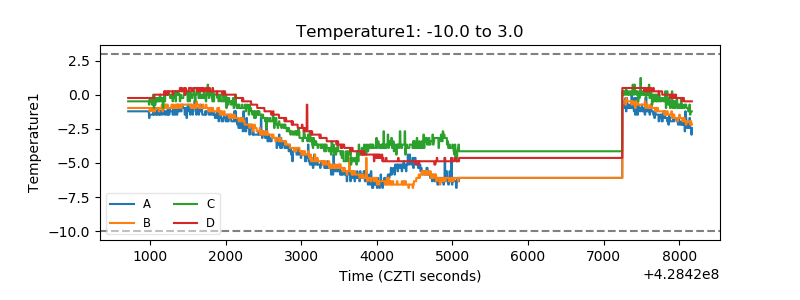 |
| Veto HV Monitor | 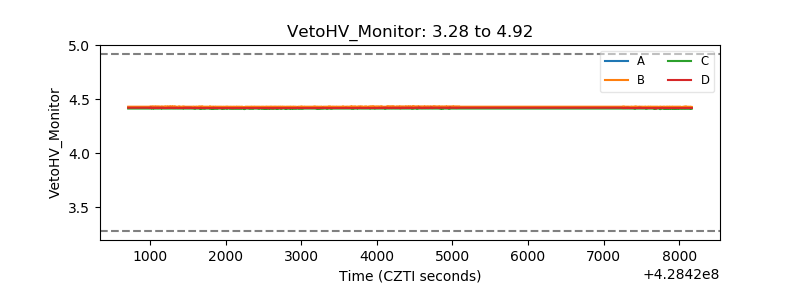 |
| Veto LLD | 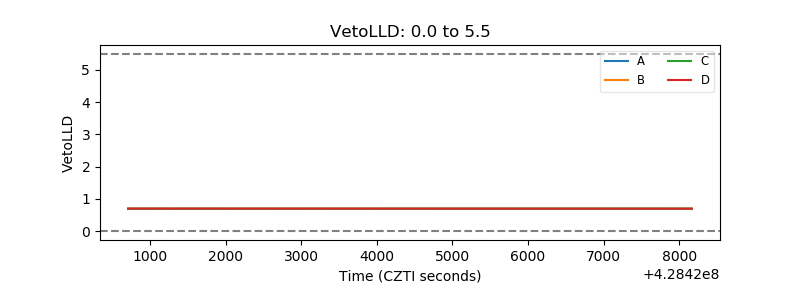 |
| Alpha Counter | 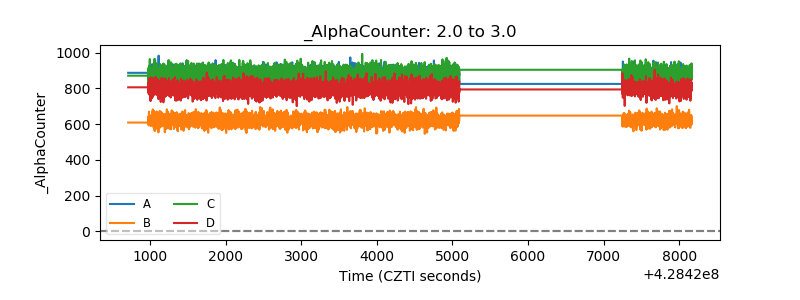 |
| _CPM_Rate | 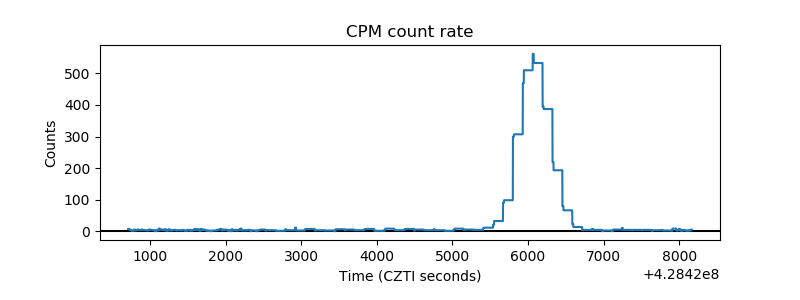 |
| CZT Counter | 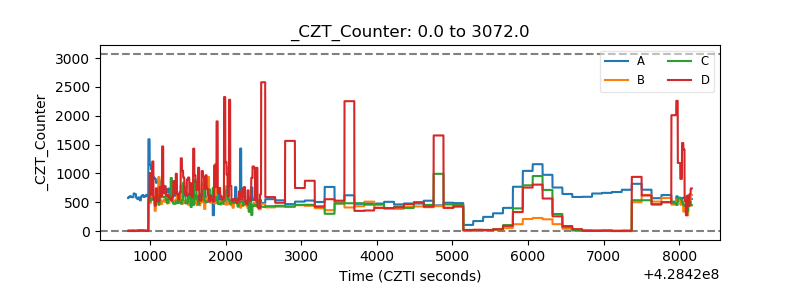 |
| +2.5 Volts monitor | 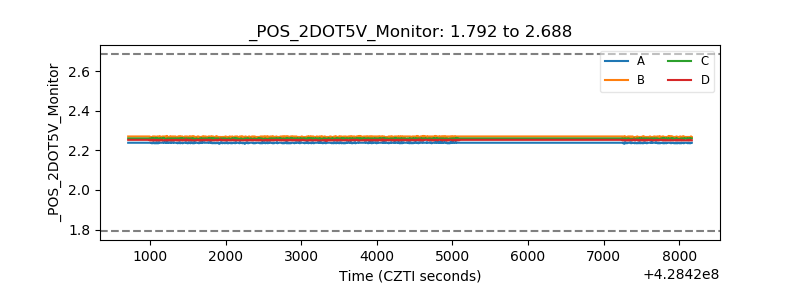 |
| +5 Volts monitor | 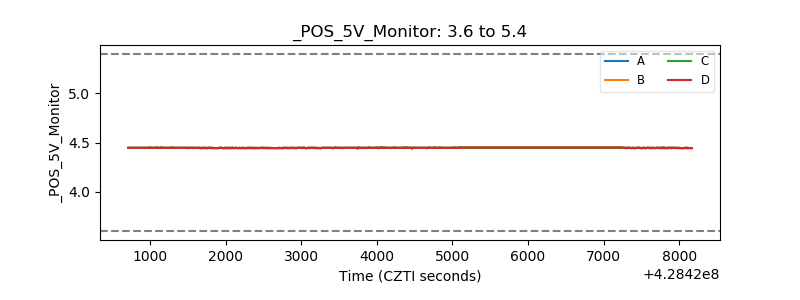 |
| _ROLL_ROT | 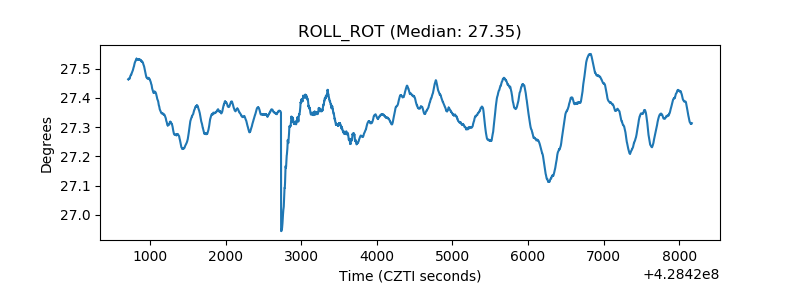 |
| _Roll_DEC | 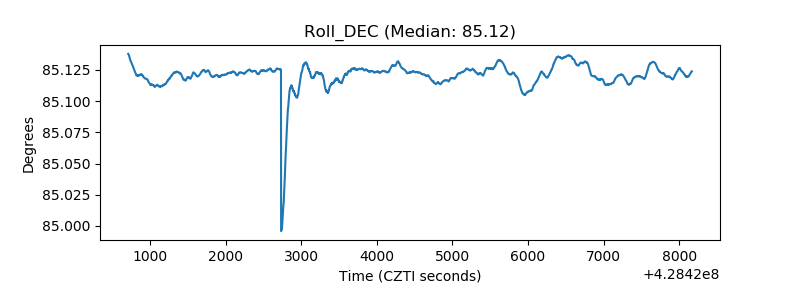 |
| _Roll_RA | 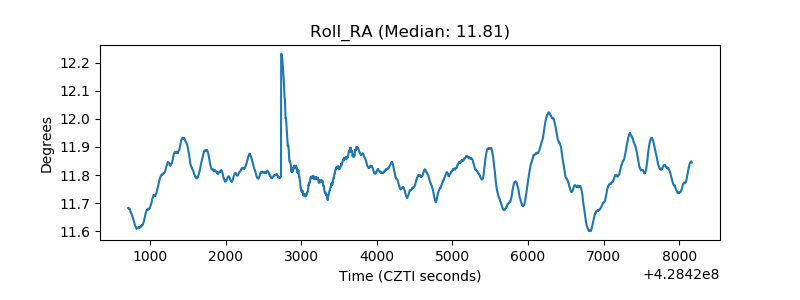 |
| Veto Counter | 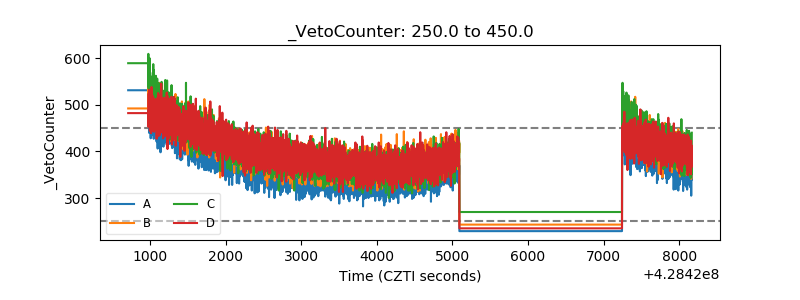 |