| Param | Original file | Final file |
|---|---|---|
| Filename | modeM0/AS1C06_010T01_9000005800_42375cztM0_level2.fits | modeM0/AS1C06_010T01_9000005800_42375cztM0_level2_quad_clean.evt |
| Size (bytes) | 339,937,920 | 83,404,800 |
| Size | 324.2 MB | 79.5 MB |
| Events in quadrant A | 2,722,575 | 575,782 |
| Events in quadrant B | 2,427,954 | 570,987 |
| Events in quadrant C | 2,480,964 | 557,645 |
| Events in quadrant D | 4,562,088 | 470,352 |
| Mode M9 | |||
|---|---|---|---|
| Quadrant | BADHDUFLAG | Total packets | Discarded packets |
| A | 0 | 24 | 0 |
| B | 0 | 25 | 0 |
| C | 0 | 25 | 0 |
| D | 0 | 25 | 0 |
| Mode M0 | |||
|---|---|---|---|
| Quadrant | BADHDUFLAG | Total packets | Discarded packets |
| A | 0 | 11181 | 2 |
| B | 0 | 10813 | 2 |
| C | 0 | 10508 | 2 |
| D | 0 | 17061 | 6 |
| Mode SS | |||
|---|---|---|---|
| Quadrant | BADHDUFLAG | Total packets | Discarded packets |
| A | 0 | 102 | 0 |
| B | 0 | 102 | 0 |
| C | 0 | 102 | 0 |
| D | 0 | 102 | 0 |
| Quadrant | Total seconds | Saturated seconds | Saturation percentage |
|---|---|---|---|
| A | 5002 | 11 | 0.219912% |
| B | 5002 | 52 | 1.039584% |
| C | 5002 | 14 | 0.279888% |
| D | 5001 | 617 | 12.337532% |
Noise dominated data is calculated using 1-second bins in cleaned event files. If a bin has >2000 counts, and if more than 50% of those come from <1% of pixels, then it is considered to be noise-dominated and hence unusable.
| Quadrant | # 1 sec bins | Bins with >0 counts | Bins with >2000 counts | High rate bins dominated by noise | Noise dominated (total time) | Noise dominated (detector-on time) | Marked lightcurve |
|---|---|---|---|---|---|---|---|
| A | 7034 | 5003 | 5 | 5 | 0.07% | 0.10% | 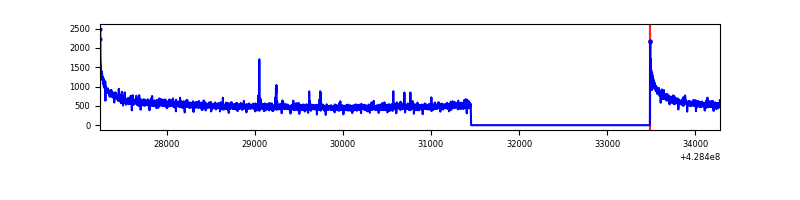 |
| B | 7034 | 5003 | 23 | 23 | 0.33% | 0.46% | 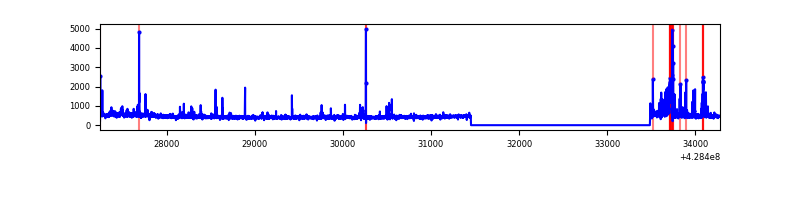 |
| C | 7034 | 5003 | 5 | 5 | 0.07% | 0.10% |  |
| D | 7032 | 5001 | 488 | 488 | 6.94% | 9.76% | 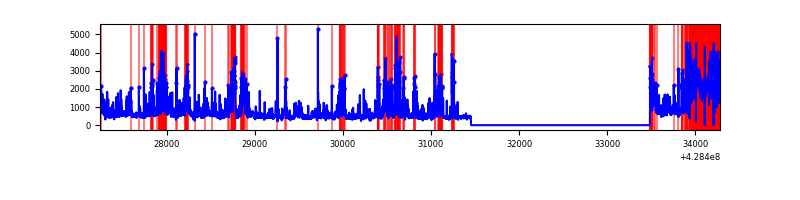 |
Top three noisy pixels from each quadrant. If the there are fewer than three noisy pixels in the level2.evt file, extra rows are filled as -1
| Pixel properties | Quadrant properties | ||||||
|---|---|---|---|---|---|---|---|
| Quadrant | DetID | PixID | Counts | Sigma | Mean | Median | Sigma |
| A | 10 | 83 | 601637 | 5447.05 | 537 | 526 | 110.4 |
| A | 13 | 6 | 19181 | 169.04 | 537 | 526 | 110.4 |
| A | 13 | 254 | 8071 | 68.37 | 537 | 526 | 110.4 |
| B | 5 | 172 | 70361 | 689.6 | 531 | 517 | 101.3 |
| B | 4 | 81 | 68181 | 668.08 | 531 | 517 | 101.3 |
| B | 3 | 112 | 58423 | 571.73 | 531 | 517 | 101.3 |
| C | 15 | 214 | 212033 | 1726.46 | 530 | 534 | 122.5 |
| C | 14 | 254 | 67524 | 546.84 | 530 | 534 | 122.5 |
| C | 15 | 159 | 32512 | 261.03 | 530 | 534 | 122.5 |
| D | 12 | 233 | 1046916 | 8627.62 | 496 | 482 | 121.3 |
| D | 1 | 52 | 439429 | 3619.02 | 496 | 482 | 121.3 |
| D | 1 | 47 | 264460 | 2176.44 | 496 | 482 | 121.3 |
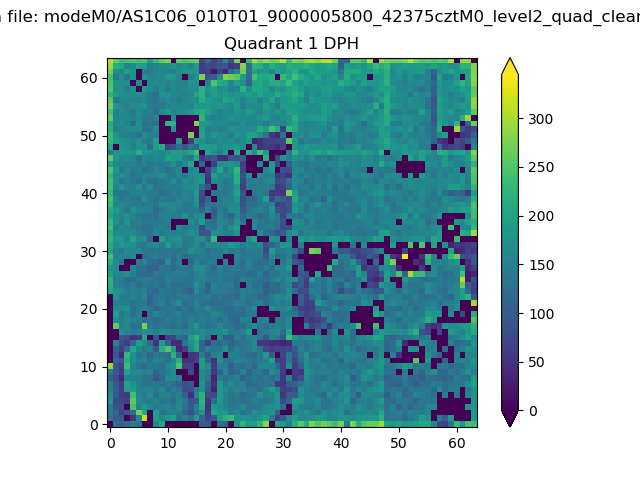
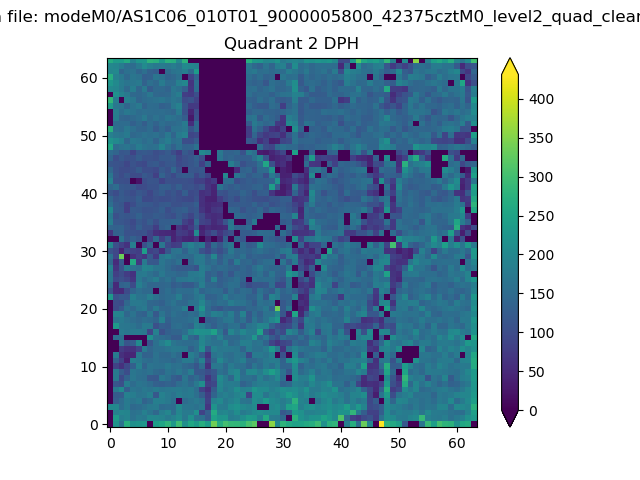
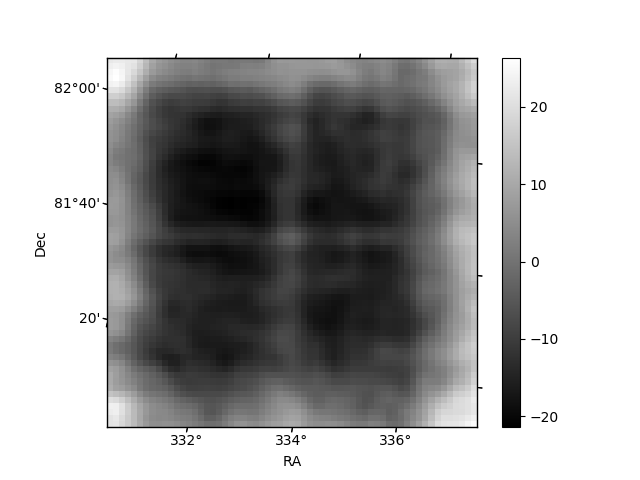
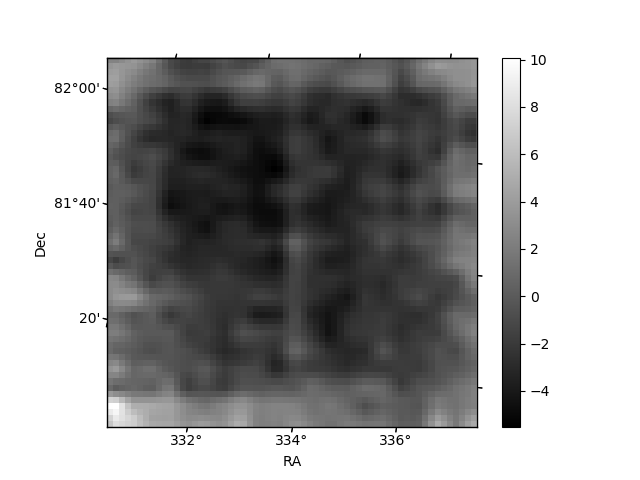
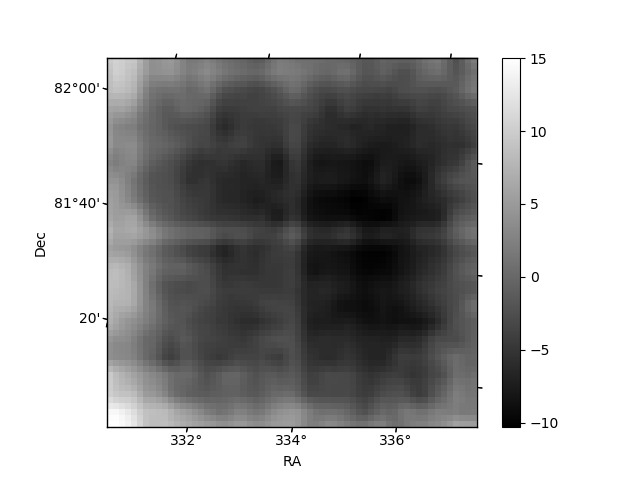
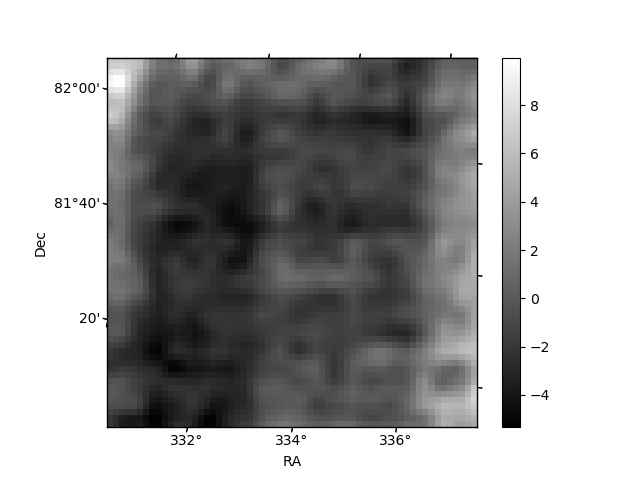
Histogram calculated using DETX and DETY for each event in the final _common_clean file
| Quadrant A | 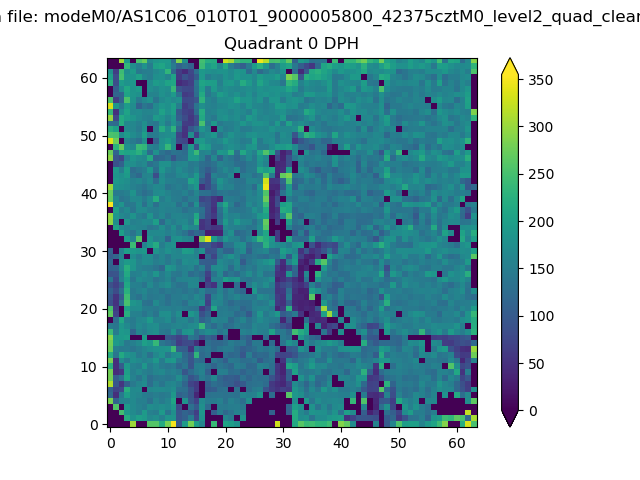 |
 |
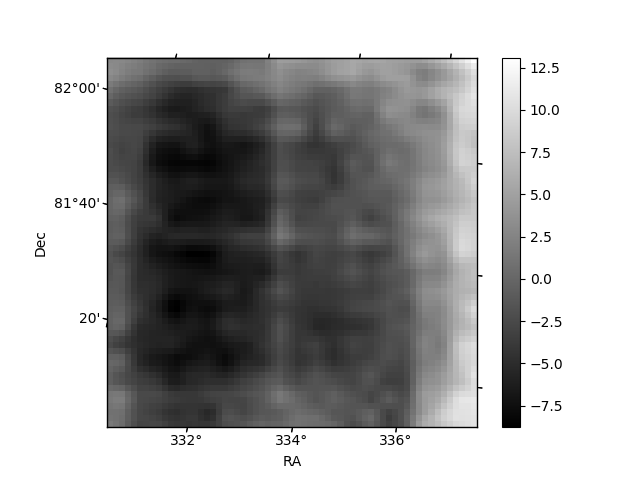
Quadrant B |
|---|---|---|---|
| Quadrant D | 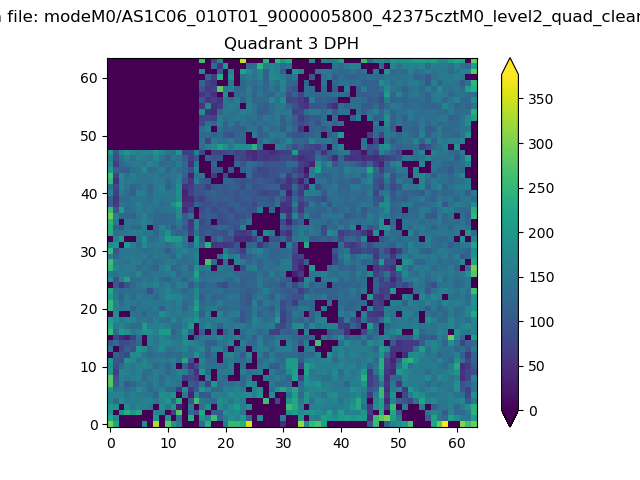 |
 |
Quadrant C |
| Plot type | Count rate plots | Images |
|---|---|---|
| Comparison with Poisson distribution Blue bars denote a histogram of data divided into 1 sec bins. Red curve is a Poisson curve with rate = median count rate of data. |
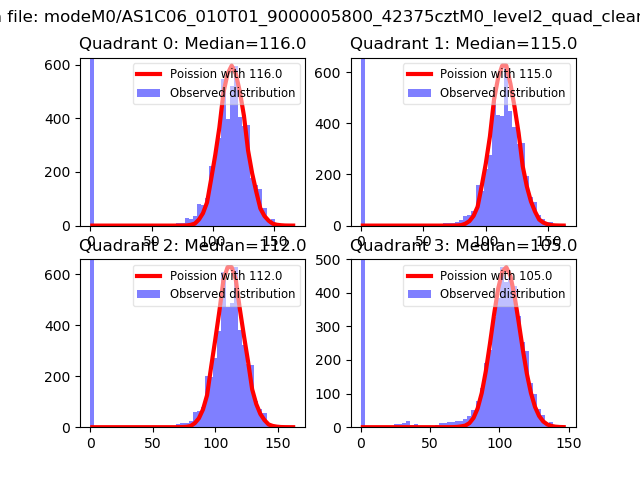 |
 |
| Quadrant-wise count rates Data is divided into 100 sec bins |
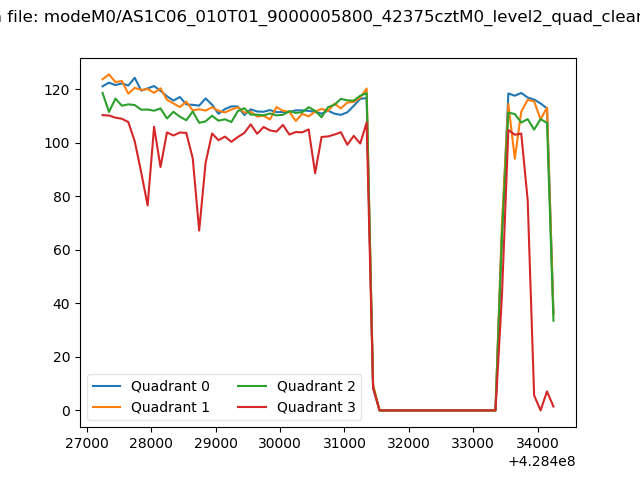 |
|
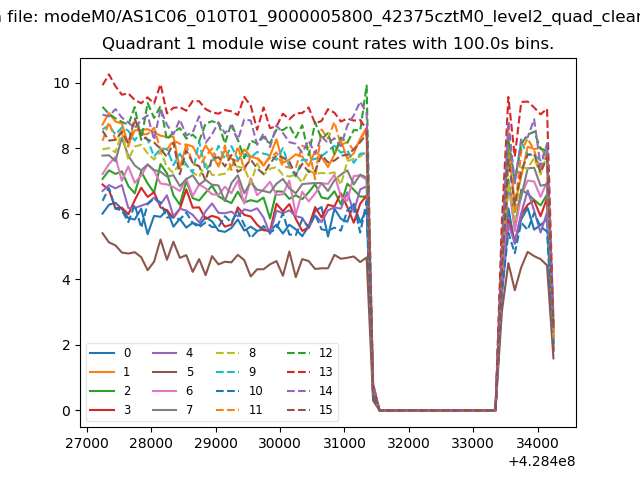
| Module-wise count rates for Quadrant A Data is divided into 100 sec bins |
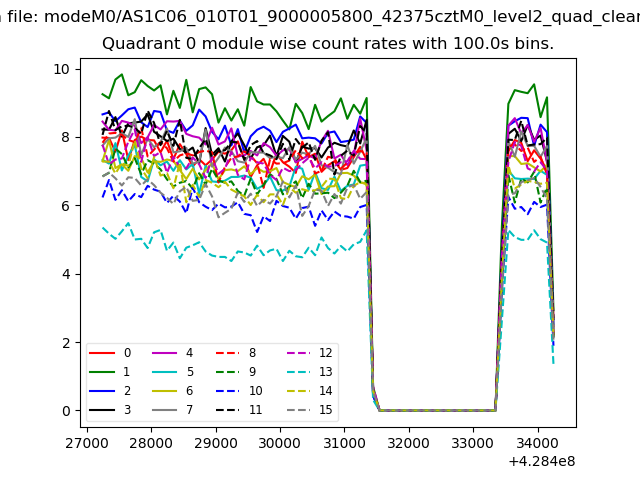 |
 |
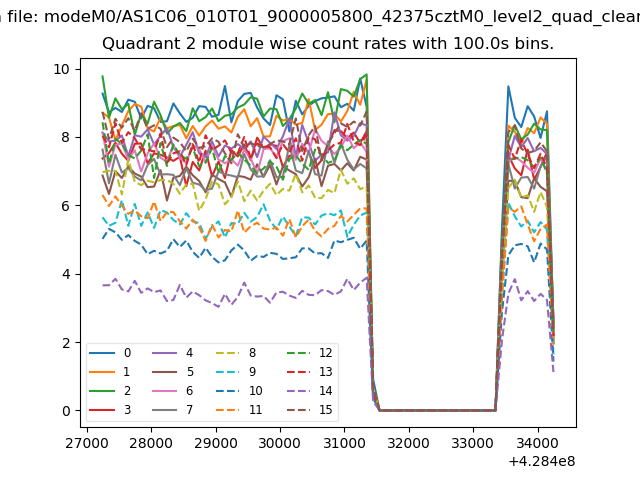
| Module-wise count rates for Quadrant B Data is divided into 100 sec bins |
 |
 |
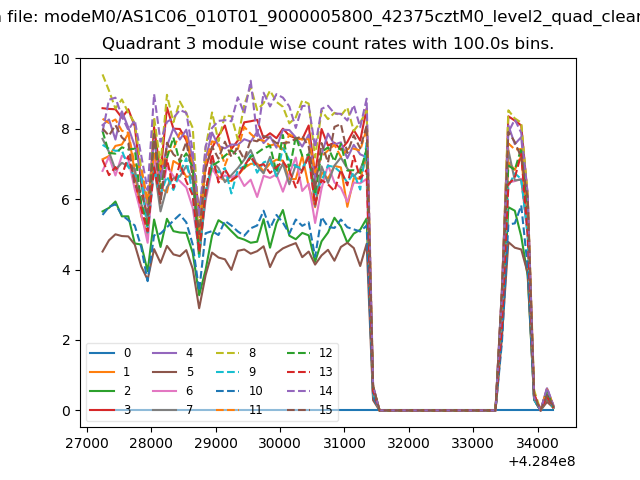
| Module-wise count rates for Quadrant C Data is divided into 100 sec bins |
 |
 |
| Module-wise count rates for Quadrant D Data is divided into 100 sec bins |
 |
 |
| Parameter | Plot |
|---|---|
| CZT HV Monitor | 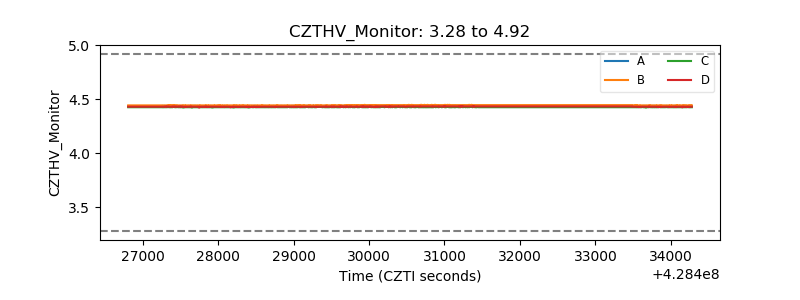 |
| D_VDD | 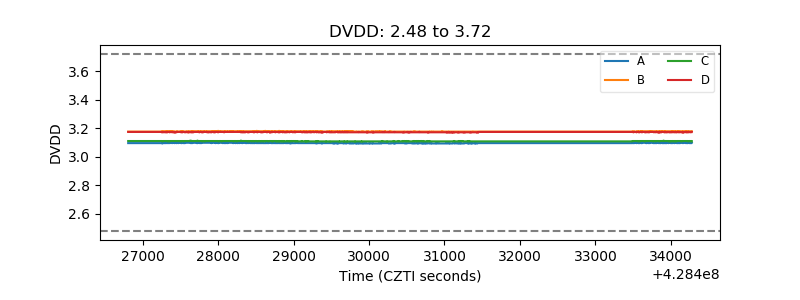 |
| Temperature 1 | 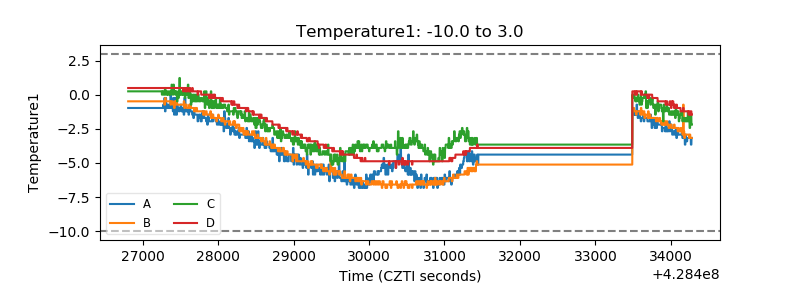 |
| Veto HV Monitor | 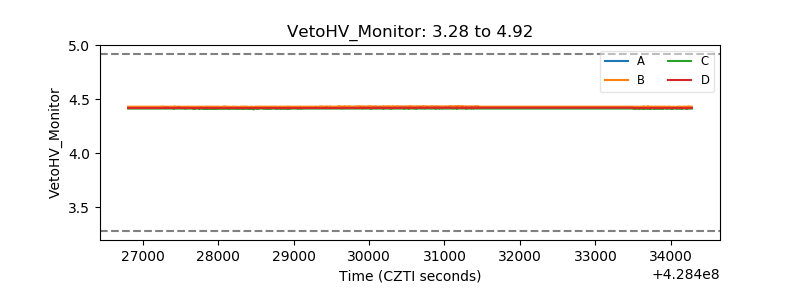 |
| Veto LLD | 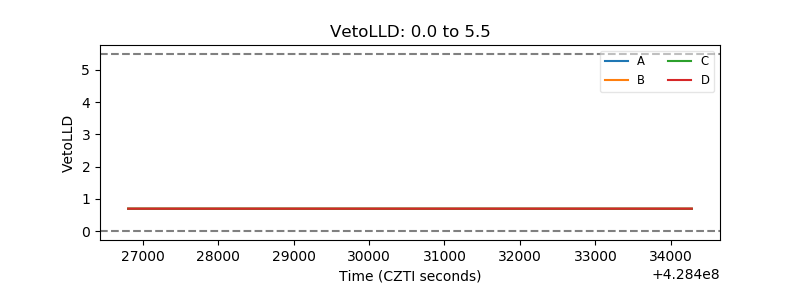 |
| Alpha Counter | 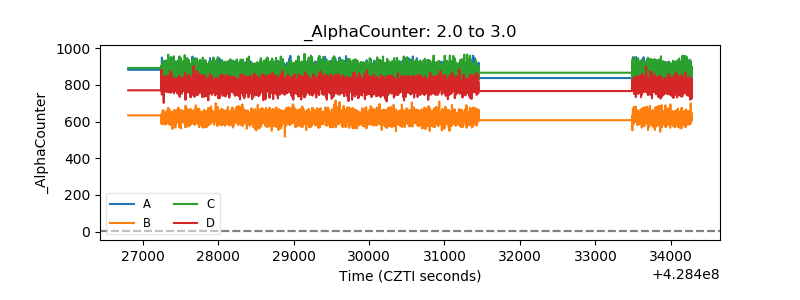 |
| _CPM_Rate | 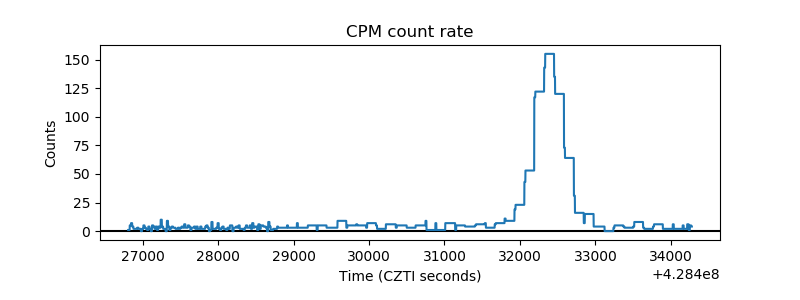 |
| CZT Counter | 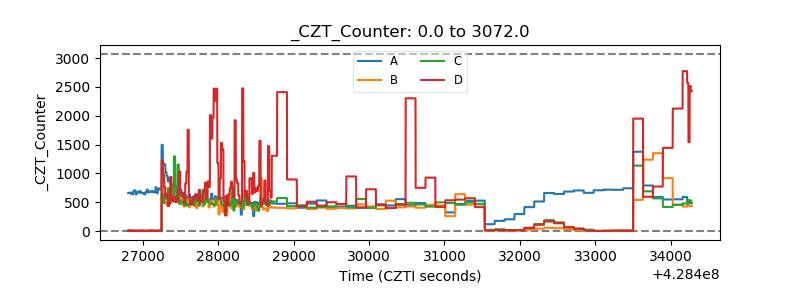 |
| +2.5 Volts monitor | 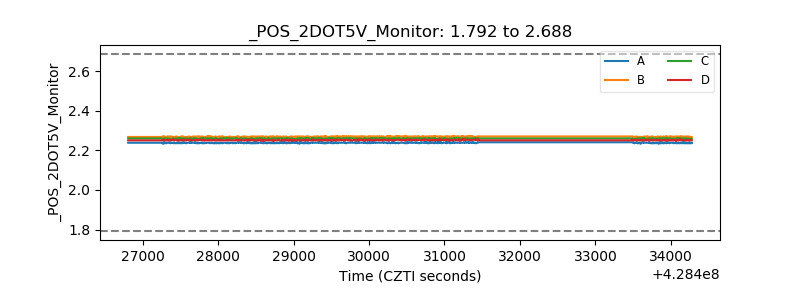 |
| +5 Volts monitor |  |
| _ROLL_ROT | 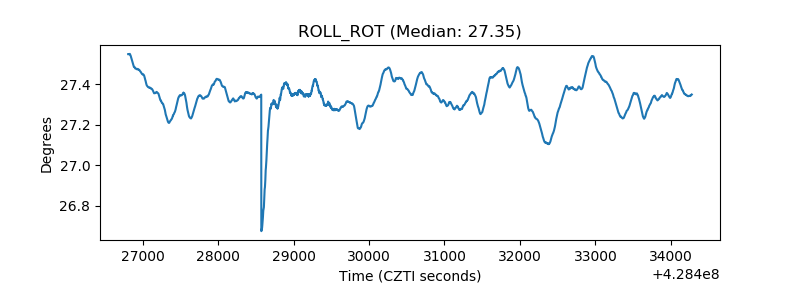 |
| _Roll_DEC |  |
| _Roll_RA | 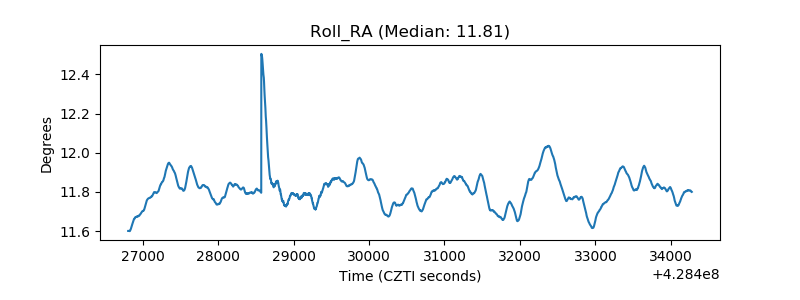 |
| Veto Counter | 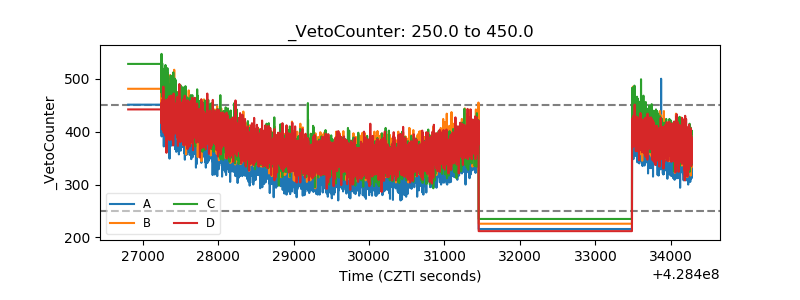 |