| Param | Original file | Final file |
|---|---|---|
| Filename | modeM0/AS1C06_010T01_9000005800_42377cztM0_level2.fits | modeM0/AS1C06_010T01_9000005800_42377cztM0_level2_quad_clean.evt |
| Size (bytes) | 329,054,400 | 90,365,760 |
| Size | 313.8 MB | 86.2 MB |
| Events in quadrant A | 2,923,059 | 603,236 |
| Events in quadrant B | 2,570,153 | 608,381 |
| Events in quadrant C | 3,039,203 | 588,696 |
| Events in quadrant D | 3,214,981 | 547,082 |
| Mode M9 | |||
|---|---|---|---|
| Quadrant | BADHDUFLAG | Total packets | Discarded packets |
| A | 0 | 24 | 0 |
| B | 0 | 25 | 0 |
| C | 0 | 25 | 0 |
| D | 0 | 25 | 0 |
| Mode M0 | |||
|---|---|---|---|
| Quadrant | BADHDUFLAG | Total packets | Discarded packets |
| A | 0 | 12178 | 2 |
| B | 0 | 11721 | 2 |
| C | 0 | 12742 | 2 |
| D | 0 | 13644 | 2 |
| Mode SS | |||
|---|---|---|---|
| Quadrant | BADHDUFLAG | Total packets | Discarded packets |
| A | 0 | 112 | 0 |
| B | 0 | 112 | 0 |
| C | 0 | 112 | 0 |
| D | 0 | 112 | 0 |
| Quadrant | Total seconds | Saturated seconds | Saturation percentage |
|---|---|---|---|
| A | 5558 | 10 | 0.179921% |
| B | 5558 | 25 | 0.449802% |
| C | 5558 | 108 | 1.943145% |
| D | 5558 | 131 | 2.356963% |
Noise dominated data is calculated using 1-second bins in cleaned event files. If a bin has >2000 counts, and if more than 50% of those come from <1% of pixels, then it is considered to be noise-dominated and hence unusable.
| Quadrant | # 1 sec bins | Bins with >0 counts | Bins with >2000 counts | High rate bins dominated by noise | Noise dominated (total time) | Noise dominated (detector-on time) | Marked lightcurve |
|---|---|---|---|---|---|---|---|
| A | 7022 | 5559 | 6 | 6 | 0.09% | 0.11% | 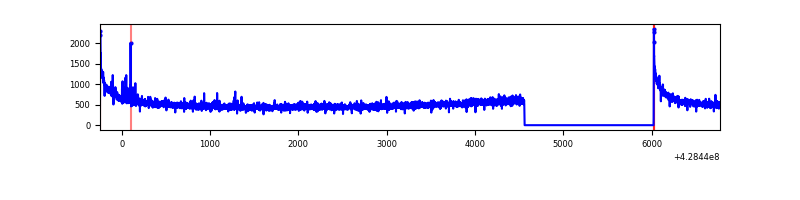 |
| B | 7022 | 5559 | 12 | 12 | 0.17% | 0.22% | 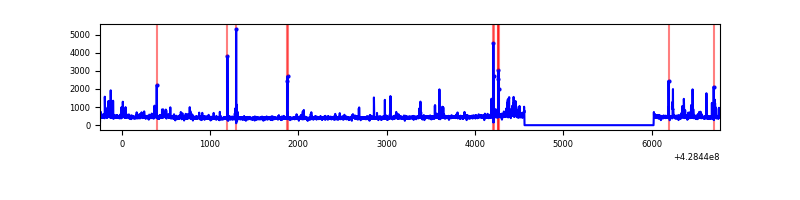 |
| C | 7022 | 5559 | 73 | 73 | 1.04% | 1.31% | 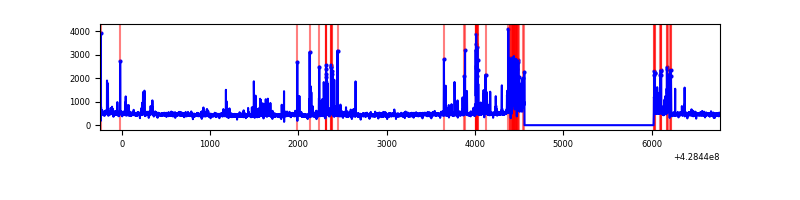 |
| D | 7022 | 5559 | 104 | 104 | 1.48% | 1.87% | 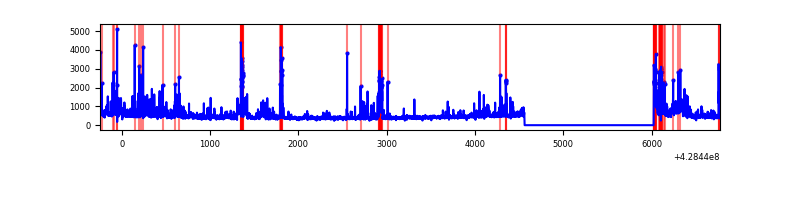 |
Top three noisy pixels from each quadrant. If the there are fewer than three noisy pixels in the level2.evt file, extra rows are filled as -1
| Pixel properties | Quadrant properties | ||||||
|---|---|---|---|---|---|---|---|
| Quadrant | DetID | PixID | Counts | Sigma | Mean | Median | Sigma |
| A | 10 | 83 | 614290 | 5065.08 | 585 | 572 | 121.2 |
| A | 7 | 3 | 20656 | 165.76 | 585 | 572 | 121.2 |
| A | 13 | 6 | 14722 | 116.78 | 585 | 572 | 121.2 |
| B | 5 | 172 | 81799 | 732.05 | 581 | 564 | 111.0 |
| B | 5 | 255 | 50540 | 450.36 | 581 | 564 | 111.0 |
| B | 4 | 81 | 32764 | 290.17 | 581 | 564 | 111.0 |
| C | 14 | 254 | 460780 | 3463.04 | 570 | 573 | 132.9 |
| C | 15 | 214 | 228769 | 1717.17 | 570 | 573 | 132.9 |
| C | 12 | 249 | 51203 | 380.99 | 570 | 573 | 132.9 |
| D | 1 | 52 | 244321 | 1757.56 | 570 | 553 | 138.7 |
| D | 5 | 32 | 138646 | 995.65 | 570 | 553 | 138.7 |
| D | 1 | 47 | 105704 | 758.14 | 570 | 553 | 138.7 |
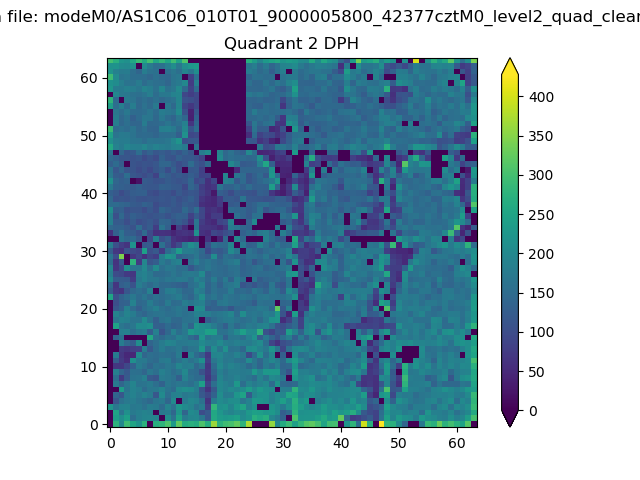
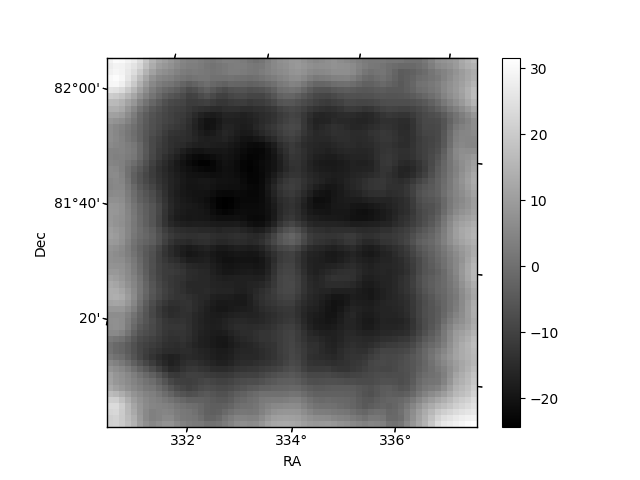
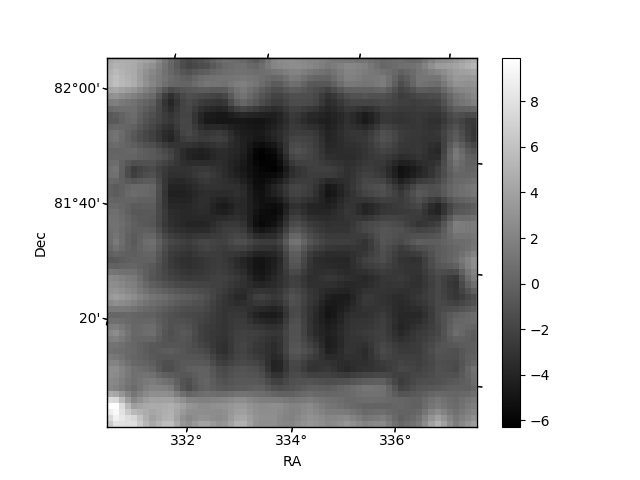
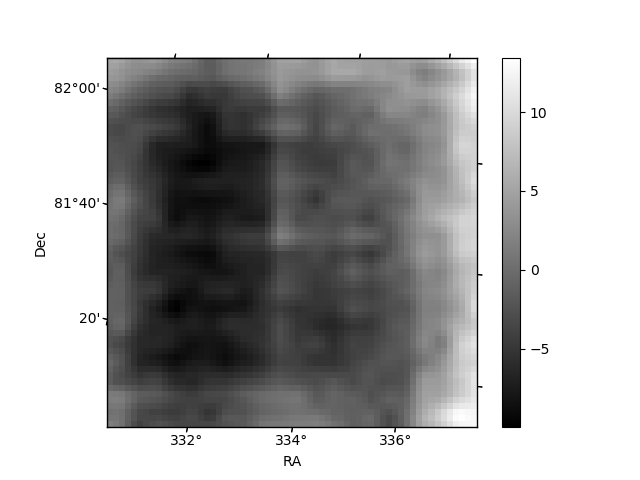
Histogram calculated using DETX and DETY for each event in the final _common_clean file
| Quadrant A | 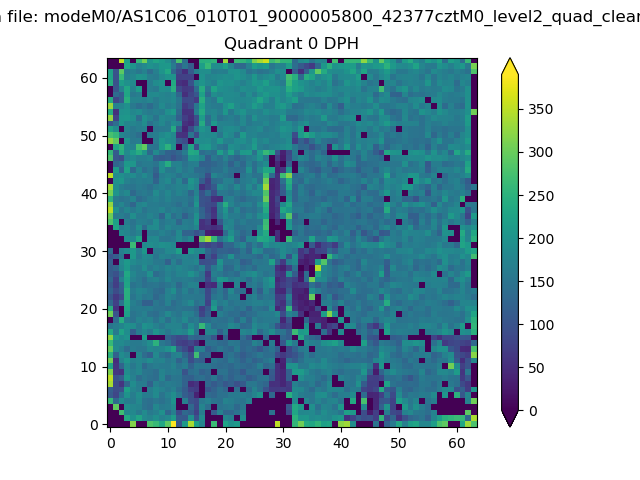 |
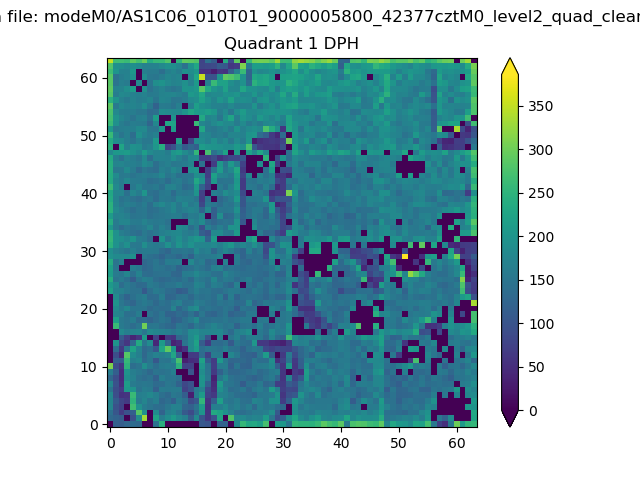 |
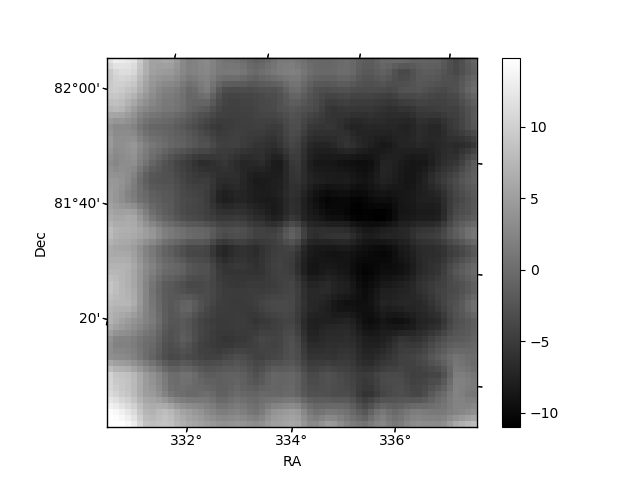
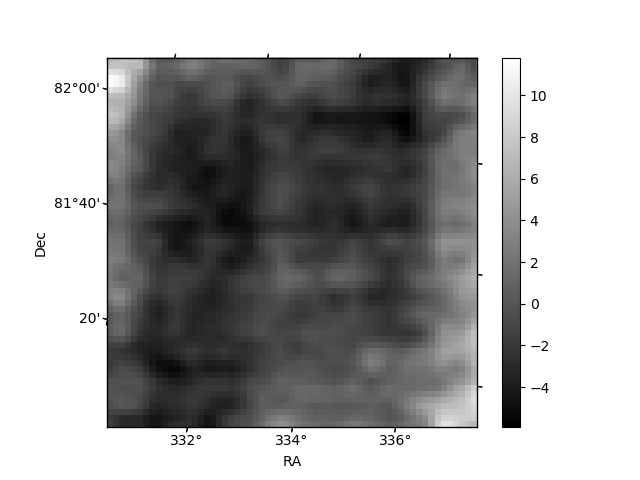
Quadrant B |
|---|---|---|---|
| Quadrant D | 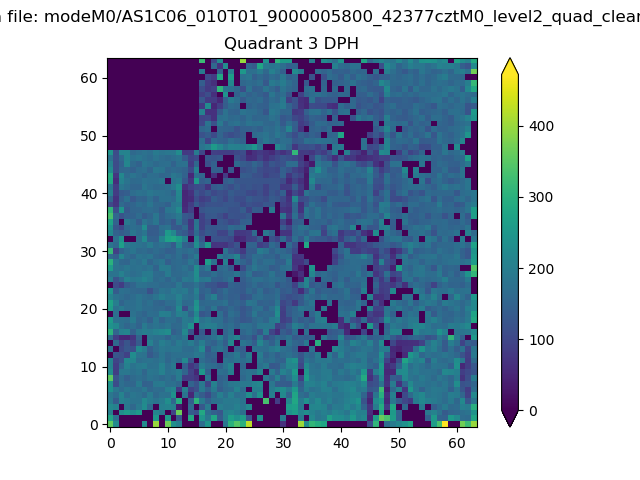 |
 |
Quadrant C |
| Plot type | Count rate plots | Images |
|---|---|---|
| Comparison with Poisson distribution Blue bars denote a histogram of data divided into 1 sec bins. Red curve is a Poisson curve with rate = median count rate of data. |
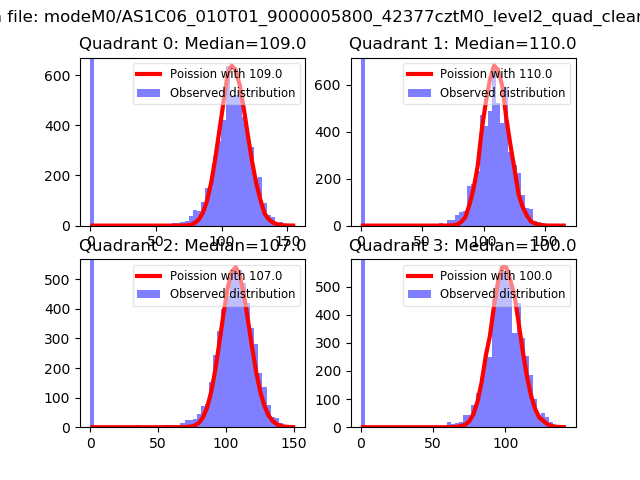 |
 |
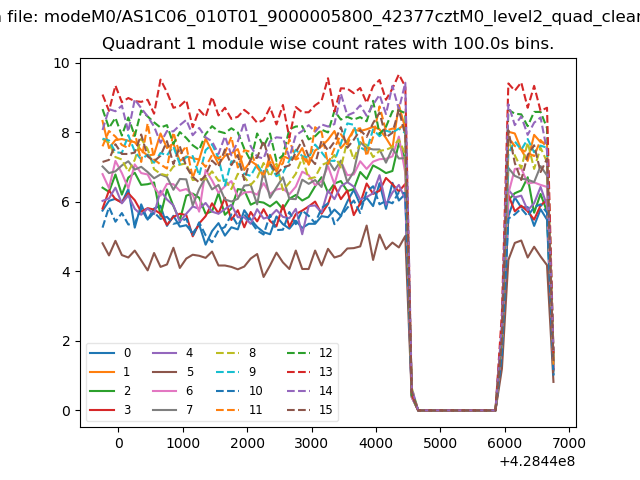
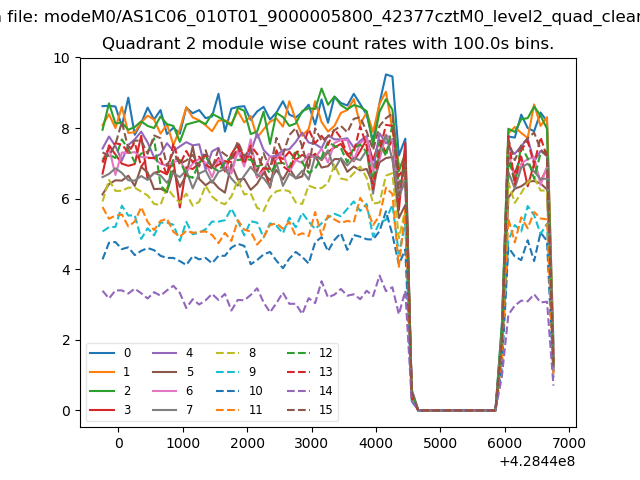
| Quadrant-wise count rates Data is divided into 100 sec bins |
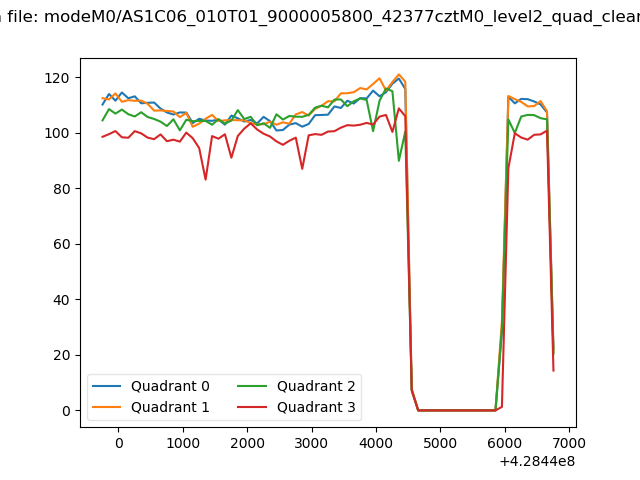 |
|
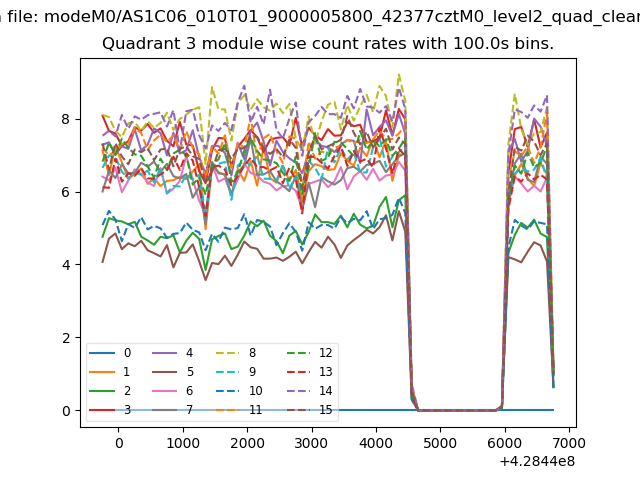
| Module-wise count rates for Quadrant A Data is divided into 100 sec bins |
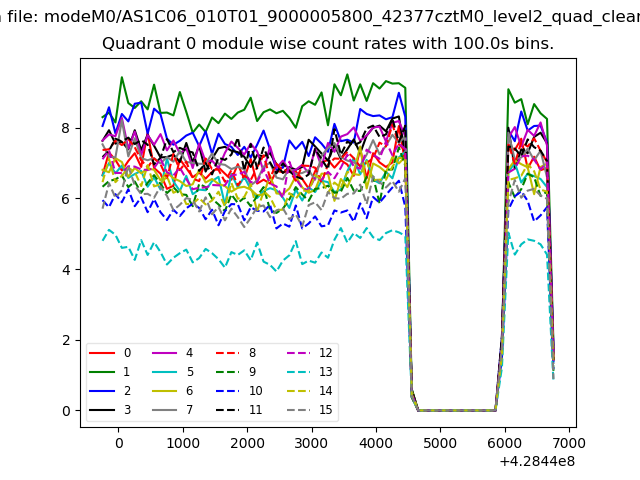 |
 |
| Module-wise count rates for Quadrant B Data is divided into 100 sec bins |
 |
 |
| Module-wise count rates for Quadrant C Data is divided into 100 sec bins |
 |
 |
| Module-wise count rates for Quadrant D Data is divided into 100 sec bins |
 |
 |
| Parameter | Plot |
|---|---|
| CZT HV Monitor | 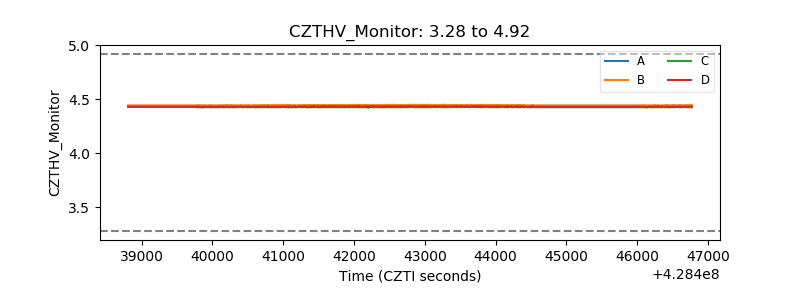 |
| D_VDD | 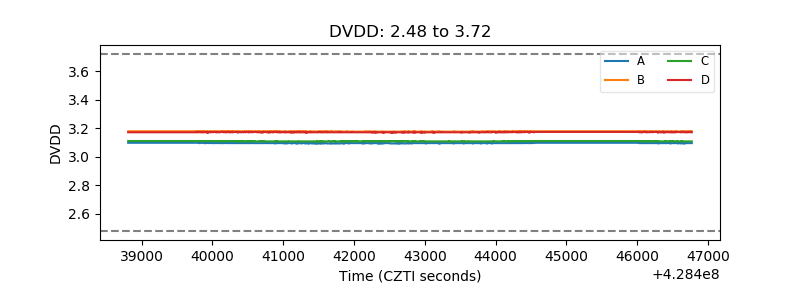 |
| Temperature 1 | 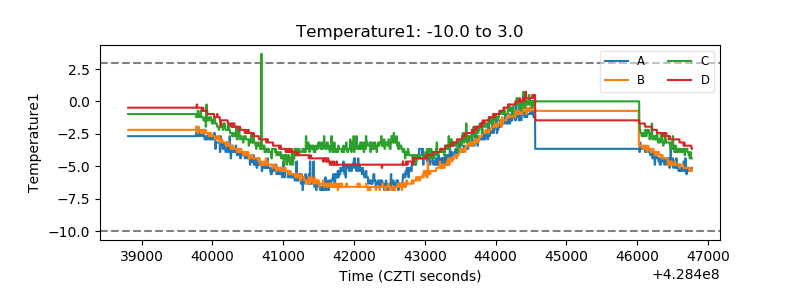 |
| Veto HV Monitor | 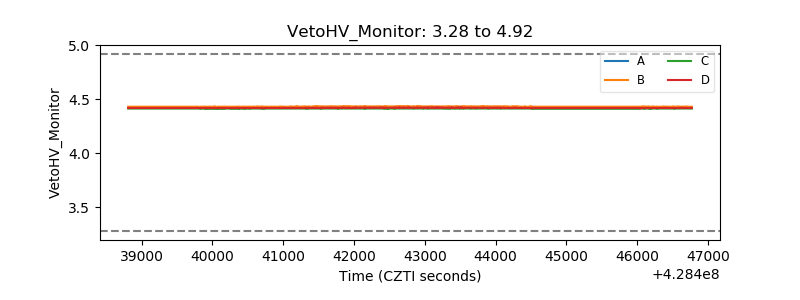 |
| Veto LLD | 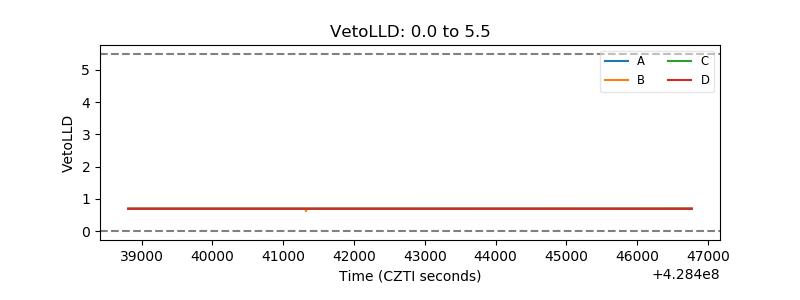 |
| Alpha Counter | 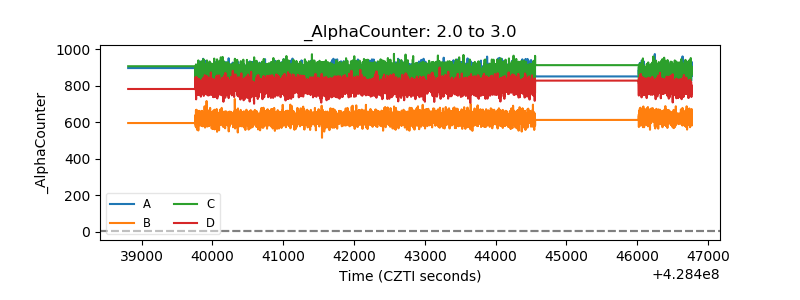 |
| _CPM_Rate | 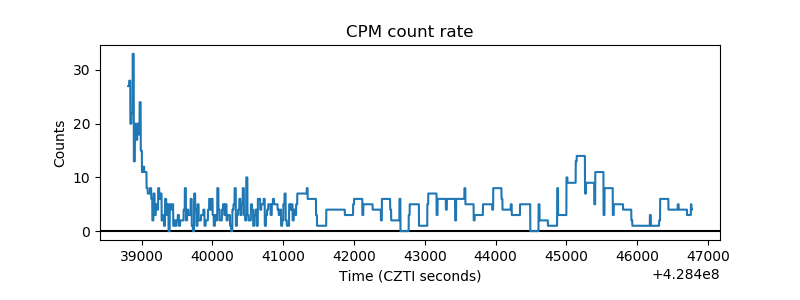 |
| CZT Counter | 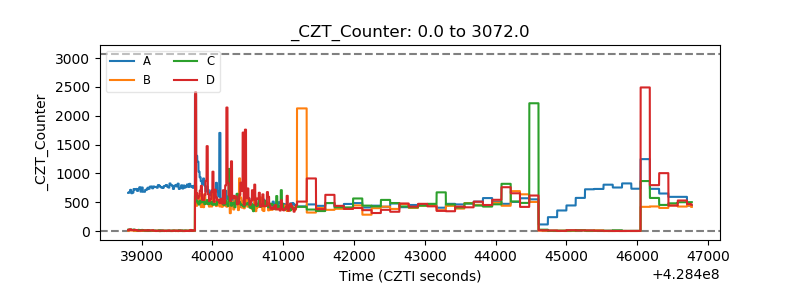 |
| +2.5 Volts monitor | 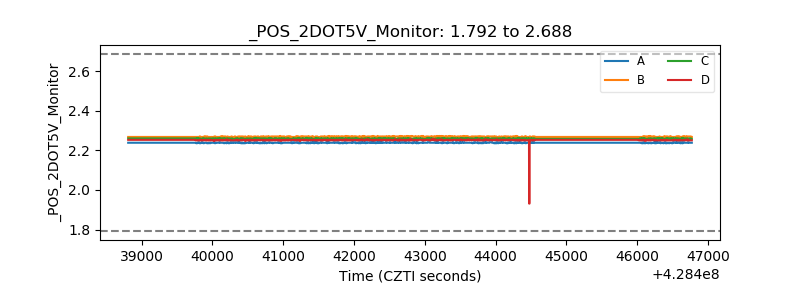 |
| +5 Volts monitor |  |
| _ROLL_ROT | 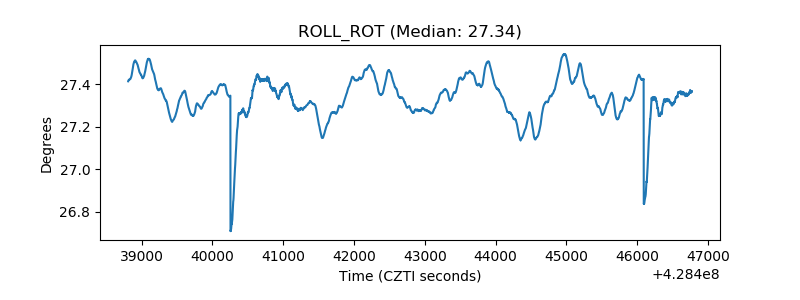 |
| _Roll_DEC | 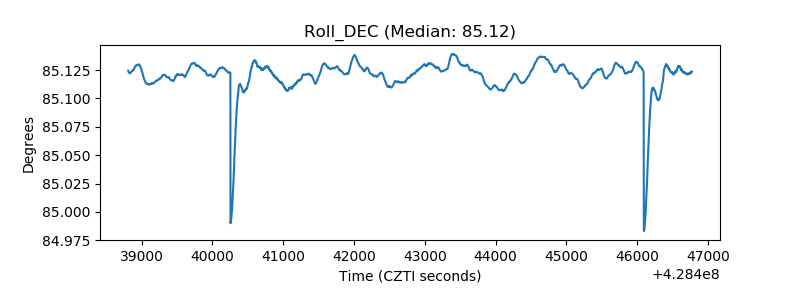 |
| _Roll_RA | 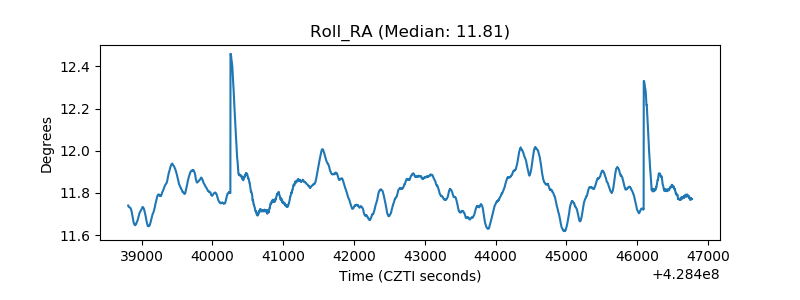 |
| Veto Counter | 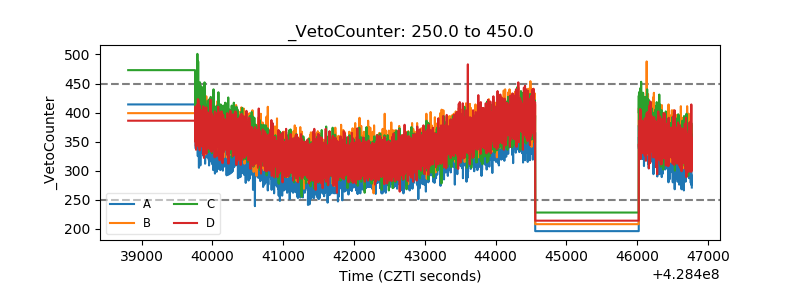 |