| Param | Original file | Final file |
|---|---|---|
| Filename | modeM0/AS1C06_010T01_9000005800_42382cztM0_level2.fits | modeM0/AS1C06_010T01_9000005800_42382cztM0_level2_quad_clean.evt |
| Size (bytes) | 1,499,080,320 | 396,766,080 |
| Size | 1.4 GB | 378.4 MB |
| Events in quadrant A | 12,744,746 | 2,665,106 |
| Events in quadrant B | 12,075,656 | 2,666,599 |
| Events in quadrant C | 12,982,112 | 2,624,843 |
| Events in quadrant D | 15,774,648 | 2,355,704 |
| Mode M9 | |||
|---|---|---|---|
| Quadrant | BADHDUFLAG | Total packets | Discarded packets |
| A | 0 | 91 | 0 |
| B | 0 | 92 | 0 |
| C | 0 | 92 | 0 |
| D | 0 | 92 | 0 |
| Mode M0 | |||
|---|---|---|---|
| Quadrant | BADHDUFLAG | Total packets | Discarded packets |
| A | 0 | 53397 | 7 |
| B | 0 | 54344 | 6 |
| C | 0 | 55255 | 6 |
| D | 0 | 65373 | 6 |
| Mode SS | |||
|---|---|---|---|
| Quadrant | BADHDUFLAG | Total packets | Discarded packets |
| A | 0 | 504 | 0 |
| B | 0 | 504 | 0 |
| C | 0 | 504 | 0 |
| D | 0 | 504 | 0 |
| Quadrant | Total seconds | Saturated seconds | Saturation percentage |
|---|---|---|---|
| A | 24721 | 55 | 0.222483% |
| B | 24721 | 392 | 1.585696% |
| C | 24721 | 359 | 1.452207% |
| D | 24722 | 1366 | 5.525443% |
Noise dominated data is calculated using 1-second bins in cleaned event files. If a bin has >2000 counts, and if more than 50% of those come from <1% of pixels, then it is considered to be noise-dominated and hence unusable.
| Quadrant | # 1 sec bins | Bins with >0 counts | Bins with >2000 counts | High rate bins dominated by noise | Noise dominated (total time) | Noise dominated (detector-on time) | Marked lightcurve |
|---|---|---|---|---|---|---|---|
| A | 47304 | 24727 | 30 | 30 | 0.06% | 0.12% | 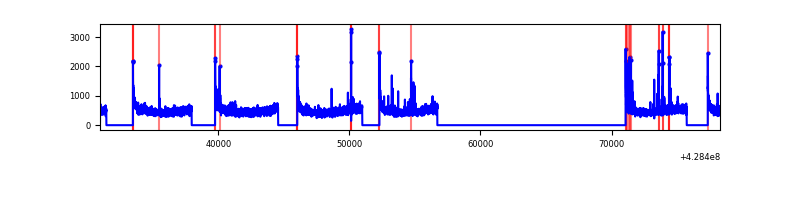 |
| B | 47304 | 24727 | 285 | 285 | 0.60% | 1.15% | 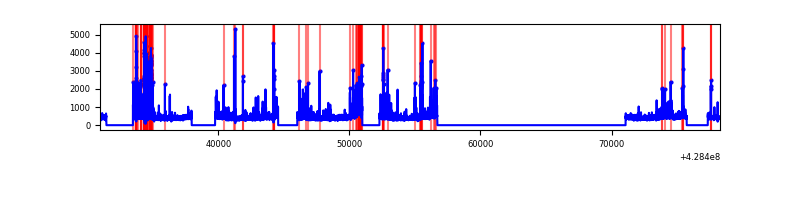 |
| C | 47304 | 24727 | 254 | 254 | 0.54% | 1.03% | 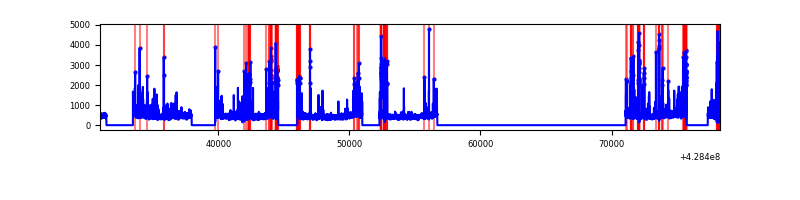 |
| D | 47305 | 24727 | 1129 | 1129 | 2.39% | 4.57% | 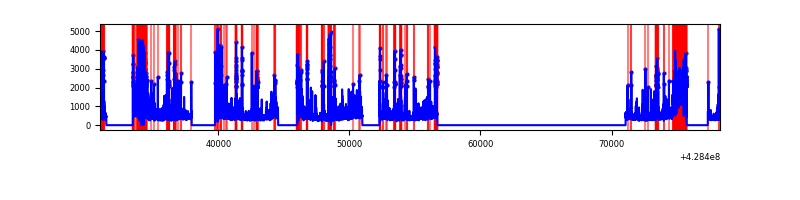 |
Top three noisy pixels from each quadrant. If the there are fewer than three noisy pixels in the level2.evt file, extra rows are filled as -1
| Pixel properties | Quadrant properties | ||||||
|---|---|---|---|---|---|---|---|
| Quadrant | DetID | PixID | Counts | Sigma | Mean | Median | Sigma |
| A | 10 | 83 | 2373797 | 4461.16 | 2609 | 2555 | 531.5 |
| A | 13 | 248 | 127245 | 234.59 | 2609 | 2555 | 531.5 |
| A | 13 | 6 | 56949 | 102.33 | 2609 | 2555 | 531.5 |
| B | 4 | 81 | 813849 | 1669.33 | 2570 | 2496 | 486.0 |
| B | 5 | 172 | 247842 | 504.79 | 2570 | 2496 | 486.0 |
| B | 5 | 255 | 229160 | 466.35 | 2570 | 2496 | 486.0 |
| C | 14 | 254 | 1583307 | 2716.77 | 2530 | 2541 | 581.9 |
| C | 15 | 214 | 1013124 | 1736.83 | 2530 | 2541 | 581.9 |
| C | 8 | 79 | 130828 | 220.48 | 2530 | 2541 | 581.9 |
| D | 12 | 233 | 1590637 | 2629.79 | 2494 | 2419 | 603.9 |
| D | 13 | 171 | 1326989 | 2193.24 | 2494 | 2419 | 603.9 |
| D | 1 | 52 | 734507 | 1212.2 | 2494 | 2419 | 603.9 |
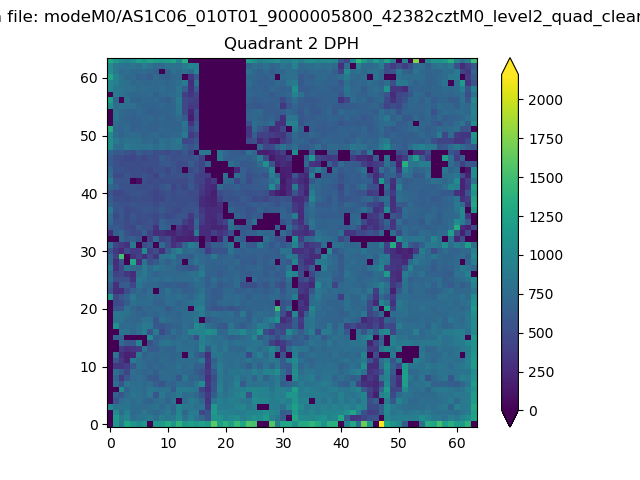
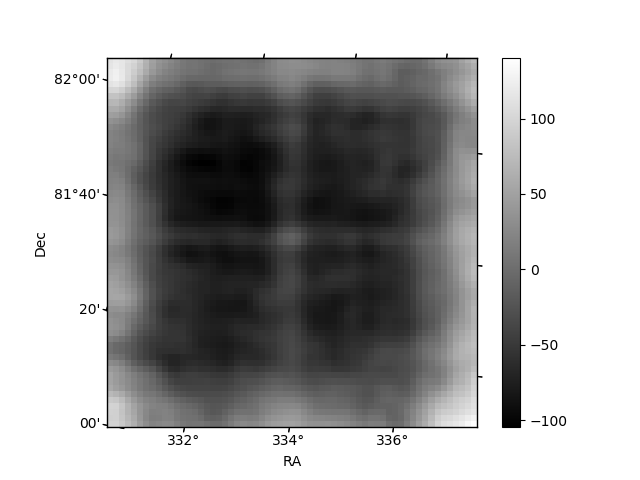
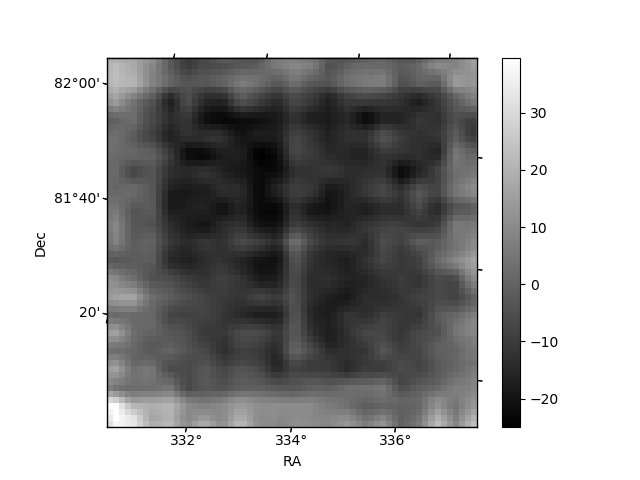
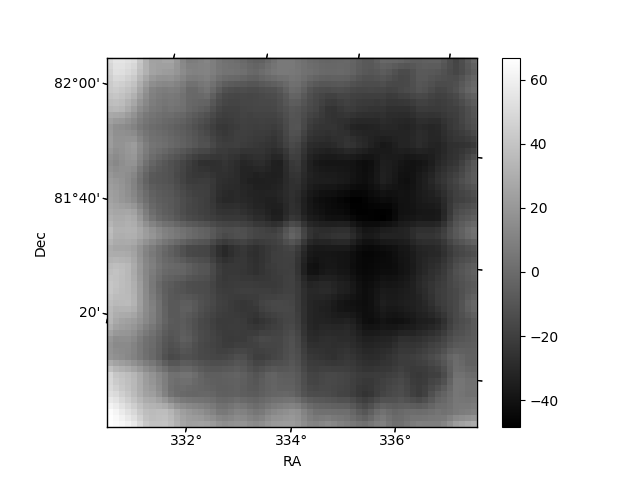
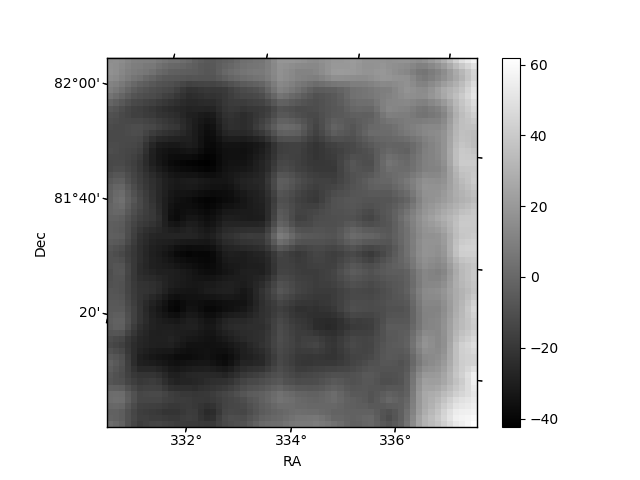
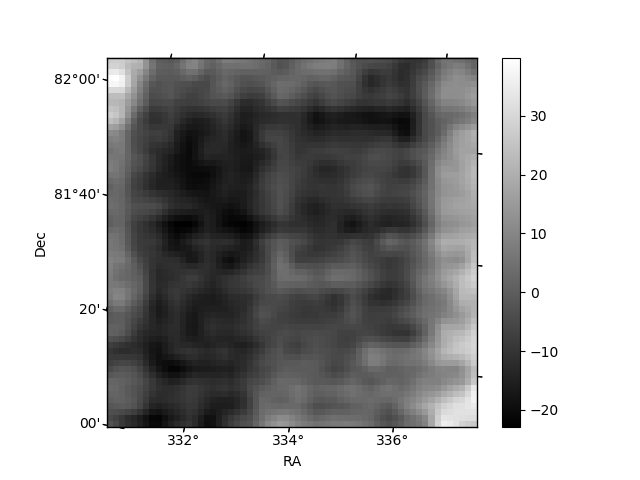
Histogram calculated using DETX and DETY for each event in the final _common_clean file
| Quadrant A | 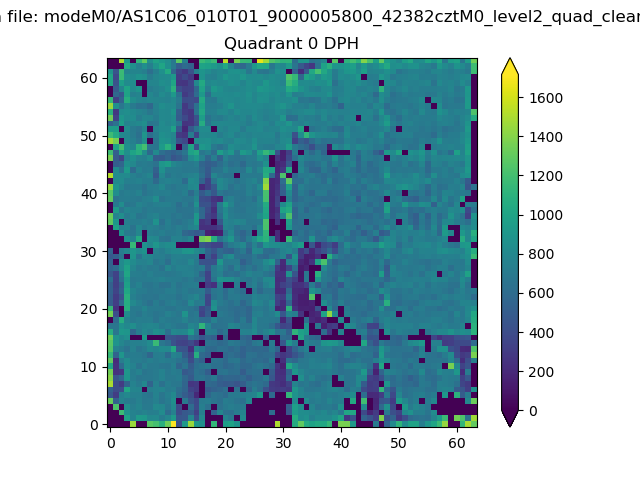 |
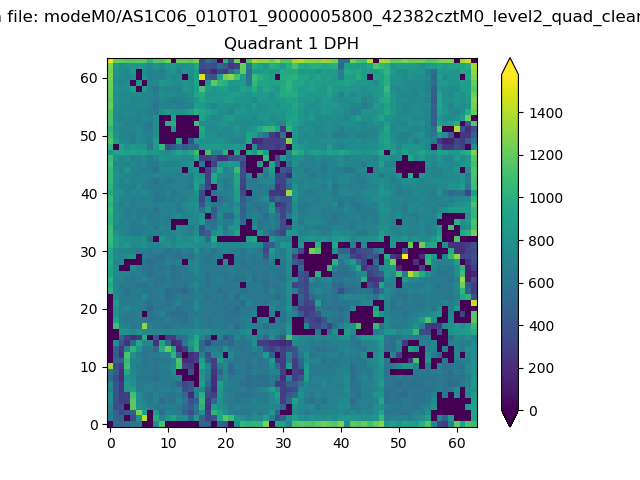 |
Quadrant B |
|---|---|---|---|
| Quadrant D | 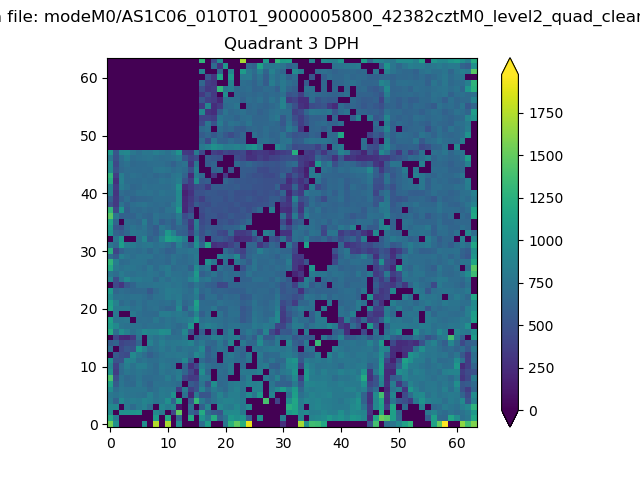 |
 |
Quadrant C |
| Plot type | Count rate plots | Images |
|---|---|---|
| Comparison with Poisson distribution Blue bars denote a histogram of data divided into 1 sec bins. Red curve is a Poisson curve with rate = median count rate of data. |
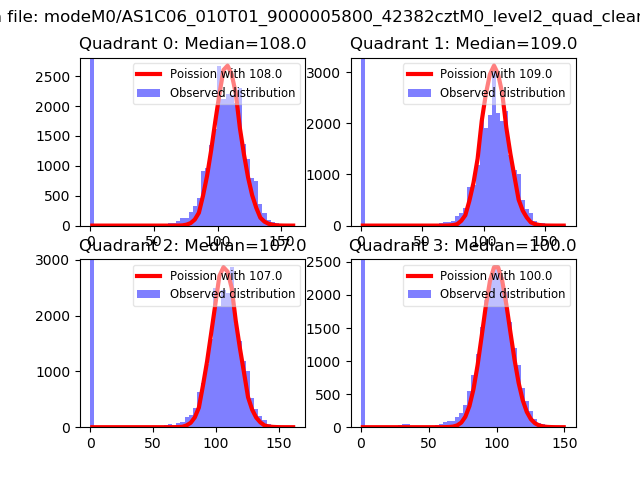 |
 |
| Quadrant-wise count rates Data is divided into 100 sec bins |
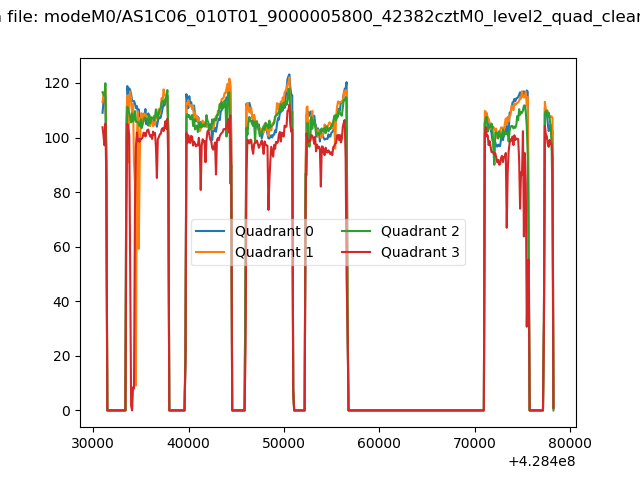 |
|
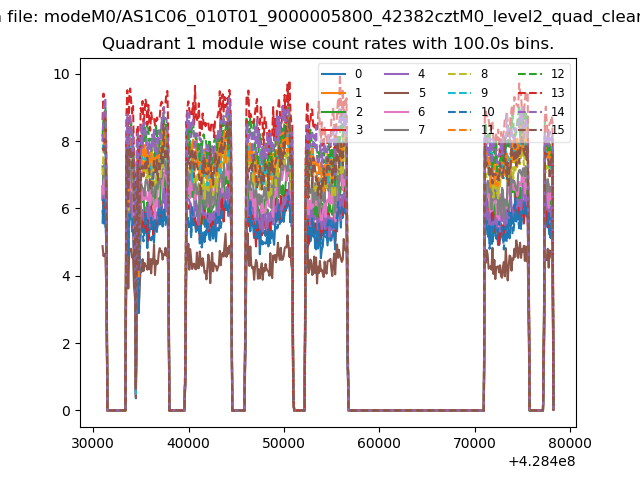
| Module-wise count rates for Quadrant A Data is divided into 100 sec bins |
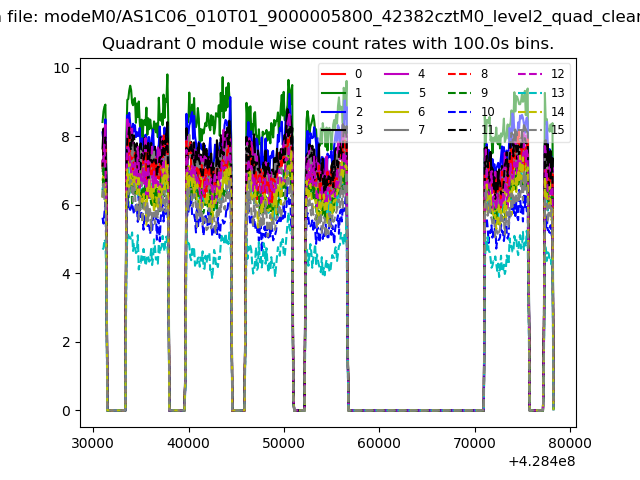 |
 |
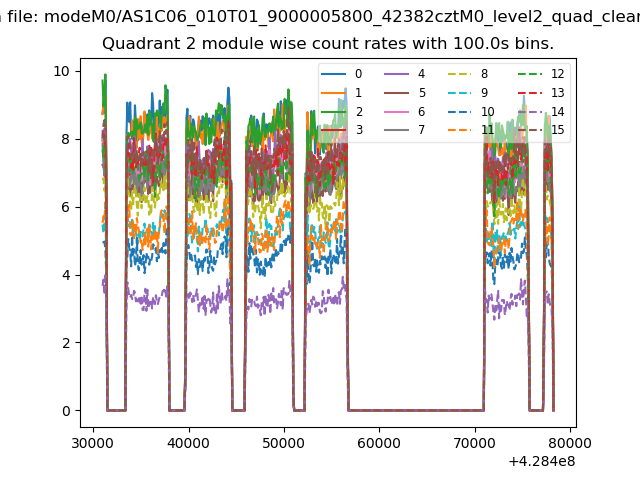
| Module-wise count rates for Quadrant B Data is divided into 100 sec bins |
 |
 |
| Module-wise count rates for Quadrant C Data is divided into 100 sec bins |
 |
 |
| Module-wise count rates for Quadrant D Data is divided into 100 sec bins |
 |
 |
| Parameter | Plot |
|---|---|
| CZT HV Monitor | 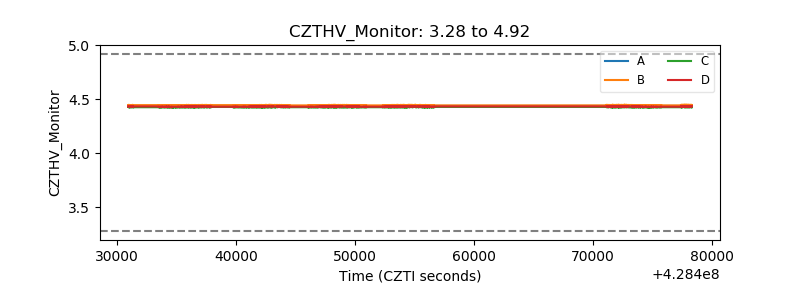 |
| D_VDD | 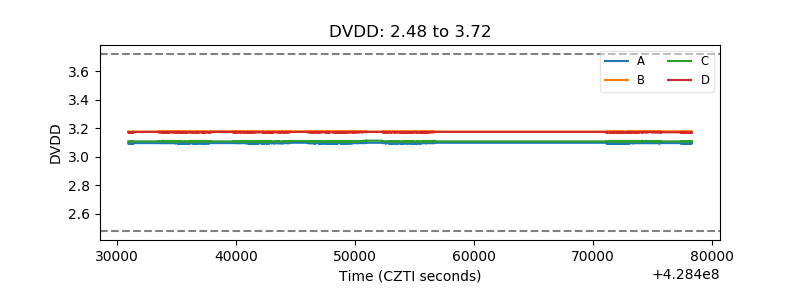 |
| Temperature 1 | 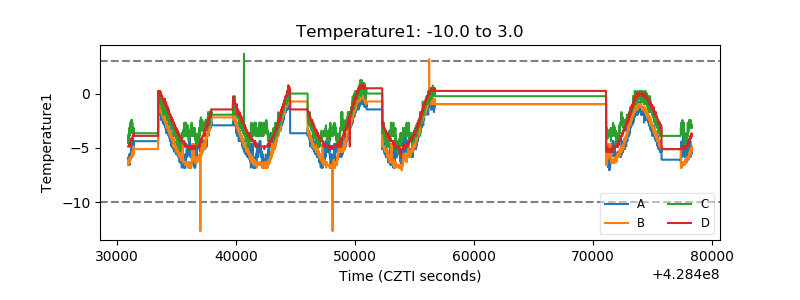 |
| Veto HV Monitor |  |
| Veto LLD | 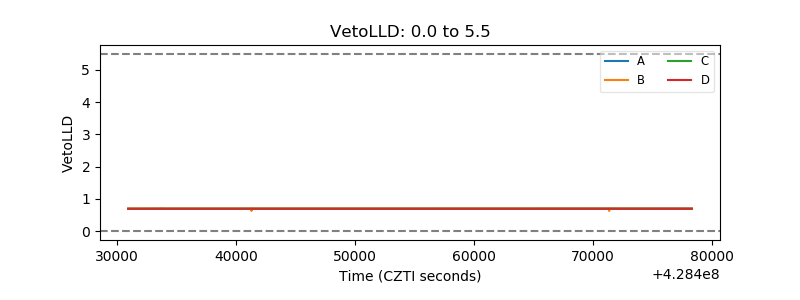 |
| Alpha Counter | 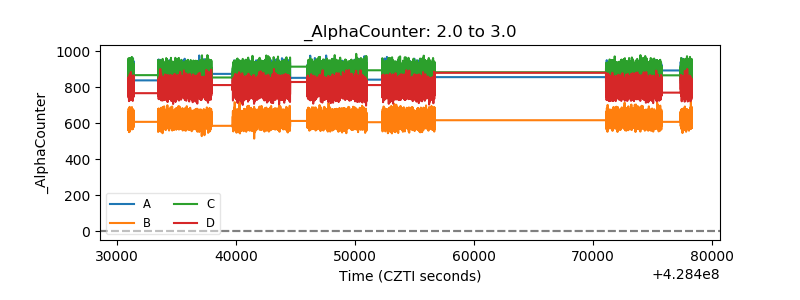 |
| _CPM_Rate | 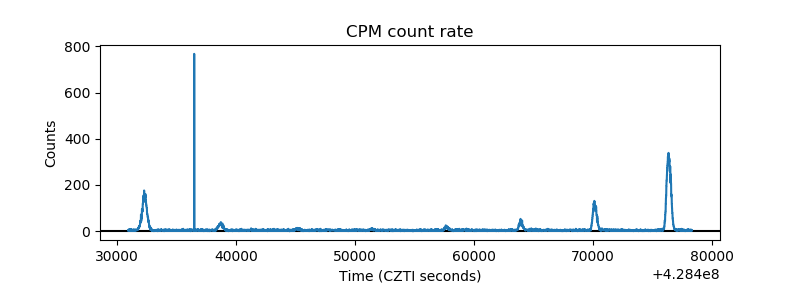 |
| CZT Counter | 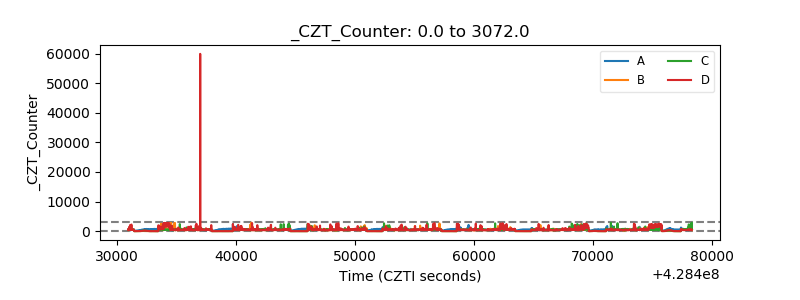 |
| +2.5 Volts monitor | 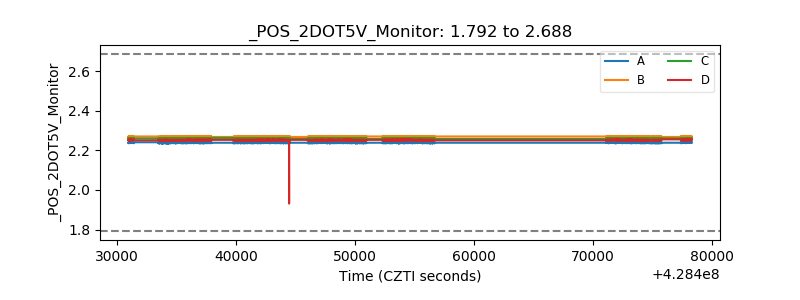 |
| +5 Volts monitor | 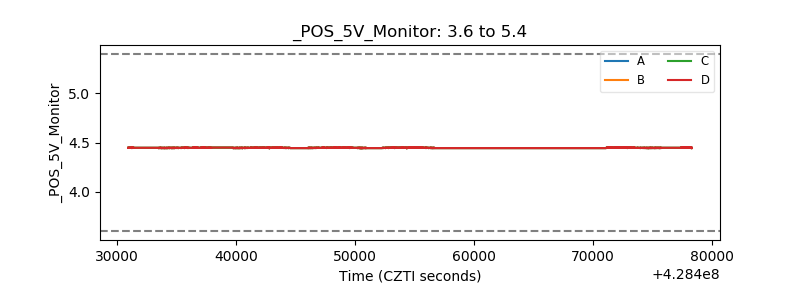 |
| _ROLL_ROT | 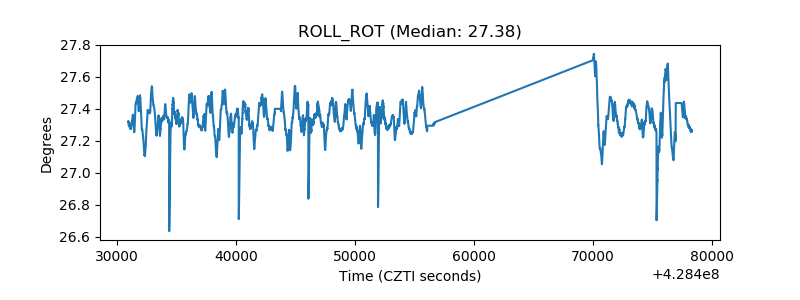 |
| _Roll_DEC | 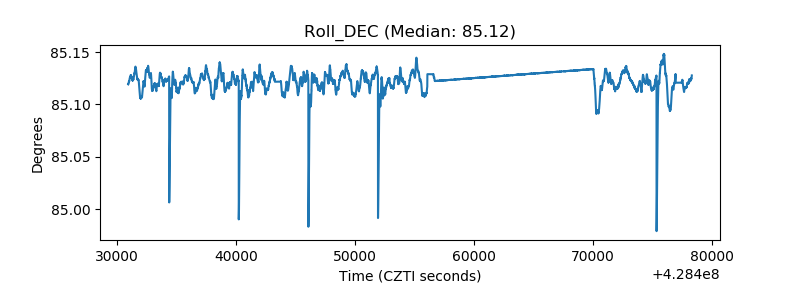 |
| _Roll_RA | 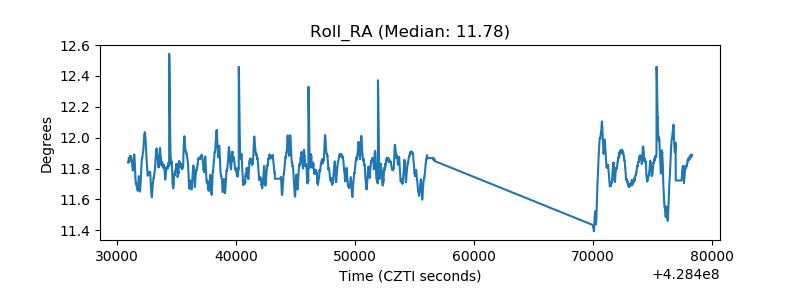 |
| Veto Counter |  |