| Param | Original file | Final file |
|---|---|---|
| Filename | modeM0/AS1C06_010T01_9000005800_42384cztM0_level2.fits | modeM0/AS1C06_010T01_9000005800_42384cztM0_level2_quad_clean.evt |
| Size (bytes) | 317,966,400 | 87,085,440 |
| Size | 303.2 MB | 83.1 MB |
| Events in quadrant A | 2,787,401 | 582,491 |
| Events in quadrant B | 2,472,965 | 590,514 |
| Events in quadrant C | 3,064,301 | 564,656 |
| Events in quadrant D | 3,029,795 | 525,784 |
| Mode M9 | |||
|---|---|---|---|
| Quadrant | BADHDUFLAG | Total packets | Discarded packets |
| A | 0 | 17 | 0 |
| B | 0 | 17 | 0 |
| C | 0 | 17 | 0 |
| D | 0 | 17 | 0 |
| Mode M0 | |||
|---|---|---|---|
| Quadrant | BADHDUFLAG | Total packets | Discarded packets |
| A | 0 | 11400 | 1 |
| B | 0 | 11116 | 1 |
| C | 0 | 12469 | 1 |
| D | 0 | 12953 | 1 |
| Mode SS | |||
|---|---|---|---|
| Quadrant | BADHDUFLAG | Total packets | Discarded packets |
| A | 0 | 108 | 0 |
| B | 0 | 108 | 0 |
| C | 0 | 108 | 0 |
| D | 0 | 108 | 0 |
| Quadrant | Total seconds | Saturated seconds | Saturation percentage |
|---|---|---|---|
| A | 5332 | 10 | 0.187547% |
| B | 5333 | 27 | 0.506282% |
| C | 5333 | 104 | 1.950122% |
| D | 5333 | 102 | 1.912620% |
Noise dominated data is calculated using 1-second bins in cleaned event files. If a bin has >2000 counts, and if more than 50% of those come from <1% of pixels, then it is considered to be noise-dominated and hence unusable.
| Quadrant | # 1 sec bins | Bins with >0 counts | Bins with >2000 counts | High rate bins dominated by noise | Noise dominated (total time) | Noise dominated (detector-on time) | Marked lightcurve |
|---|---|---|---|---|---|---|---|
| A | 7034 | 5333 | 1 | 1 | 0.01% | 0.02% | 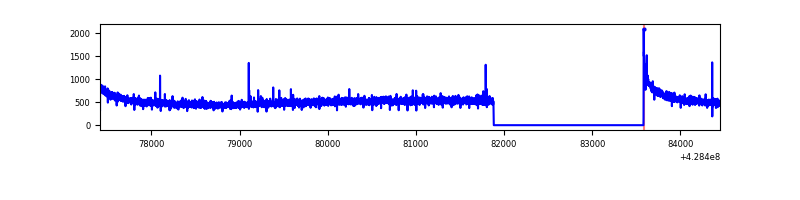 |
| B | 7035 | 5334 | 20 | 20 | 0.28% | 0.37% | 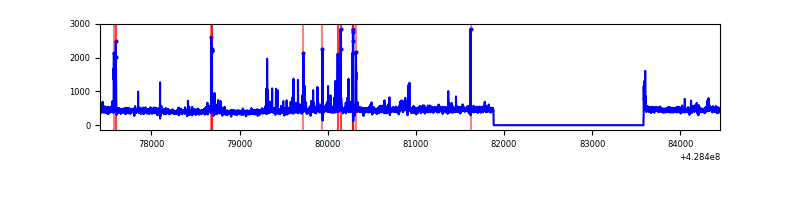 |
| C | 7035 | 5334 | 103 | 103 | 1.46% | 1.93% | 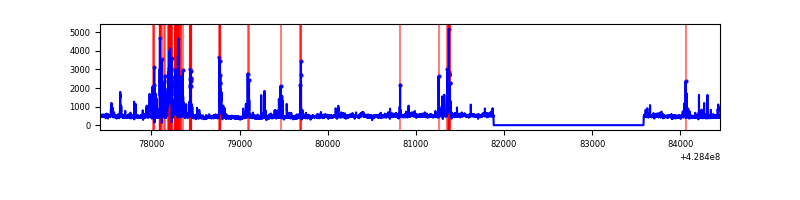 |
| D | 7035 | 5334 | 81 | 81 | 1.15% | 1.52% | 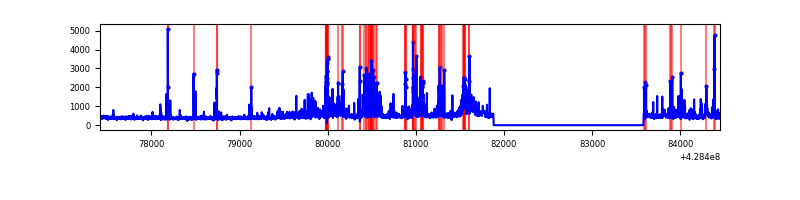 |
Top three noisy pixels from each quadrant. If the there are fewer than three noisy pixels in the level2.evt file, extra rows are filled as -1
| Pixel properties | Quadrant properties | ||||||
|---|---|---|---|---|---|---|---|
| Quadrant | DetID | PixID | Counts | Sigma | Mean | Median | Sigma |
| A | 10 | 83 | 544123 | 4604.35 | 576 | 564 | 118.1 |
| A | 13 | 248 | 8983 | 71.32 | 576 | 564 | 118.1 |
| A | 13 | 6 | 8016 | 63.12 | 576 | 564 | 118.1 |
| B | 5 | 172 | 91739 | 842.95 | 567 | 551 | 108.2 |
| B | 0 | 245 | 39701 | 361.91 | 567 | 551 | 108.2 |
| B | 4 | 81 | 27531 | 249.41 | 567 | 551 | 108.2 |
| C | 14 | 254 | 595109 | 4640.35 | 549 | 552 | 128.1 |
| C | 15 | 214 | 226230 | 1761.35 | 549 | 552 | 128.1 |
| C | 8 | 79 | 72552 | 561.94 | 549 | 552 | 128.1 |
| D | 1 | 52 | 205043 | 1516.82 | 555 | 540 | 134.8 |
| D | 10 | 118 | 144991 | 1071.41 | 555 | 540 | 134.8 |
| D | 2 | 249 | 100797 | 743.62 | 555 | 540 | 134.8 |
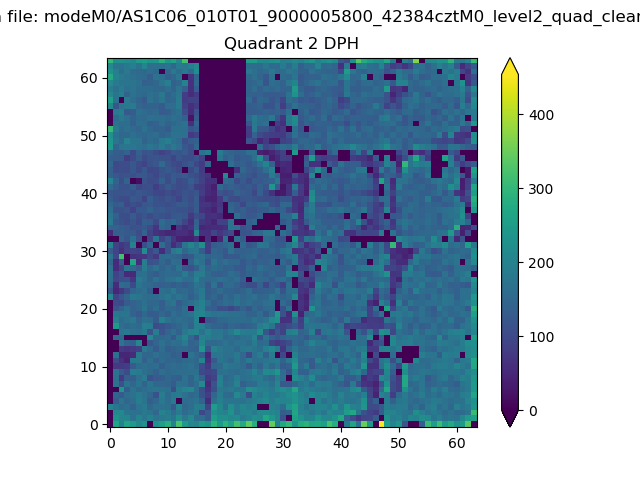
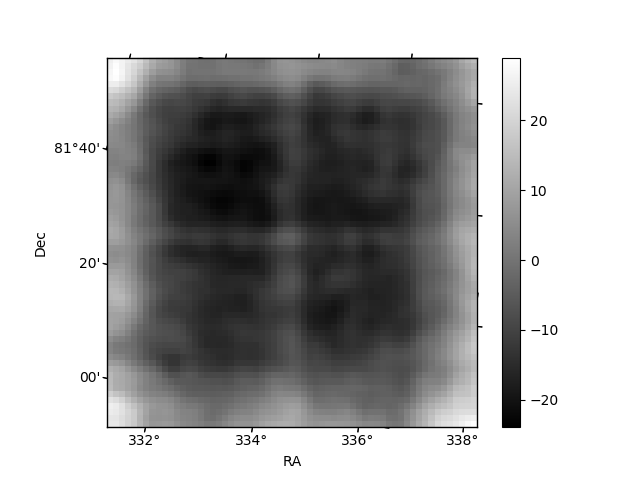
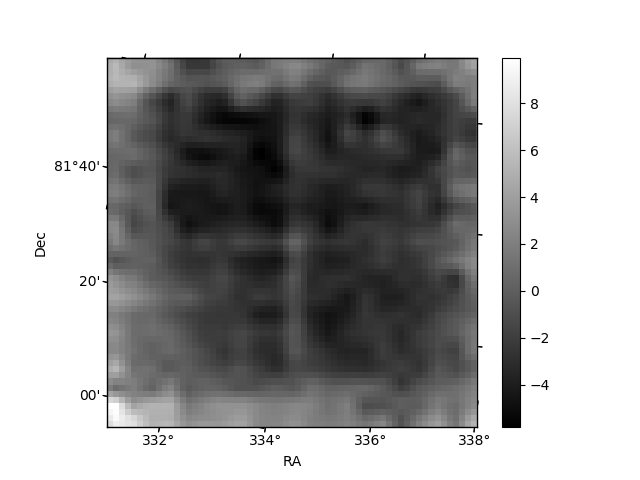
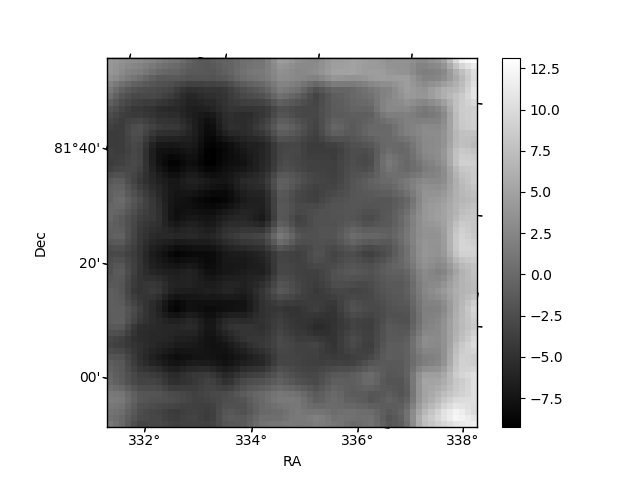
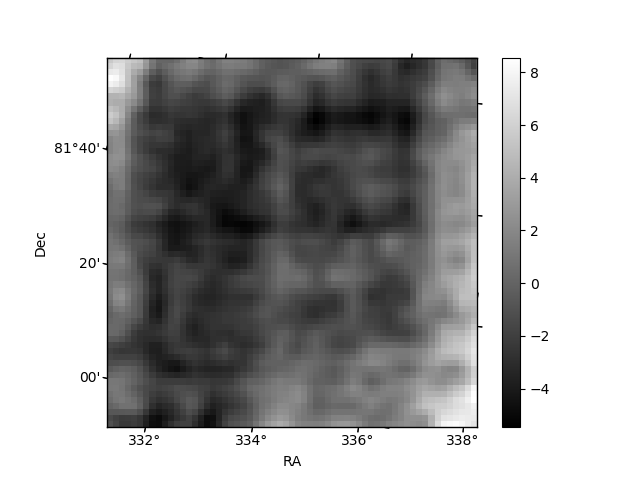
Histogram calculated using DETX and DETY for each event in the final _common_clean file
| Quadrant A | 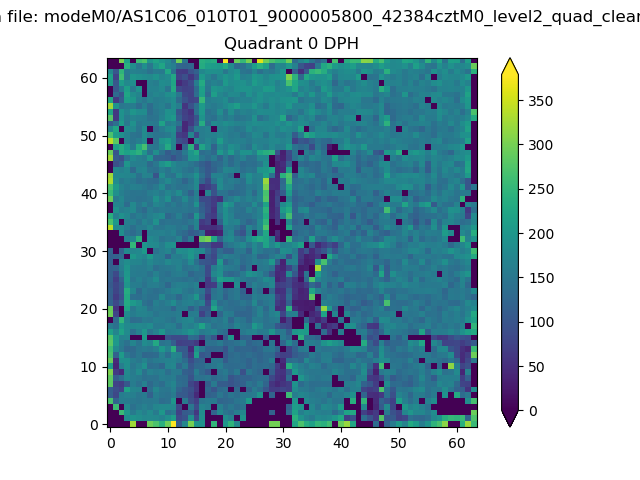 |
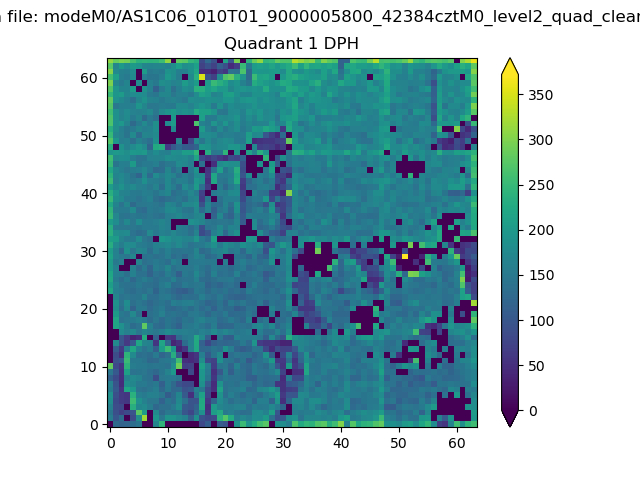 |
Quadrant B |
|---|---|---|---|
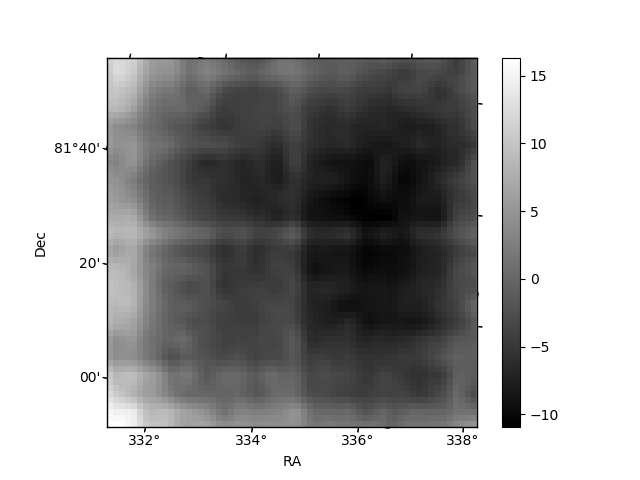
| Quadrant D | 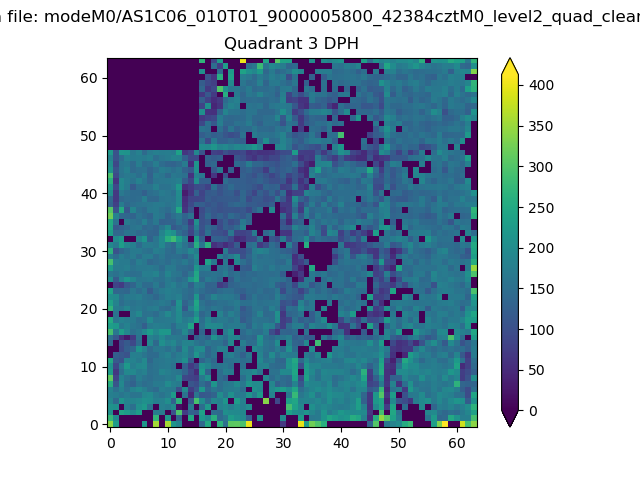 |
 |
Quadrant C |
| Plot type | Count rate plots | Images |
|---|---|---|
| Comparison with Poisson distribution Blue bars denote a histogram of data divided into 1 sec bins. Red curve is a Poisson curve with rate = median count rate of data. |
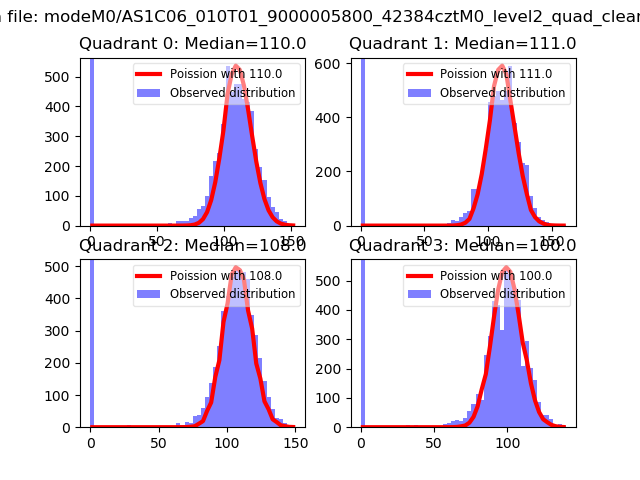 |
 |
| Quadrant-wise count rates Data is divided into 100 sec bins |
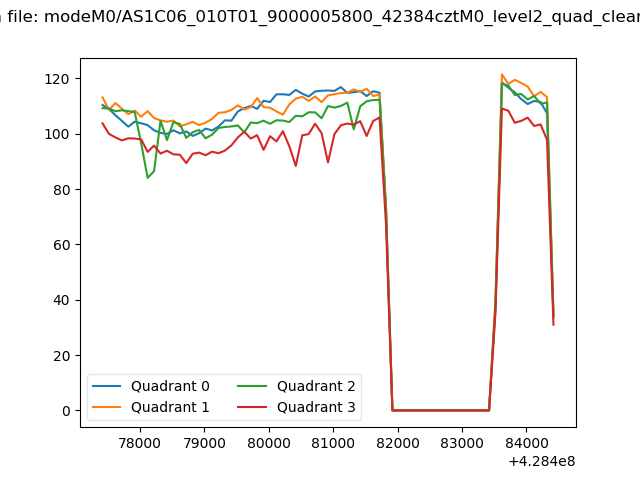 |
|
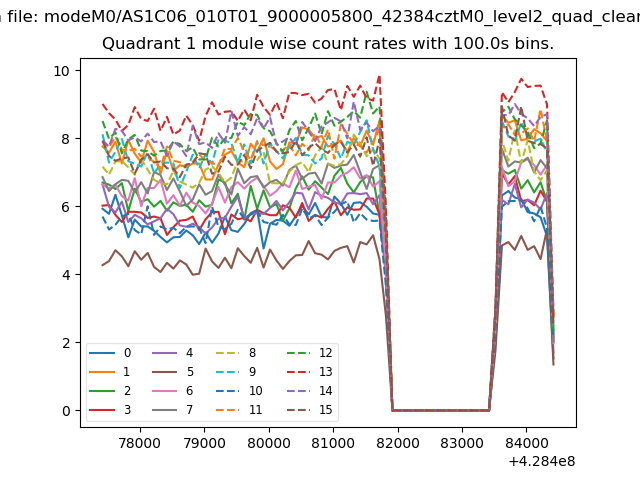
| Module-wise count rates for Quadrant A Data is divided into 100 sec bins |
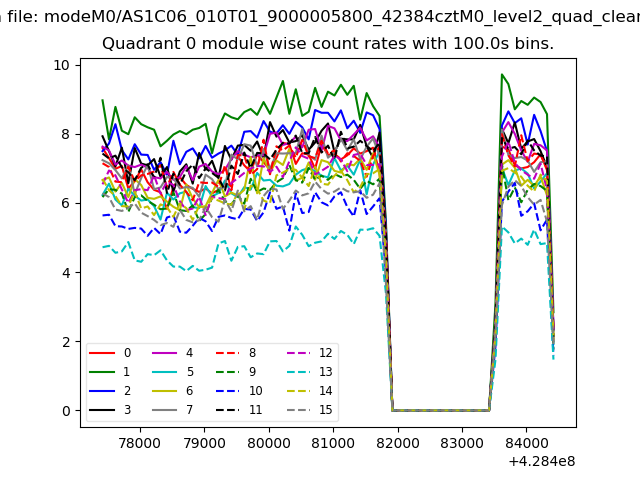 |
 |
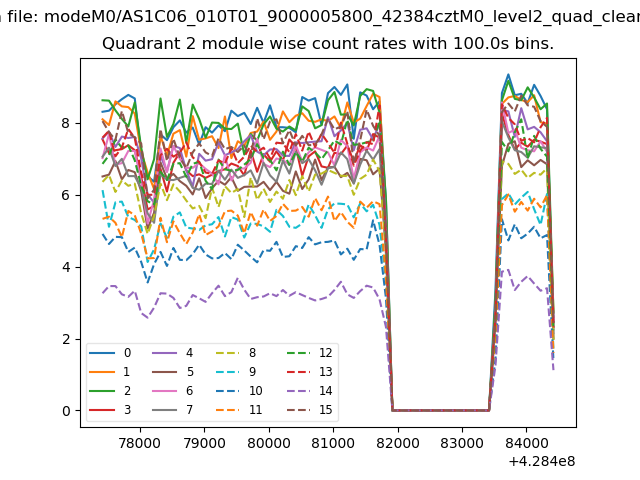
| Module-wise count rates for Quadrant B Data is divided into 100 sec bins |
 |
 |
| Module-wise count rates for Quadrant C Data is divided into 100 sec bins |
 |
 |
| Module-wise count rates for Quadrant D Data is divided into 100 sec bins |
 |
 |
| Parameter | Plot |
|---|---|
| CZT HV Monitor | 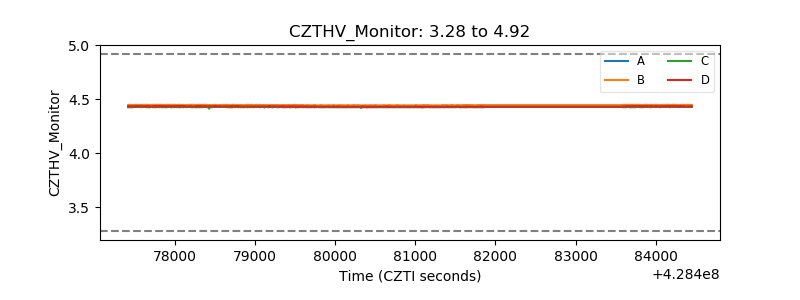 |
| D_VDD | 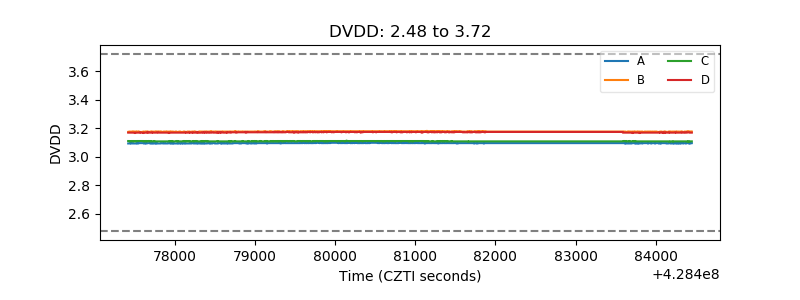 |
| Temperature 1 | 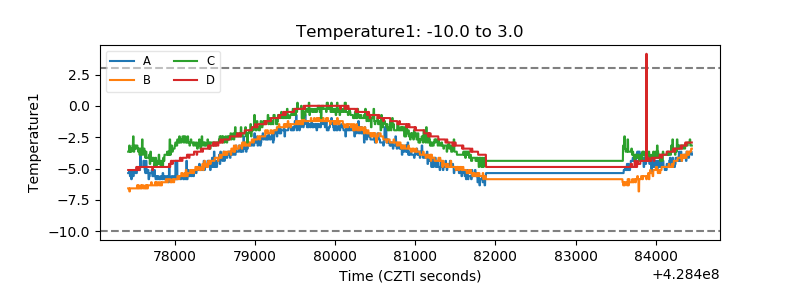 |
| Veto HV Monitor |  |
| Veto LLD | 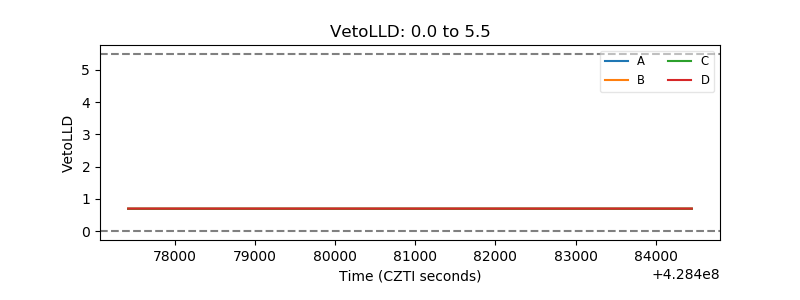 |
| Alpha Counter | 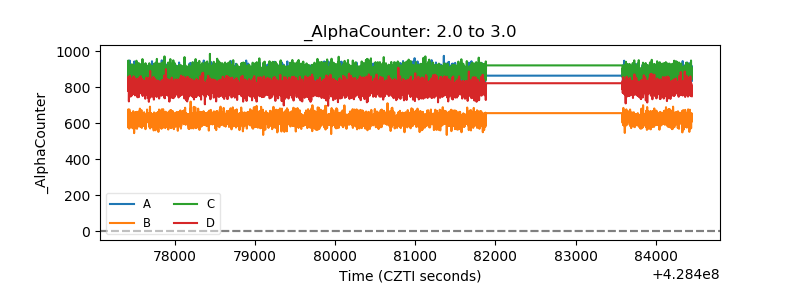 |
| _CPM_Rate | 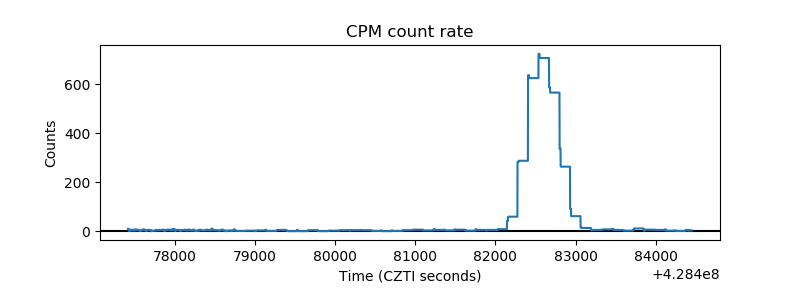 |
| CZT Counter | 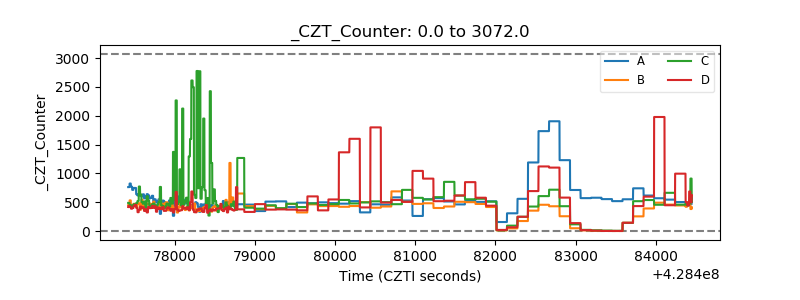 |
| +2.5 Volts monitor | 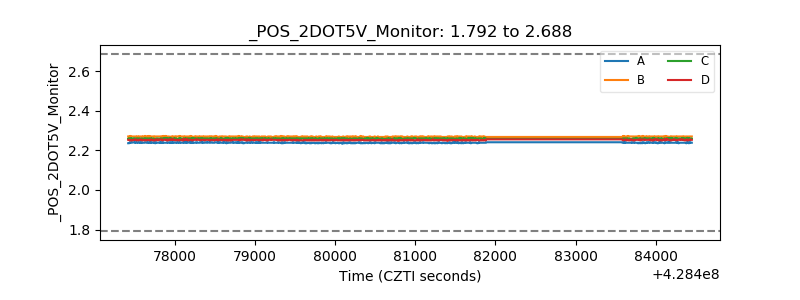 |
| +5 Volts monitor | 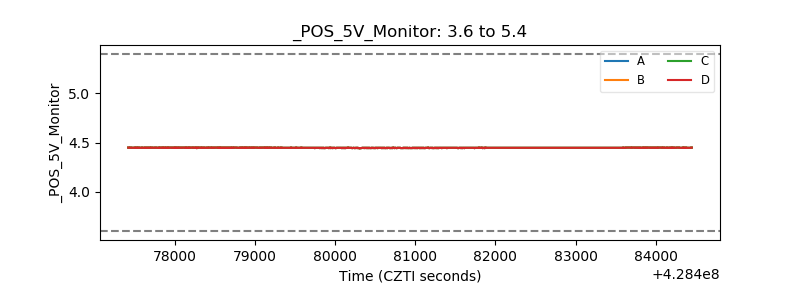 |
| _ROLL_ROT | 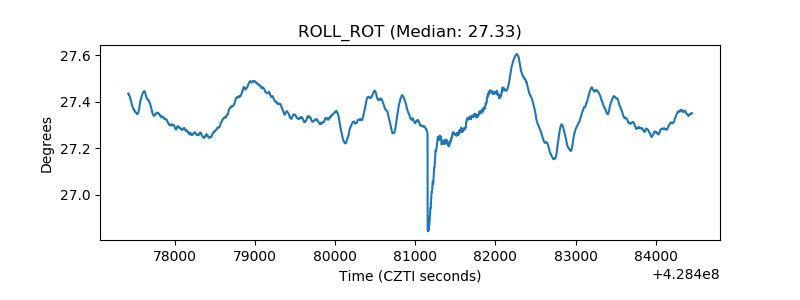 |
| _Roll_DEC | 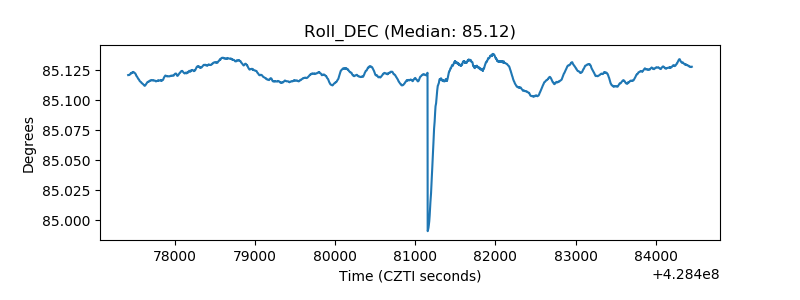 |
| _Roll_RA | 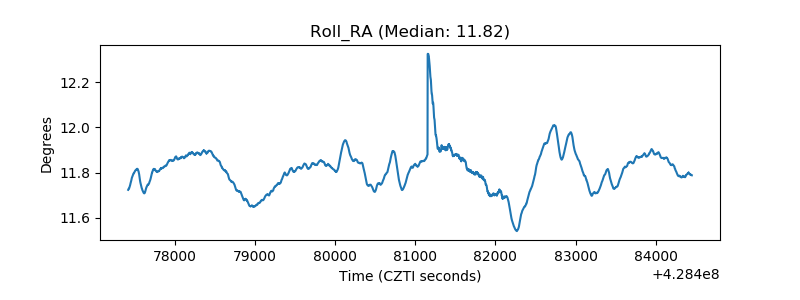 |
| Veto Counter | 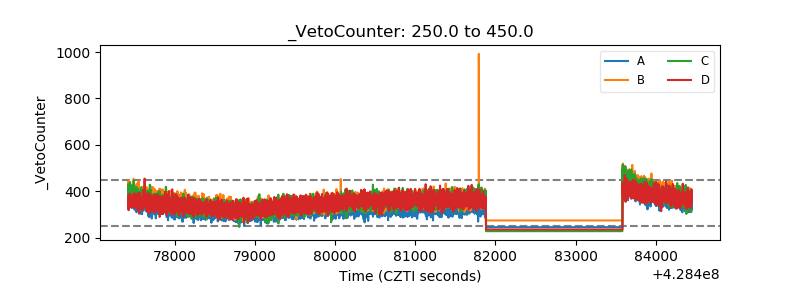 |