| Param | Original file | Final file |
|---|---|---|
| Filename | modeM0/AS1C06_010T01_9000005800_42385cztM0_level2.fits | modeM0/AS1C06_010T01_9000005800_42385cztM0_level2_quad_clean.evt |
| Size (bytes) | 307,500,480 | 88,833,600 |
| Size | 293.3 MB | 84.7 MB |
| Events in quadrant A | 2,854,495 | 602,702 |
| Events in quadrant B | 2,553,270 | 600,420 |
| Events in quadrant C | 2,775,905 | 578,440 |
| Events in quadrant D | 2,788,360 | 539,646 |
| Mode M9 | |||
|---|---|---|---|
| Quadrant | BADHDUFLAG | Total packets | Discarded packets |
| A | 0 | 21 | 0 |
| B | 0 | 22 | 0 |
| C | 0 | 22 | 0 |
| D | 0 | 22 | 0 |
| Mode M0 | |||
|---|---|---|---|
| Quadrant | BADHDUFLAG | Total packets | Discarded packets |
| A | 0 | 11504 | 2 |
| B | 0 | 11305 | 2 |
| C | 0 | 11479 | 3 |
| D | 0 | 11940 | 2 |
| Mode SS | |||
|---|---|---|---|
| Quadrant | BADHDUFLAG | Total packets | Discarded packets |
| A | 0 | 106 | 0 |
| B | 0 | 106 | 0 |
| C | 0 | 106 | 0 |
| D | 0 | 106 | 0 |
| Quadrant | Total seconds | Saturated seconds | Saturation percentage |
|---|---|---|---|
| A | 5268 | 15 | 0.284738% |
| B | 5268 | 89 | 1.689446% |
| C | 5267 | 42 | 0.797418% |
| D | 5267 | 63 | 1.196127% |
Noise dominated data is calculated using 1-second bins in cleaned event files. If a bin has >2000 counts, and if more than 50% of those come from <1% of pixels, then it is considered to be noise-dominated and hence unusable.
| Quadrant | # 1 sec bins | Bins with >0 counts | Bins with >2000 counts | High rate bins dominated by noise | Noise dominated (total time) | Noise dominated (detector-on time) | Marked lightcurve |
|---|---|---|---|---|---|---|---|
| A | 7121 | 5269 | 1 | 1 | 0.01% | 0.02% | 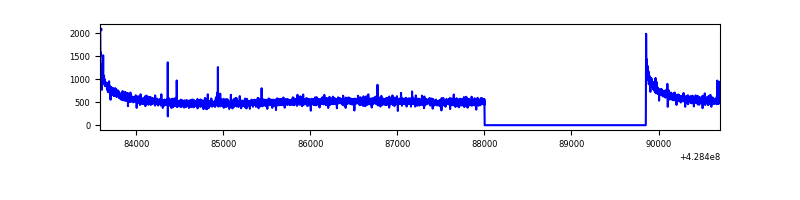 |
| B | 7121 | 5269 | 60 | 60 | 0.84% | 1.14% | 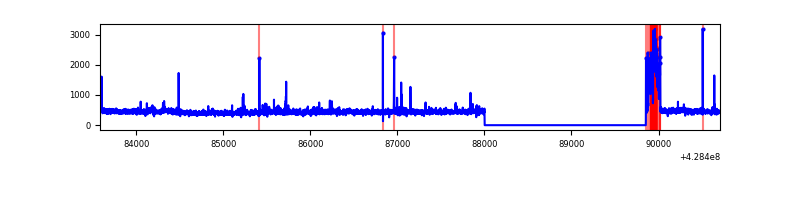 |
| C | 7120 | 5268 | 31 | 31 | 0.44% | 0.59% | 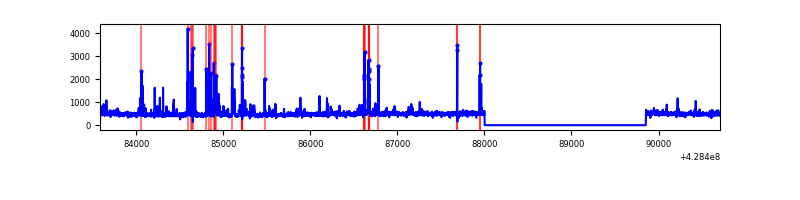 |
| D | 7120 | 5268 | 49 | 49 | 0.69% | 0.93% | 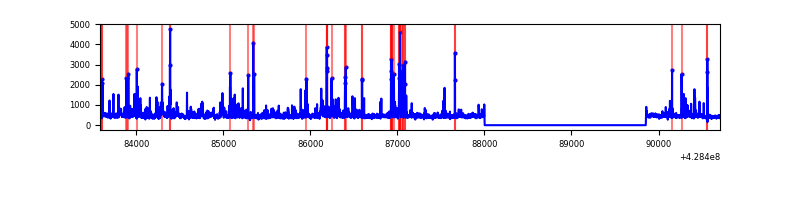 |
Top three noisy pixels from each quadrant. If the there are fewer than three noisy pixels in the level2.evt file, extra rows are filled as -1
| Pixel properties | Quadrant properties | ||||||
|---|---|---|---|---|---|---|---|
| Quadrant | DetID | PixID | Counts | Sigma | Mean | Median | Sigma |
| A | 10 | 83 | 594046 | 4992.33 | 581 | 568 | 118.9 |
| A | 13 | 254 | 6467 | 49.62 | 581 | 568 | 118.9 |
| A | 13 | 6 | 6443 | 49.42 | 581 | 568 | 118.9 |
| B | 4 | 81 | 237751 | 2171.55 | 568 | 552 | 109.2 |
| B | 0 | 245 | 20673 | 184.21 | 568 | 552 | 109.2 |
| B | 5 | 172 | 19986 | 177.92 | 568 | 552 | 109.2 |
| C | 14 | 254 | 269165 | 2067.04 | 556 | 559 | 129.9 |
| C | 15 | 214 | 223422 | 1715.03 | 556 | 559 | 129.9 |
| C | 8 | 79 | 52376 | 398.75 | 556 | 559 | 129.9 |
| D | 10 | 118 | 131362 | 962.68 | 563 | 547 | 135.9 |
| D | 13 | 249 | 78690 | 575.06 | 563 | 547 | 135.9 |
| D | 6 | 219 | 77753 | 568.17 | 563 | 547 | 135.9 |
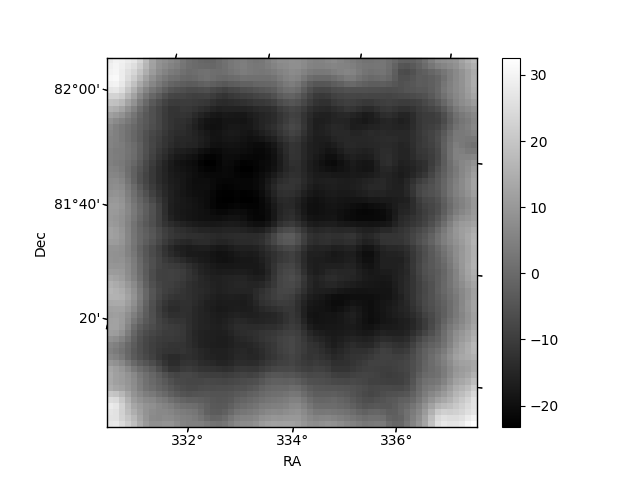
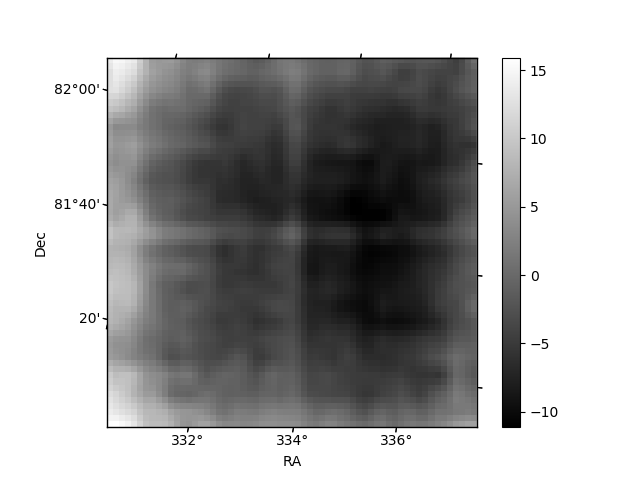
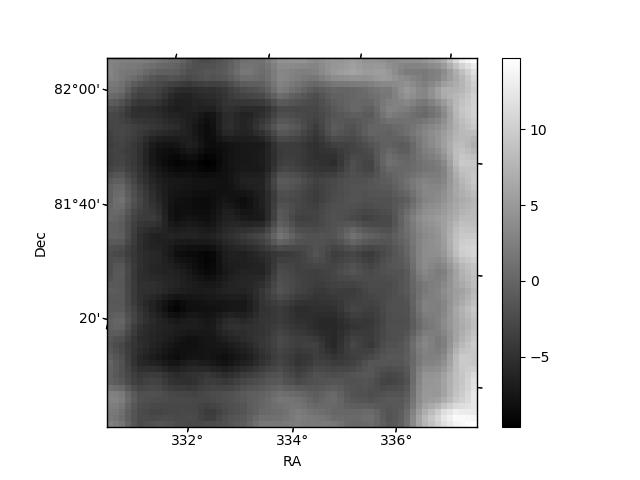
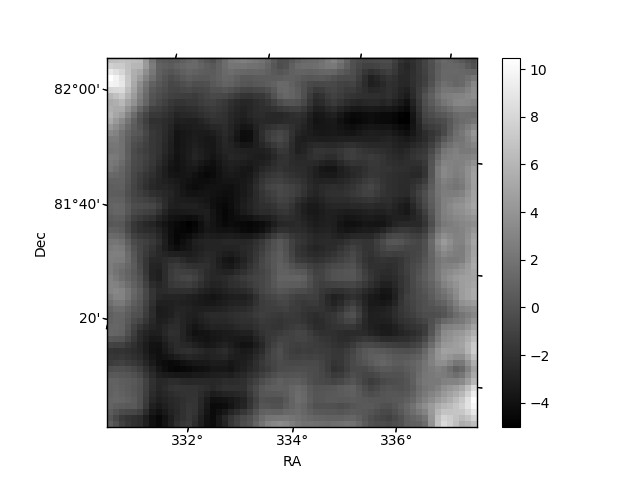
Histogram calculated using DETX and DETY for each event in the final _common_clean file
| Quadrant A | 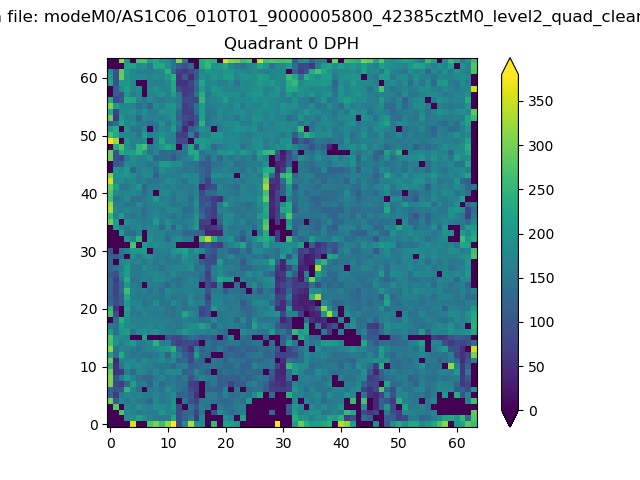 |
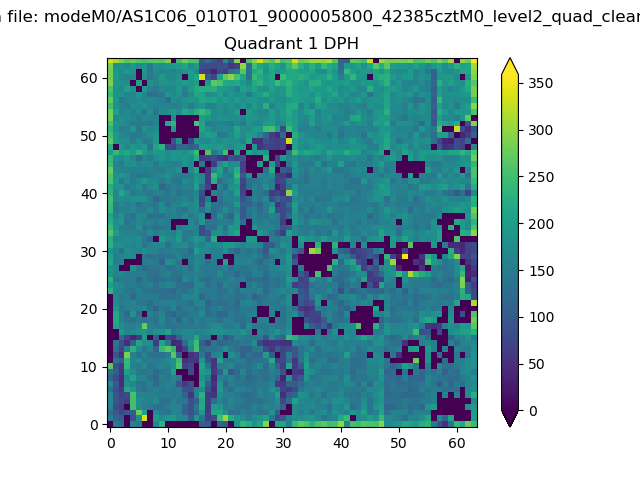 |
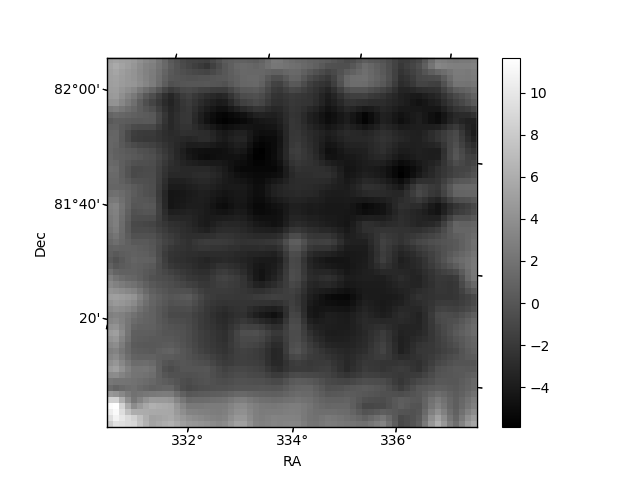
Quadrant B |
|---|---|---|---|
| Quadrant D |  |
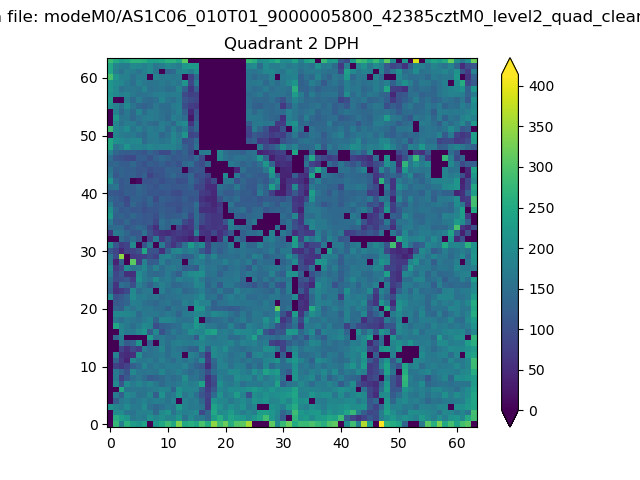 |
Quadrant C |
| Plot type | Count rate plots | Images |
|---|---|---|
| Comparison with Poisson distribution Blue bars denote a histogram of data divided into 1 sec bins. Red curve is a Poisson curve with rate = median count rate of data. |
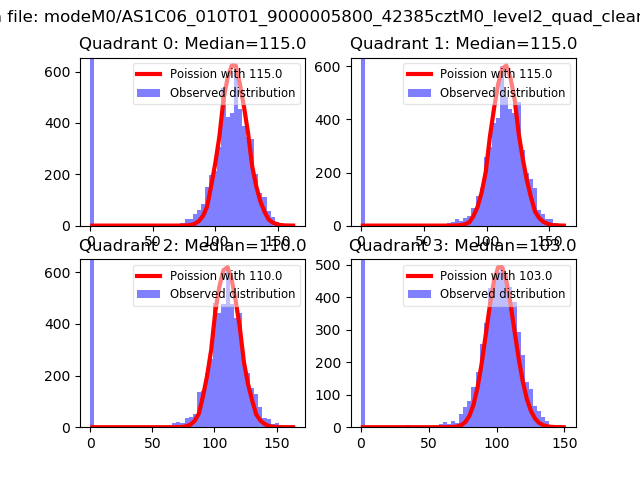 |
 |
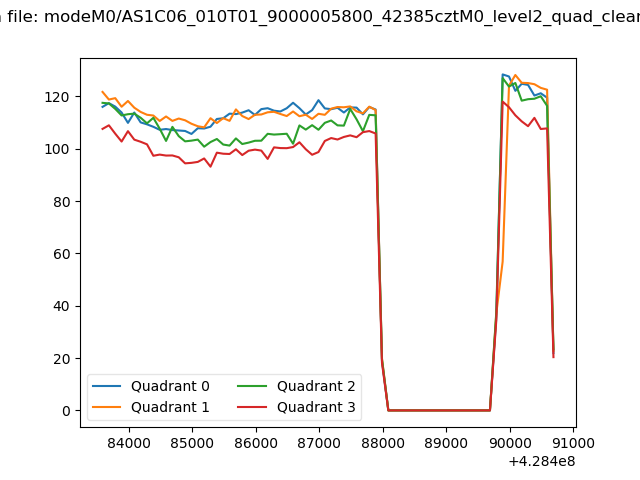
| Quadrant-wise count rates Data is divided into 100 sec bins |
 |
|
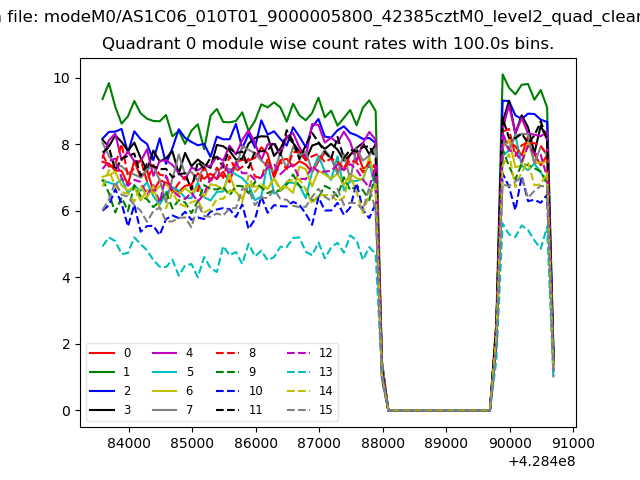
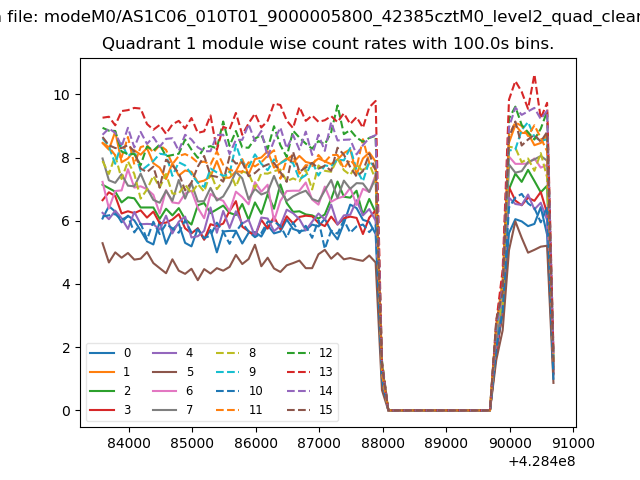
| Module-wise count rates for Quadrant A Data is divided into 100 sec bins |
 |
 |
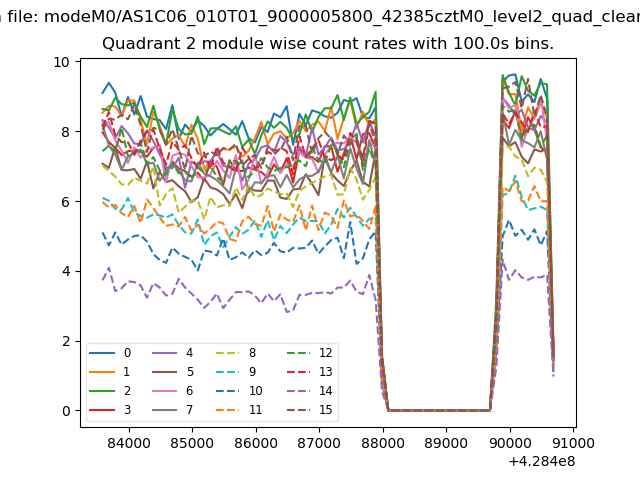
| Module-wise count rates for Quadrant B Data is divided into 100 sec bins |
 |
 |
| Module-wise count rates for Quadrant C Data is divided into 100 sec bins |
 |
 |
| Module-wise count rates for Quadrant D Data is divided into 100 sec bins |
 |
 |
| Parameter | Plot |
|---|---|
| CZT HV Monitor | 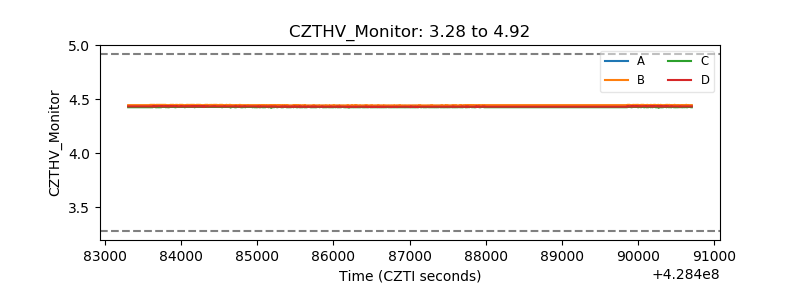 |
| D_VDD | 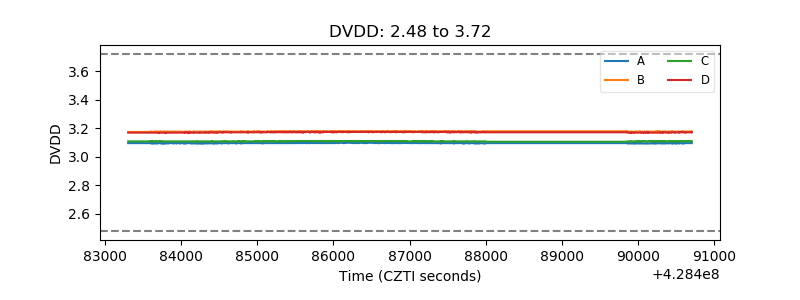 |
| Temperature 1 | 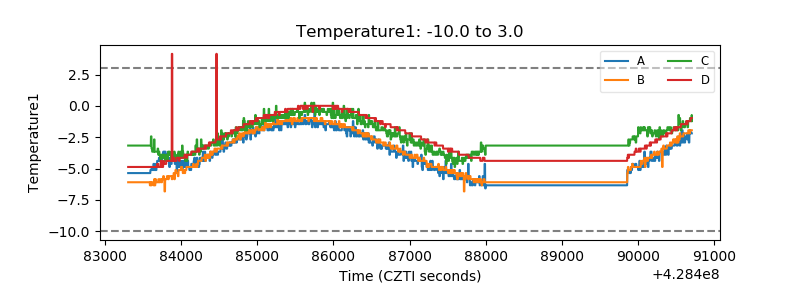 |
| Veto HV Monitor |  |
| Veto LLD | 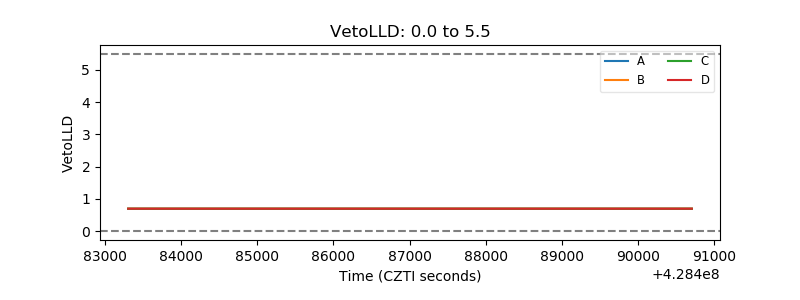 |
| Alpha Counter | 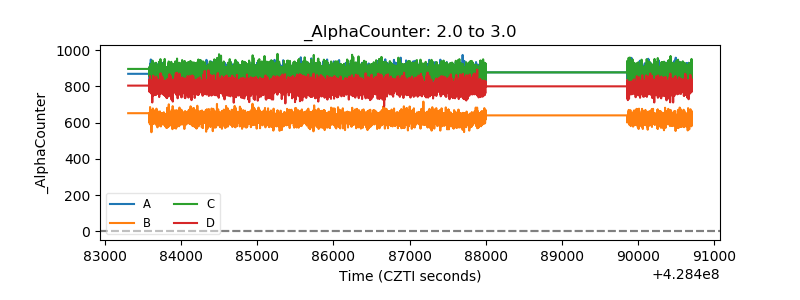 |
| _CPM_Rate | 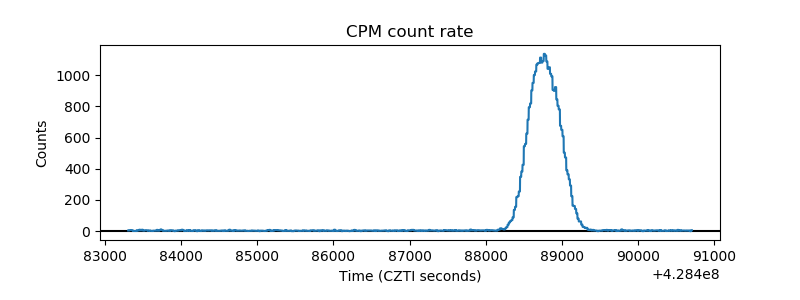 |
| CZT Counter | 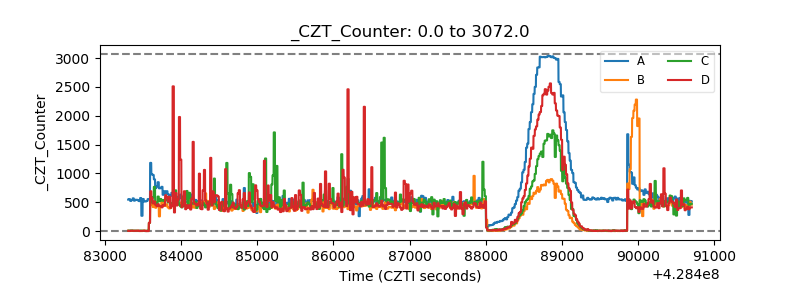 |
| +2.5 Volts monitor | 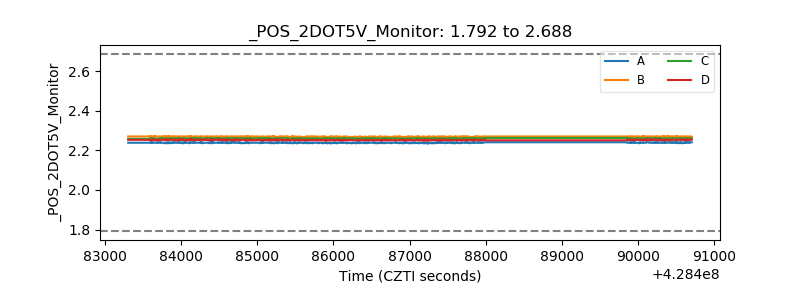 |
| +5 Volts monitor | 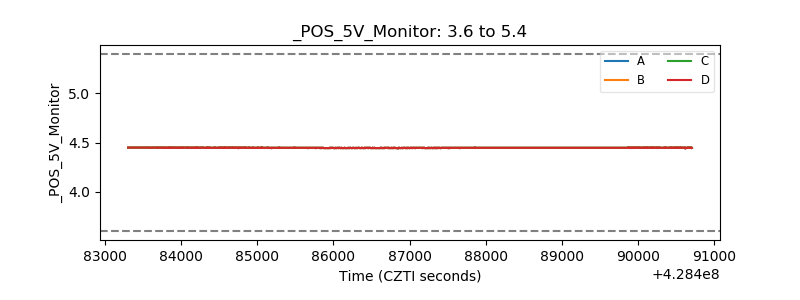 |
| _ROLL_ROT | 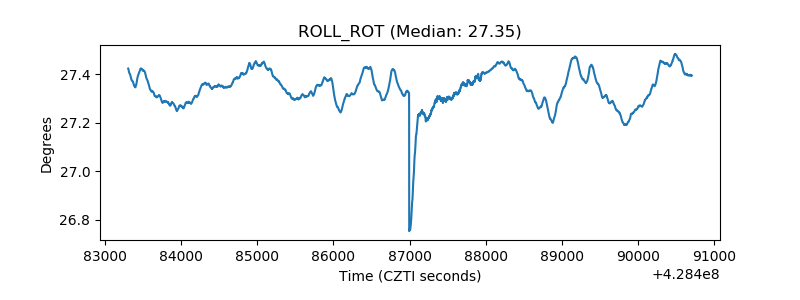 |
| _Roll_DEC | 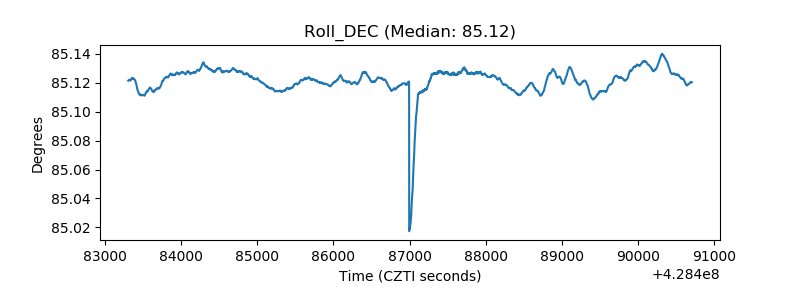 |
| _Roll_RA | 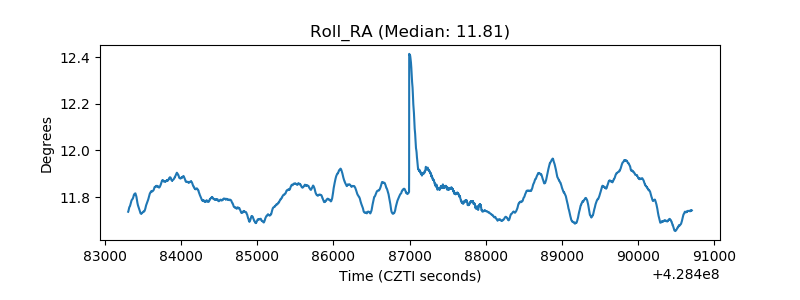 |
| Veto Counter |  |